


")
This article series aims at evaluating ETFs (exchange-traded funds) regarding past performance and portfolio metrics. Reviews with updated data are posted when necessary.
FNDF strategy
Schwab Fundamental International Large Company Index ETF (NYSEARCA:FNDF) was listed on 08/15/2013 and tracks the Russell RAFI™ Developed ex US Large Company Index. FNDF has $12.8B of assets under management, 928 holdings, a net expense ratio of 0.25% and a 30-day SEC yield of 2.93%. Distributions are paid semi-annually.
As described by FTSE Russell, the underlying index uses the RAFI methodology, which has a fundamental view of company size different from market capitalization. It selects and weights securities in the FTSE Global Total Cap Index (the parent index) using a fundamental score based on three metrics:
- Adjusted sales,
- Retained operating cash flow,
- Dividends plus buybacks.
The top 87.5% of the companies by cumulative fundamental score are included in the index. The index is calculated annually and partially reconstituted every quarter in four equal segments, resulting in an annual complete reconstitution. In the most recent fiscal year, the portfolio turnover rate was 10.8%. This article will use as a benchmark iShares Core MSCI Total International Stock ETF (IXUS), which tracks a broad ex-US equity index.
FNDF portfolio
Europe is the heaviest region, with about 49% of asset value. The top two countries are Japan (26.6%) and the UK (14.6%). Other countries are below 9%. Compared to the benchmark, FNDF overweights Japan, European countries as a whole, and South Korea. It ignores countries classified as developing markets like China, India and Taiwan.
Country allocation (chart: author; data: Schwab, iShares)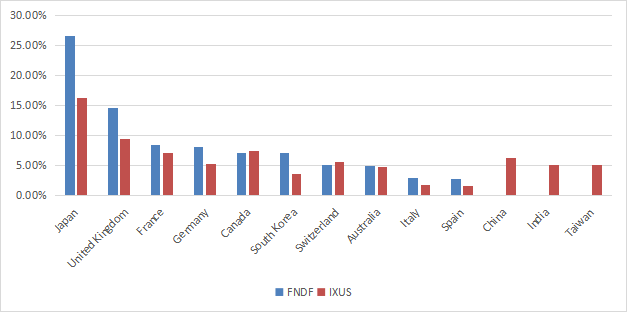
The top 2 sectors are financials (18.8% of assets) and industrials (15.4%). Compared to IXUS, FNDF overweights mostly materials, energy and utilities. It underweights technology, healthcare and real estate.
Sector breakdown (chart: author; data: Schwab, iShares)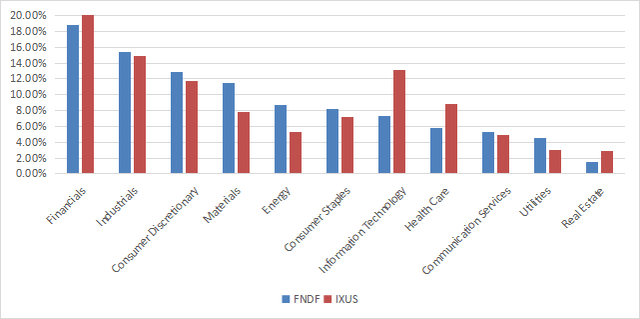
The top 10 holdings, listed below, represent 12.6% of assets and the heaviest one weighs 2.34%. Therefore, the portfolio is well-diversified and risks related to individual companies are low.
|
Name |
Weight % |
Country |
Ticker |
Sector |
|
SHELL PLC |
2.34 |
GB |
SHEL |
Energy |
|
SAMSUNG ELECTRONICS LTD |
2.10 |
KR |
5930 |
Technology |
|
TOYOTA MOTOR CORP |
1.89 |
JP |
7203 |
Cs Discretionary |
|
TOTALENERGIES |
1.30 |
FR |
TTE |
Energy |
|
BP PLC |
1.05 |
GB |
BP. |
Energy |
|
HONDA MOTOR LTD |
0.82 |
JP |
7267 |
Cs Discretionary |
|
GLENCORE PLC |
0.81 |
CH |
GLEN |
Materials |
|
NESTLE SA |
0.80 |
CH |
NESN |
Cs Staples |
|
BANCO SANTANDER SA |
0.78 |
ES |
SAN |
Financials |
|
BHP GROUP LTD |
0.75 |
AU |
BHP |
Materials |
Fundamentals
FNDF is materially cheaper than the benchmark regarding aggregate valuation ratios (reported below).
|
FNDF |
IXUS |
|
|
Price/Earnings TTM |
11.2 |
13.23 |
|
Price/Book |
1.15 |
1.59 |
|
Price/Sales |
0.7 |
1.23 |
|
Price/Cash Flow |
5.94 |
8.69 |
Source: Fidelity
Earnings growth is marginally better, but sales growth and cash flow growth rates are inferior to the benchmark.
|
FNDF |
IXUS |
|
|
Earnings growth % |
17.21% |
16.52% |
|
Sales growth % |
5.45% |
8.59% |
|
Cash flow growth % |
1.42% |
7.88% |
Source: Fidelity
Performance
Since inception, FNDF has outperformed IXUS by 1% in annualized return. Risk is a bit higher, measured as maximum drawdown and standard deviation of monthly returns (“volatility” in the next table).
|
Total Return |
Annual Return |
Drawdown |
Sharpe ratio |
Volatility |
|
|
FNDF |
87.91% |
6.13% |
-40.14% |
0.37 |
16.09% |
|
IXUS |
69.88% |
5.13% |
-36.22% |
0.32 |
15.04% |
Over the last 12 months, the gap is above 5%:
FNDF vs IXUS, last 12 months (Seeking Alpha)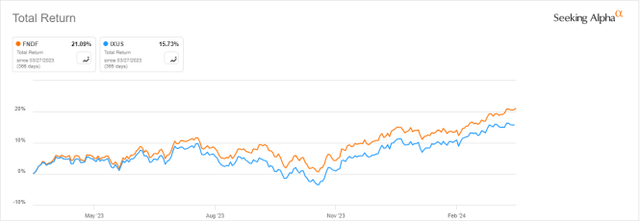
The annual sum of distributions has increased from $0.47 to $1.15 per share between 2014 and 2023. This growth rate of 144.7% in 9 years is far above the cumulative inflation (about 31% in the same time, based on CPI). Nonetheless, dividend growth has been quite irregular in the last 4 years, as reported by the chart below.
FNDF distribution history (Seeking Alpha)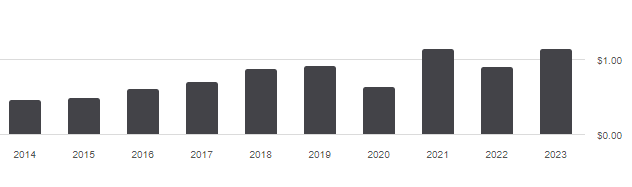
Competitors
The fund is classified by Fidelity in the “Foreign Large Value” category. Aggregate ratios confirm a tilt to the value style, and over 80% of assets is in stocks of large and mega cap companies. The next table compares characteristics of FNDF and four ex-US value ETFs with a heavy weight in large companies:
- Dimensional International Value ETF (DFIV)
- iShares MSCI EAFE Value ETF (EFV)
- Avantis International Large Cap Value ETF (AVIV)
- Alpha Architect International Quantitative Value ETF (IVAL)
|
FNDF |
DFIV |
EFV |
AVIV |
IVAL |
|
|
Inception |
08/15/2013 |
4/16/1999 |
8/1/2005 |
9/29/2021 |
12/16/2014 |
|
Expense Ratio |
0.25% |
0.27% |
0.34% |
0.25% |
0.39% |
|
AUM |
$12.77B |
$7.05B |
$17.25B |
$346.72M |
$156.38M |
|
Avg Daily Volume |
$36.56M |
$22.34M |
$143.26M |
$1.27M |
$503.25K |
|
Holdings |
928 |
547 |
494 |
528 |
56 |
|
Top 10 |
12.6% |
16.60% |
17.43% |
17.74% |
21.50% |
|
Turnover |
11% |
12% |
22% |
21% |
74% |
|
Yield TTM |
3.25% |
3.56% |
4.21% |
3.49% |
5.35% |
FNDF has the lowest fee (tie with AVIV), the lowest turnover, and is second of this group in size and liquidity. The next chart plots total returns, starting on 10/4/2021 to match historical data availability. FNDF is behind DFIV and on par with EFV.
FNDF vs competitors since 10/4/2021 (Seeking Alpha)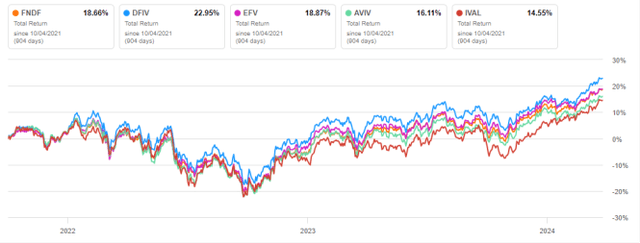
It is in the middle of the pack in 2024 to date:
FNDF vs competitors year-to-date (Seeking Alpha)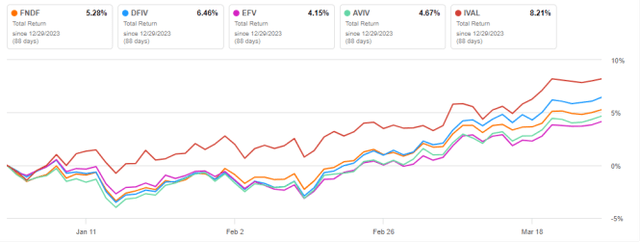
Takeaway
Schwab Fundamental International Large Company Index ETF uses the RAFI methodology, which has a fundamental view of company size different from market capitalization. The portfolio is well-diversified across sectors and holdings, but overweight in Japan. Valuation is better than an international benchmark, whereas growth metrics are slightly inferior. FNDF beats the benchmark since its inception, but performance has been average relative to peers since 2021.
")

")

")

")
