


")

")
Launched on 07/07/2015 and managed by Victory Capital Management Inc., VictoryShares US Large Cap High Div Volatility Wtd ETF (NASDAQ:CDL) is an ETF focused on high income through dividends coupled with low volatility. It currently manages about $350 million and distributes on a monthly basis.
CDL is arguably one of the best high-dividend-yield ETFs out there with an attractive past performance and a volatility weighting approach that makes sense for income investors. However, there is a better option available to such investors because the high expense ratio charged by CDL in addition to the high turnover rate could be the reasons it underperforms in the long term.
Methodology
First, let’s understand how this ETF works to achieve its goal. It employs a passive approach in that it tracks the performance of an index called the Nasdaq Victory US Large Cap High Dividend 100 Volatility Weighted Index. From the name of the index, it’s easy to vaguely understand what it does; the portfolio will have 100 large-cap stocks that are trading at a price providing high dividend yields and that are weighted according to the historical volatility they have exhibited.
Here is the selection/management process of the index:
- It uses the Nasdaq Victory US Large Cap 500 Volatility Weighted Index as its available universe to start with the 500 largest U.S. companies based on market cap that have had positive earnings over the last 12 months.
- It identifies the 100 stocks with the highest dividend yields within that index.
- It weighs them based on their daily standard deviation recorded over the last 180 trading days; it gives more weight to the stocks with a lower standard deviation.
- The index is reconstituted two times a year (March and September) and also deals with any significant concentration by adjusting the portfolio to not be exposed by more than 25% to a single sector.
Now that you understand the approach, let me share a couple of thoughts before we take a look at the allocations. First, I find the level of diversification adequate here. 100 constituents more or less at any time is neither too much nor too little when it comes to a dividend portfolio. The income investor’s concern should be the stable cash flows coming from it and less so the potential sacrifice of total returns that better diversification often brings.
Another thing I want to comment on is the simplicity of the approach. Of course, this can lead to fewer expenses, but I find the lack of any other dividend-related criterion than “high dividend yield” inadequate. Sure, the available universe has already filtered the stocks to have had positive earnings in the recent past, but this doesn’t guarantee adequate cash flow for the distributions. It’s common for other dividend ETFs to apply checks such as “consecutive dividend hikes in the last 5 years” or payout ratio limits which can provide more stability to the income generated.
Other than this, I appreciate the weighting approach. If your primary objective is high income through dividends, a more steady “ride” is worth it.
Allocations
Coming to the sector allocations, the largest exposure CDL has right now is to the Utilities sector:
Seeking Alpha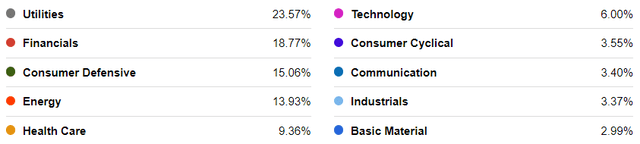
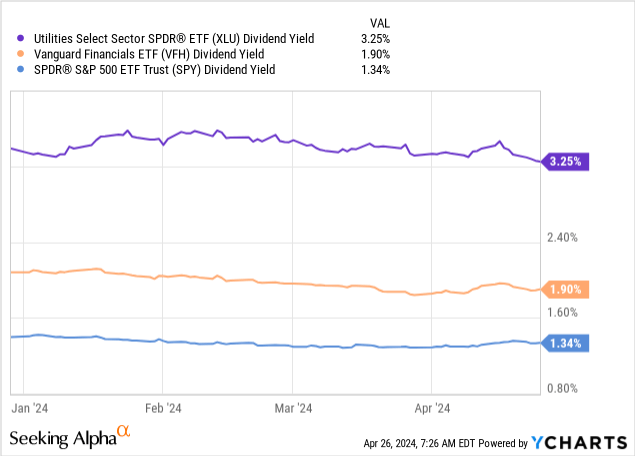
As you can see, the exposure is below the concentration cap of 25% the index applies, however. Its second biggest allocation is the Financials sector, which makes sense as companies in it are often famous for paying higher-than-average dividends. In fact, relevant ETFs offering exposure to these two sectors currently provide higher dividend yields than the broad market as represented by SPY:
Now, it appears that the approach of volatility weighting doesn’t result in extreme reliance on a few stocks. The highest weight was lately received by The Coca-Cola Company (KO) and it was only 1.59%:
Seeking Alpha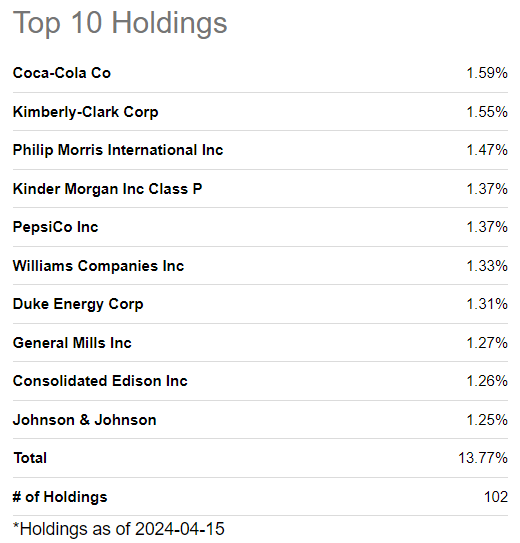
Seen in another way, the top 10 holdings accounted for only 13.77% of a portfolio with 100 stocks. So, CDL is well-diversified based on both sector and individual holding allocations.
Performance & Cost
When it comes to long-term performance, CDL has outperformed other high-dividend-yield ETFs:
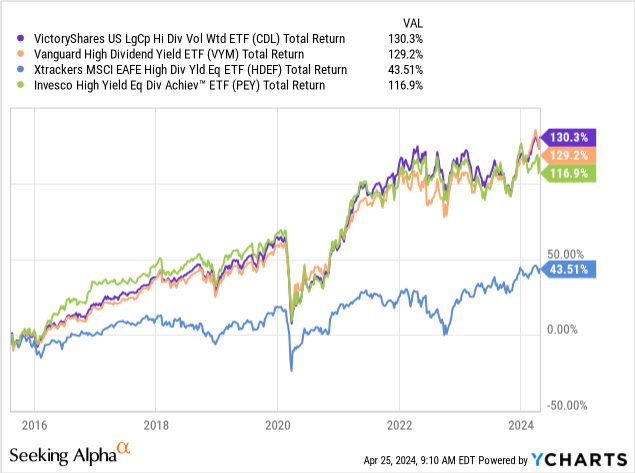
However, we need to note two things here. First, the difference in performance is marginal with the Vanguard High Dividend Yield ETF (VYM). Second, CDL has been a bit more volatile with a higher maximum drawdown than VYM in the past, making the fund realize a worse Sharpe:
portfoliovisualizer.com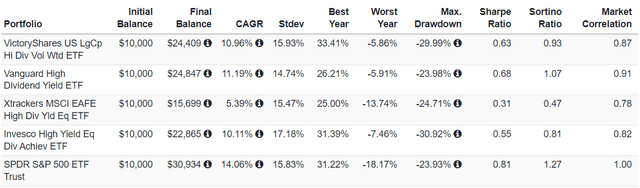
Truth be told, CDL’s current portfolio has lower P/E and P/B ratios at 15.64x and 2.11x, respectively; versus 18.6x and 2.7x for VYM. CDL also owns 102 stocks right now while VYM has 557. It’s not unreasonable that CDL might outperform VYM in the short term. We already know that it managed to perform better in the last 30 days and the trend might persist:
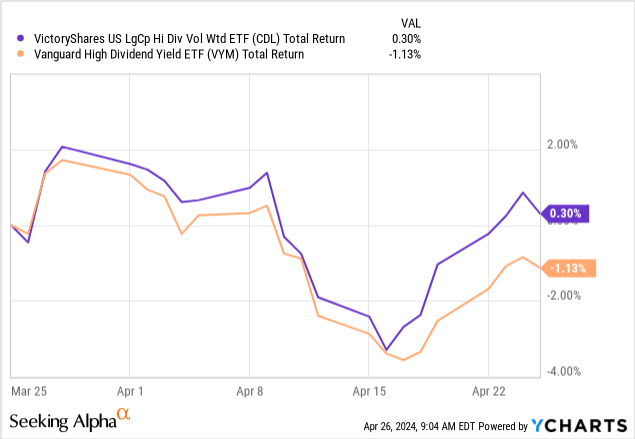
However, this should not concern long-term investors as it provides only a speculative thesis for traders.
Another thing you should take into account which is also related to performance is the massive difference in management expenses. CDL charges an expense ratio of 0.35%. VYM on the other hand charges 0.09% and it has been active way longer than CDL (launched on 11/10/2006). Moreover, CDL had a turnover rate of 47% during 2023 while VYM realized a 6% turnover.
Risks
Therefore, I believe that CDL’s most significant risk here is related to a potential opportunity cost. The high expense ratio and turnover may be a drag on the performance if you give it enough time. VYM seems to be the safer bet here.
Verdict
All in all, I appreciate the transparency regarding the index methodology when it comes to CDL, but its past track record and high expenses when compared to a similar and much larger fund like VYM ($67.9 billion in AUM) make it a hold for now.
But that’s my opinion based on what I was interested in checking about the fund. Have I missed something that you view as even more important? Feel free to share your thoughts below and I’ll make sure to get back to you soon. Thank you for reading for now.

 Q1 2024 Earnings Call Transcript")


