


How Volatility Can Benefit Fundamentals
Letter Summary
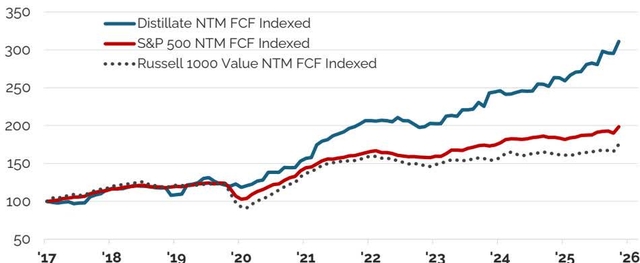
Amid a variety of crosscurrents and rich valuations, the U.S. equity market as proxied by the S&P 500 declined modestly in the first quarter of 2026. Beneath the surface of this headline decline, however, individual stock movements were much more varied with many underperforming or outperforming by 20 to 40 percentage points. Rather than add to the noise of voices opining about the various headwinds facing the market and the related investor angst that contributed to this wide dispersion in individual stock returns, we want to use this letter to focus on the opportunities it has created. Specifically, by systematically rotating out of names that have appreciated in price and gotten more expensive and reinvesting those proceeds into less expensive names, there is an ability to increase underlying free cash flows at the portfolio level (see Figure 1 below) on top of the growth generated by the underlying companies. We think this rebalancing benefit is underappreciated and is a powerful force that explains the outperformance of free-cash-flow-based value strategies over time. While valuation changes can cause shorter-term returns to swing around, longer-term returns are a product of fundamentals. We are focused on those fundamentals and will continue to take advantage of market turmoil to the benefit of our value-driven strategies.
Performance Summary
U.S. Fundamental Stability & Value (U.S. FSV): Amid a modest decline for US stocks in Q1, our U.S. FSV strategy net of fee return of -1.41% bested the S&P 500’s comparable gain of -4.35% but lagged the Russell 1000 Value’s 2.07% gain where a large energy weight supported returns. Annualized net of fee performance since inception is now 0.32% behind that of the S&P 500 and 3.61% ahead of the Russell 1000 Value Index.
U.S. Small/Mid Cap Quality & Value (SMID QV): Our SMID QV strategy returned 5.94% in Q1 2026 on a total return basis net of fees which compares to the Russell 2000 index’s total return of 0.92% and the Russell 2000 Value’s 5.04%. Annualized excess returns of our SMID QV since inception are 4.4% and 4.0% ahead of those benchmarks, respectively.
International Fundamental Stability & Value (Intl. FSV): Our 0.23% Q1 return after fees lagged the MSCI All Country Ex US ETF benchmark’s gain of 1.63% in Q1 and annualized net of fee performance since inception is ahead of the benchmark by 0.60%.
U.S. Large Cap Value 130/30 (U.S. Value 130/30): Our 130/30 strategy returned 6.93% vs. the S&P 500 Index’s return of -4.35%. This strategy is 3.4% ahead of the S&P 500 Index and 7.22% above the Russell 1000 Value Index on an annualized net of fee basis since inception.
U.S. Free Cash Flow 500: Our broader free-cash-flow-weighted portfolio returned -0.31% in Q1 vs. -4.35% for the S&P and is 2.61% ahead of that benchmark since its year-end 2024 inception on a net of fee annualized basis.
Figure 1: Indexed Next Twelve Months (NTM) Free Cash Flow
Source: FactSet. See additional methodology notes at end of paper.
Past performance does not guarantee future results. One cannot invest directly in an index.
Fundamentals Drive Returns
The U.S. stock market, as measured by the S&P 500 Index, declined modestly in the first quarter amid a variety of both financial and geopolitical headwinds. Under the surface, there was much greater turbulence and an enormous dispersion in individual stock returns. Rather than add to the cacophony of opinions by expounding on these various crosscurrents, we instead want to focus on how that dispersion in individual stock returns can create an opportunity to improve underlying fundamentals at a portfolio level.
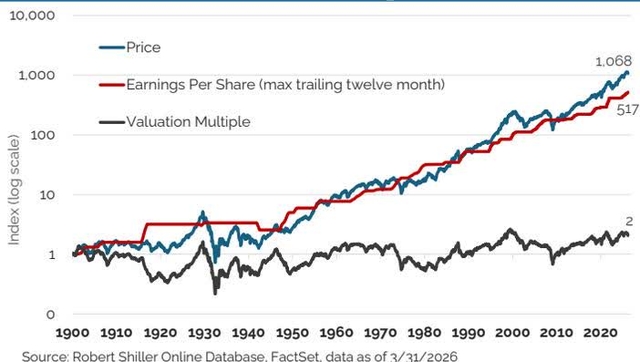
Very simply, stock prices are a product of their underlying fundamentals (free cash flow or earnings per share) and the valuation multiple applied to those fundamentals. We have shown before how over shorter time periods valuation multiples can vary widely and have a large impact on returns, but that over longer time horizons the variations average to near zero such that fundamentals are the only real determinant of returns longer term. This is evident in Figure 2 which shows the indexed performance of the S&P 500 going back to 1900 alongside the fundamental component (earnings per share) and the valuation multiple. Despite the market’s current elevated PE, nearly all of the equity market’s return is the result of earnings growth.
Earnings per share gains are the main reason the S&P 500 price has risen significantly since 1900.
Figure 2: Indexed S&P 500 Price Return, Earnings Per Share Growth, and Valuation Multiple Since 1900
Looking at a more recent history when free cash flow data is available, thereby improving comparability over time, and then segmenting the market by valuation quintile, produces a similar result (See Figure 3 ). Crucially, this analysis highlights that when free cash flow is utilized to assess valuations, value investing still works as the cheapest 20% of stocks produced far superior returns. Performance for the next cheapest quintiles follow a steady stairstep lower with the most expensive 20% of stocks underperforming all other groups and the overall Russell 1000 benchmark. While this supports the notion that value investing can still produce strong results, it does not show whether this outperformance came from underlying fundamental gains, as was the case with the S&P 500 back to 1900, or if the driver is valuation expansion.
On a free cash flow basis, the cheapest stocks have outperformed the most expensive ones significantly.
Figure 3: Indexed Total Return for Russell 1000 and Quintiles of Stocks by Quarterly FCF Yield
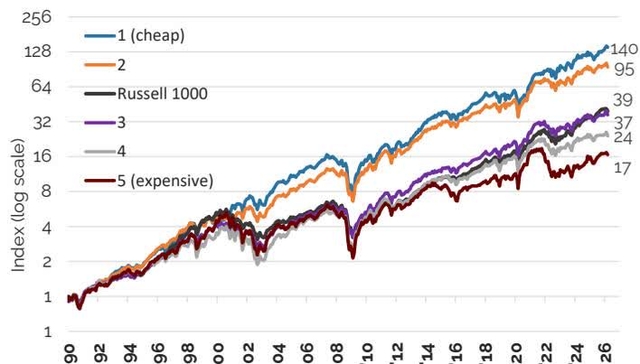
Source: Distillate Capital, FactSet. Data as from 1990 through Mar ’26. See end notes.
Figure 4 breaks down the performance for the cheapest quintile of stocks and the Russell 1000 Index by combining dividends and free cash flow growth into a single indexed measure of “fundamentals.” The figure then compares those fundamental measures to indexed total returns. This highlights again that the cheapest stocks outperformed the broader benchmark, but shows that the returns for both that group of stocks and the broader market were almost identical to their indexed fundamentals. So again, fundamentals drive return.
For both the outperforming cheapest quintile of stocks and the Russell 1000, gains since 1990 are nearly entirely due to fundamentals.
Figure 4: Indexed Total Return vs. Fundamental Growth for Russell 1000 vs. Cheapest Quintile of Stocks on FCF
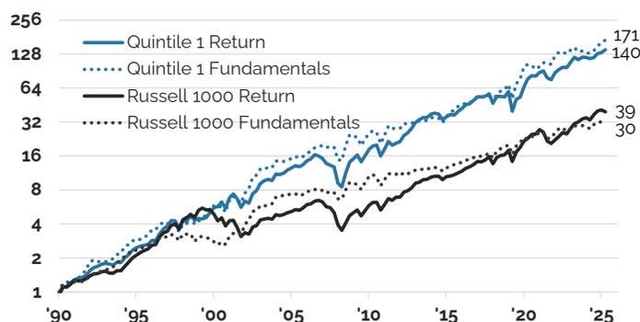
Source: Distillate Capital, FactSet. Data as from 1990 through 2025. See end notes.
Valuation, or the multiple of free cash flows, for the cheapest 20% of stocks and the Russell 1000 since 1990 is shown in Figure 5 and highlights several key things. First, valuations for both the cheapest stocks and the benchmark are roughly even with where they were in 1990, and so were not a significant driver of returns. This matches what we saw with the S&P 500 going back to 1900.
Second, while fundamentals drive longer-term returns, valuation multiples do swing around and impact shorter-term returns. This was especially true for the Russell 1000 as its multiple increased significantly in the late 1990s and early-2000 period, and has done so again recently. Third, the valuation for the cheapest stocks has been much more stable with a range of 8x to 15x and a median of 12x vs. the Russell 1000 free cash flow multiple which has ranged from 13x to 48x with a median of 22x. Lastly, the current free cash flow multiple for the broader market looks very rich at present relative to its historic median, while the cheapest 20% of stocks are trading at a multiple that is slightly below their historic median. This is similar to the valuation divergence experienced in 2000.
Valuation multiples for the Russell 1000 and cheapest quintile of stocks are not drivers of long-term returns but can be volatile in the short term.
Figure 5: FCF Multiple for Cheapest Quintile of Stocks vs. the Russell 1000 Benchmark
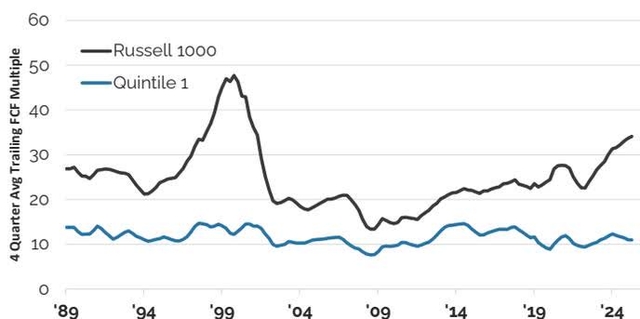
Source: Distillate Capital, FactSet. Data as from 1990 through 2025.. See end notes.
The key point of this analysis is that fundamentals are the key driver of returns. But secondly, and somewhat counterintuitively, is that the outperformance of free-cash-flow-based value strategies is due to better growth in underlying fundamentals and not valuation changes at a portfolio level. Perhaps versus what is expected, value as a strategy does well because of fundamental growth.
What ties these drivers together is rebalancing. Each time a stock in the value strategy gets more expensive and is sold, the proceeds of that sale are reinvested into a less expensive stock with a greater amount of underlying free cash flow per $ invested. The net result is better free cash flow growth at the portfolio level. For example, if stock A has a free cash yield of 5% and generates $5 of free cash flow for every $100 invested and is a 10% weight in a portfolio, it contributes 0.5% to the overall portfolio free cash yield or $0.50 for every $100 held. If that stock is sold and the proceeds are reinvested into a cheaper stock with a 10% free cash yield, the new stock’s contribution to the overall portfolio will be $1.00 of free cash flow compared to the previous $0.50. So by rebalancing out of the expensive name and into the cheaper one, the portfolio was able to increase its underlying free cash flows by $0.5 per $100 owned. If this is done systematically and consistently, a value-based investing approach can produce better growth in underlying fundamentals than the broader market. Since fundamentals drive returns, better performance should follow.
Higher Fundamental Growth via Rebalancing – A Real World Example:
To understand the benefit of systematic rebalancing back into less-expensive high-quality names, we examine the real-world example of how it has driven positioning in our large cap U.S. Fundamental Stability and Value (U.S. FSV) strategy during the most recent quarterly rebalance. Mentioned prior, the year began with an enormous amount of dispersion in individual stock performance, despite that the overall market was only modestly down. This created an unusually large opportunity as our holdings experienced significant differences in performance as well with many stocks rising well ahead of gains in their underlying fundamentals. Many of those stocks were sold or reduced as a result as they became relatively more expensive. On the flip side, many underperforming stocks got cheaper, resulting in additions to several held names and the initiation of positions in a meaningful number of new companies. In general, stocks that outperformed the market were sold or trimmed and ones that underperformed were purchased or added to. This is shown in Figure 6 .
Outperforming stocks were generally sold and underperformers added.
Figure 6: Relative Return of Stocks in Distillate’s U.S. FSV Strategy Shaded by Portfolio Change
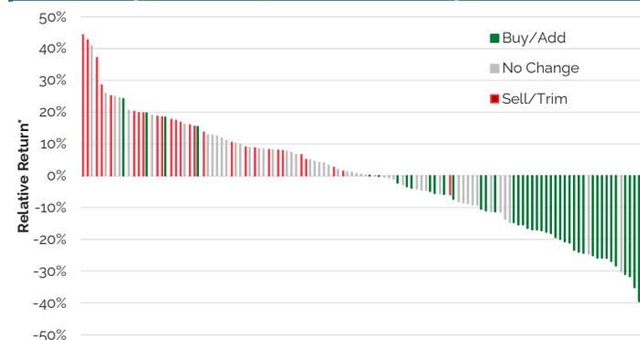
*Price return relative to the S&P 500 from 12/31/2025 to the March 2026 rebalance
Source: FactSet
In aggregate, the group of stocks that were sold or trimmed had a weighted average next-twelve-month free cash flow yield (FCF yield) of 6.1% while the stocks that were purchased or added to had a comparable weighted FCF yield of 7.3%. Since each group had a weight of 29% (an unusually high amount of turnover due to the large price moves), the exiting/trimmed group of stocks contributed a weighted 1.7% points to our strategy’s FCF yield before the rebalance (7.3% x 29%) while the purchased and added stocks contributed 2.1% points to the rebalanced portfolio’s FCF/EV yield (7.3% x 29%). The remainder of the portfolio held stable and contributed 5.7 percentage points of free cash yield to both the old and rebalanced portfolios. These yields and their contribution to the portfolio are shown in Figure 7 on the next page.
By rebalancing out of expensive names into cheaper ones, Distillate’s U.S. FSV strategy increased its underlying free cash flow.
Figure 7: U.S. FSV Strategy Free Cash to EV Yield by Exited/Trimmed vs. Bought/Added Names
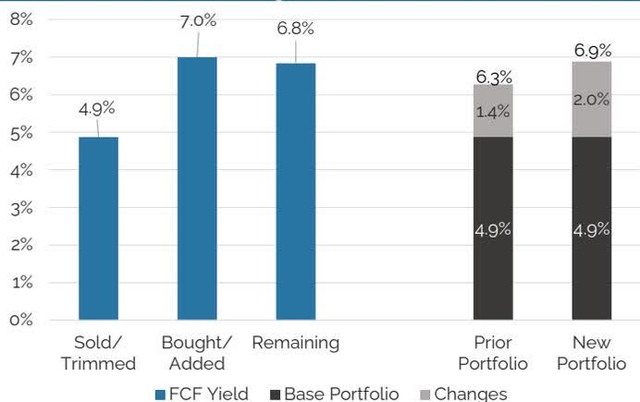
Source: Distillate Capital, FactSet. Data as of 3/31/2026
By rebalancing out of more expensive names and reinvesting those proceeds into cheaper names, Distillate’s U.S. FSV strategy saw its underlying free cash flow increase from $7.4 for each $100 invested to $7.8 in the quarter. Importantly, the gain was achieved without any sacrifice in our quality metrics or by reducing diversification.
Each of our strategies is rebalanced quarterly, and since the US FSV strategy’s inception in 2017, the free cash flow growth at the portfolio level has been much stronger than either the S&P 500 or Russell 1000 (See Figure 8) as a result.
Underlying free cash flow growth has been better for Distillate’s U.S. FSV strategy than for its benchmarks.
Figure 8: Indexed NTM Free Cash Flow
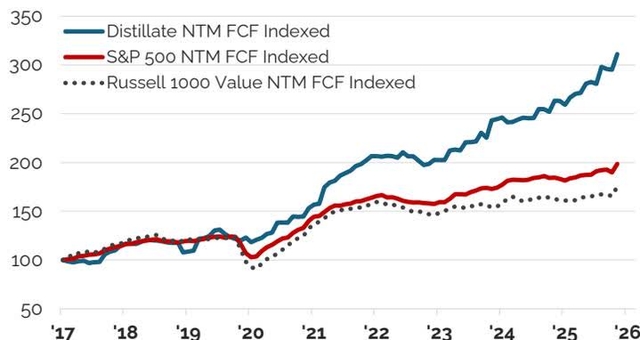
Source: FactSet. See additional methodology notes at end of paper.
The evidence is that fundamentals ultimately drive returns. As such, systematic rebalancing into better-valued stocks, if valuation is measured accurately, stands to generate better-than-market fundamental growth over time. While the benefits of such an approach can be outweighed temporarily when the broader market sees significant multiple expansion as happened in the late 1990s and early 2000 period, and again most recently, fundamentals ultimately always mattered far more in the past, and we expect that to remain true in the future.
U.S. Large Cap Strategy
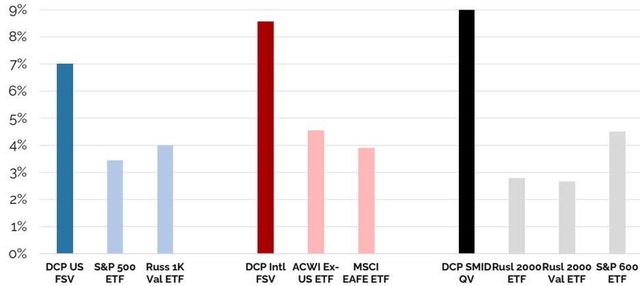
As a result of the large benefit of rebalancing, our U.S. FSV strategy saw its consensus estimated next-twelve-month free cash to enterprise value yield (FCF/EV) increase sharply in Q1. The valuation for the overall market also improved, but to a much lesser degree and due to price weakness instead of rebalancing-related benefits. The result is that our U.S. FSV strategy is now trading at its cheapest level ever both in absolute and relative terms (See Figure 9).
Distillate’s U.S. FSV is significantly cheaper than its benchmarks.
Figure 9: Free Cash (NTM) to Enterprise Value (EV) Yield for Distillate’s U.S. FSV vs. Benchmarks
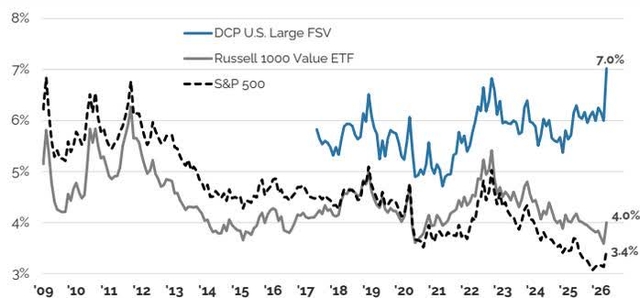
Source: FactSet
Regarding specific holdings, Salesforce was the largest added-to position in the quarter and typifies the type of opportunity we are seeing. While the company has previously traded at levels we consider very expensive, 40-50x NTM FCF, that multiple has now dropped to around 11x while underlying free cash per share has grown solidly (See Figure 10). The stock fell amid worries about how AI might impact it in the longer term even though fundamentals remain strong. While we do not know what the future holds, the company is trading at a valuation at which it can buy back nearly 10% of its stock each year. If fundamentals keep growing even modestly, the company will in theory be able to buy back all its equity in just a few years. This is reminiscent of Microsoft 15 years ago when fears of competition from free Google products and management concerns rendered it similarly cheap. It proved to be a significant opportunity at the time to buy a well entrenched technology player with annuity characteristics, and Salesforce today has many of the same attributes.
Distillate’s U.S. FSV is significantly cheaper than its benchmarks.
Figure 10: Salesforce NTM FCF vs. Multiple
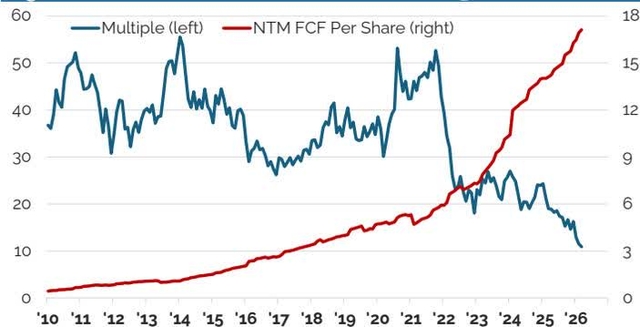
Source: FactSet, data through 3/31/2026
U.S. Small/Mid Cap Strategy
We see a significant opportunity in small and mid-sized U.S. stocks as well. Within this space, however, there are an alarmingly large number of unprofitable and heavily indebted companies, making selectivity critical in our view. While unprofitable and highly leveraged stocks have outperformed significantly in recent quarters, this has not been the case historically. Both this recent and longer-term performance is evident in a relative return comparison of the higher quality S&P 600, which excludes many unprofitable stocks, and the Russell 2000 which does not (See Figure 11).
Since inception, the higher quality S&P 600 has significantly outperformed the Russell 2000 but lagged significantly in recent years as lower quality stocks outperformed.
Figure 11: S&P 600 Total Return Relative to Russell 2000
Source: FactSet, data through 3/31/2026
Consistent with the outperformance of quality in the long term, our strategy systematically seeks to avoid lower quality stocks that have either high leverage or low free cash profitability. The results of this approach can be seen in Figure 12 which shows the NTM FCF/EV valuation and leverage for all stocks in the Russell 2000 benchmark in grey and our holdings in blue.
The Distillate U.S. Small/Mid Cap strategy selects stocks at the intersection of low debt and attractive valuation, as measured by free cash yields. We highlight a risk in the small cap market of companies that not only have high debt levels but are cash flow negative – a dangerous combination in our opinion.
Figure 12: Small/Mid Stock Valuation vs. Leverage
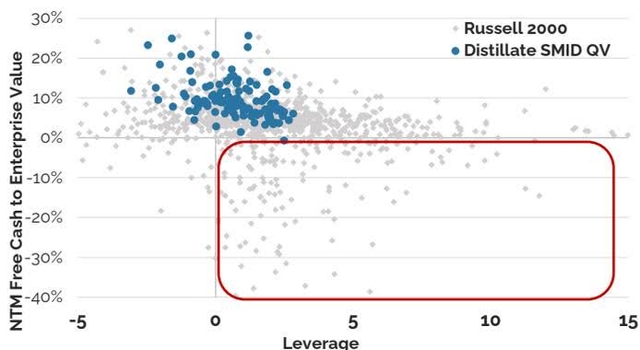
Source: FactSet, data as of 3/31/2026. Stocks without data excluded.
When our holdings are aggregated to the portfolio level, the differentiation on valuation is even more stark with our U.S. Small/Mid strategy offering a valuation that is more attractive than its benchmarks and the S&P 500 while also having considerably less debt. This contrast is evident in Figure 13.
The Distillate U.S. Small/Mid Cap strategy not only has a large valuation advantage versus large and small indices but does so without the high debt levels the broad small cap universe presents.
Figure 13: Small/Mid Strategy Valuation vs. Leverage
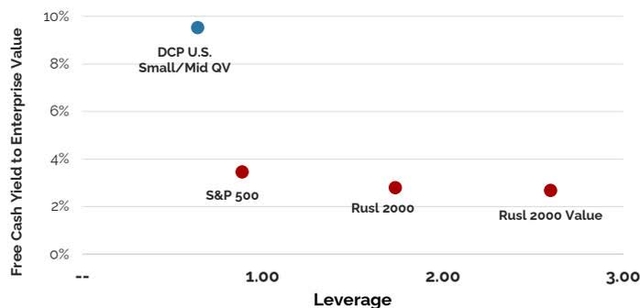
Source: FactSet, See end-notes for methodology. As of 3/31/2026
We appreciate the fatigue many investors feel in small capitalization stocks. Figure 14, however, is entirely consistent with the figures we highlighted earlier examining the large cap space. The figure shows the same stair step results if the small cap universe is broken into valuation quintiles utilizing free cash flow yields.
On a free cash flow basis, the cheapest small-cap stocks have outperformed the most expensive ones significantly.
Figure 14: Indexed Total Return for Russell 2000 and Quintiles of Stocks by Quarterly FCF Yield
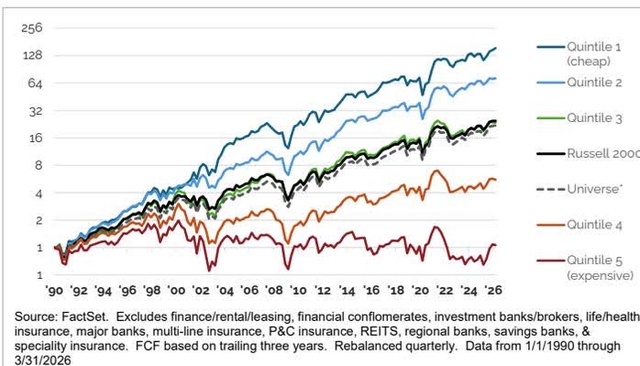
Not only do Quintiles 1 & 2 compound capital at significantly higher rates than the other segments, but the massive dispersion between the quintiles illustrates that the unprofitable and heavily indebted companies that make up a large part of the index can have a meaningful negative impact on returns. This cycles back to the importance of selectivity in the small cap space to generate attractive long-term returns.
International Strategy
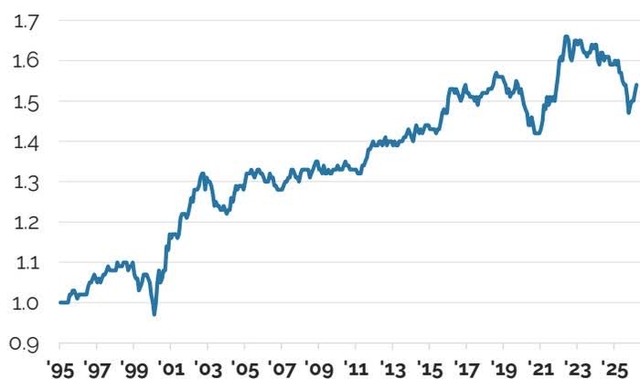
International stocks are likewise an area where we are seeing significant opportunity, but again where we believe selectivity is key. After a long stretch of underperformance that finally led to international stocks becoming less expensive than their U.S. counterparts, they have recently begun to outperform but remain less expensive. This valuation comparison is evident in Figure 15 which also shows the much more attractive valuation offered in our international strategy.
Distillate’s Intl. FSV’s FCF/EV yield is well above that of key benchmarks.
Figure 15: Free Cash to EV for Distillate’s Intl Strategy vs. Various Benchmarks
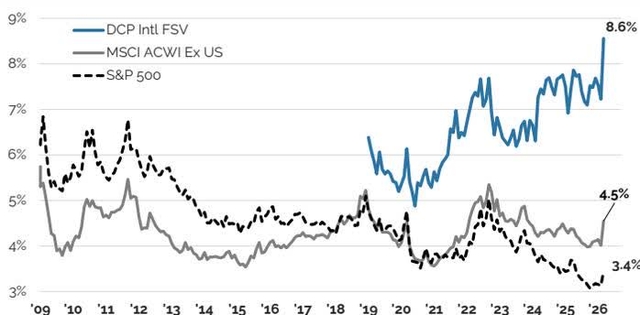
Source: FactSet. See end-notes for methodology.
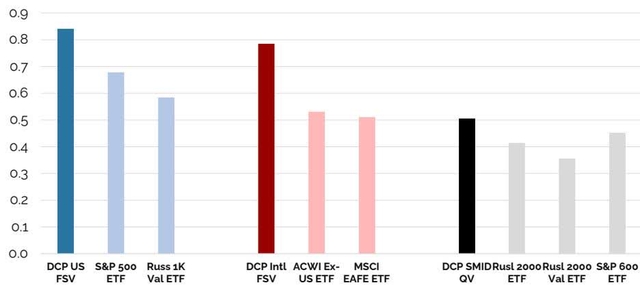
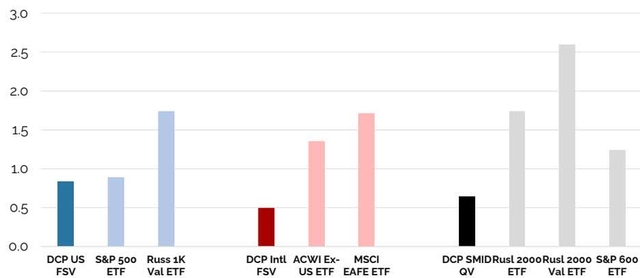
Along with the significantly differentiated valuation, our strategy also stands out on measures of quality. This is critical since there is a significant risk internationally from lower quality stocks that are either unprofitable, have high debt levels, or volatile fundamentals. These differences are evident in Figure 16 which shows cash flow stability on the vertical axis and leverage on the horizontal axis.
By avoiding the lower quality stocks and seeking out the valuation opportunities that are available, we believe a portfolio of selectively chosen international stocks offer an important counterbalance to some of the risks and richness domestically. Last year certainly proved this to be the case and we believe it remains so.
Quality is lower internationally as measured by cash flow stability and leverage, but can be improved upon through stock selectivity.
Figure 16: Quality Measures of International Indexes
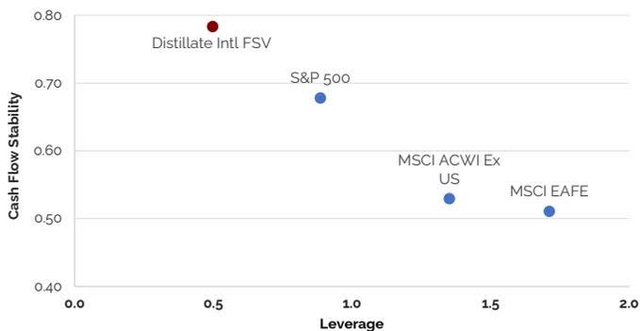
Source: FactSet. See end-notes for methodology. As of 3/31/2026
Final Word
There are a number of current risks facing the U.S. economy and stock market that range from rich valuations, uncertainty around technological innovation, the potential inflationary consequences of large budget deficits, geopolitical turmoil, and high debt levels and richness in the private credit and private equity space, to name a few. We do not pretend to know exactly how these various potential headwinds may play out, nor do we think anyone does.
We do know (referring back to Figure 2 ) that the U.S. economy and equity market have faced enormous challenges over the prior 125 years and proved resilient in the long run as underlying fundamentals grew solidly and drove returns.
The same is true if we look at the more recent stretch of time through a free cash flow lens as was done in Figure 4. Since 1990, the market (this time using the Russell 1000) has likewise performed very well gaining around 40x through a period that also included economic booms and busts as well as political and geopolitical challenges. Again though, the returns were driven almost entirely by fundamentals even though this period included significant swings in valuation multiples. That same figure and related analysis also showed that the least expensive quintile of stocks over that time significantly outperformed all other groups as well as the overall market. Figure 5 showed how much multiples can vary and how much they can diverge between the overall market and the least expensive portion of it, but ultimately the impact of valuation changes was far outweighed by fundamental growth. The cheapest 20% of stocks outperformed significantly even though their multiple went down over this time as the broader market’s went up. Superior fundamental growth and time won out.
So while it is tempting to get swept away by macroeconomic or political risks or exciting new technologies that can cause large swings in valuation multiples, the lesson from history is to instead focus on fundamentals and to use those valuation swings to boost the underlying fundamentals realized, not by sitting passively as so often gets praised, but by systematically rebalancing.
Our strategy is fairly simple and somewhat boring by design. It seeks to outperform by focusing on fundamentals and reinvesting out of expensive names and into cheaper ones at moments like this to improve those fundamentals. It also tries to limit risk both by owning less expensive names, but also by focusing on companies with low debt levels and stable underlying free cash flows. The goal is to consistently improve the underlying free cash flows of the strategy while minimizing downside risk from valuation changes or adverse economic circumstances. Again, we do not know how the various risks facing the market will play out, but we are very happy to own a diversified portfolio of stocks with much less concentration than the market, a valuation multiple that is around half, less debt, greater stability of underlying cash flows, and much better growth in underlying fundamentals at the portfolio level.
Performance & Rebalance Appendix
U.S. Fundamental Stability & Value Composite Performance:
As of March 31, 2026
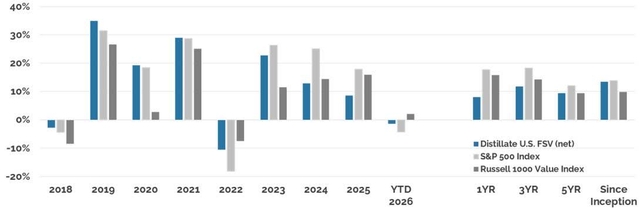
Source: U.S. Bank, Morningstar Data; Inception 5/31/2017; the period “2017” reflects returns from inception through 12/31/2017. One cannot invest directly in an index. See performance disclosures.
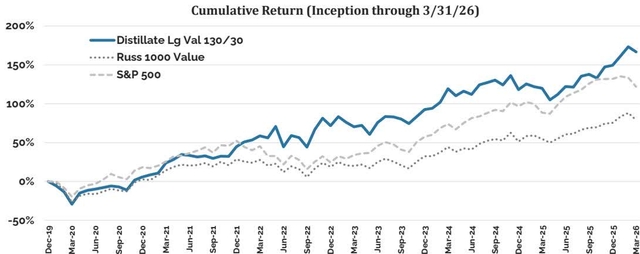
Cumulative Return (Inception through 3/31/26)
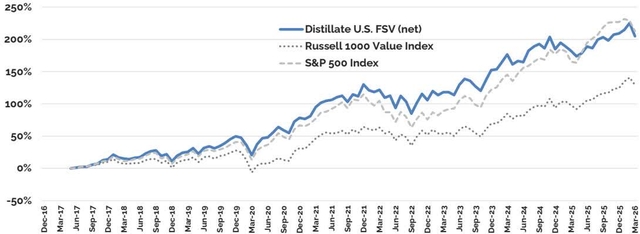
Source: U.S. Bank, Morningstar Data; Inception 5/31/2017. One cannot invest directly in an index. See performance disclosures.
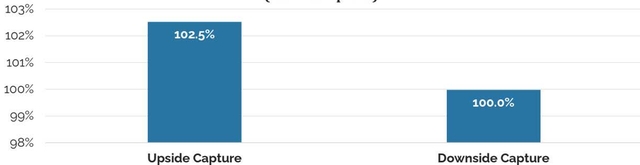
Distillate U.S. FSV Strategy: Upside & Downside Capture vs. Russell 1000 Value Index (since inception)

Source: Zephyr Analytics, see definition
Past performance does not guarantee future results. See disclosures. Upside Capture reflects the relative compounded annualized return of a strategy compared to that of the benchmark in periods (months) when the benchmark rose in value; Downside Capture is the same but for periods when the benchmark fell in value. One cannot invest directly in an index.
Top Contributors and Detractors From Relative Performance:
U.S. FSV Strategy: Owned Stocks 2026 YTD Impact to Relative Returns (vs. S&P 500)
Rebalance Summary:
U.S. FSV Strategy: Portfolio Changes During Recent Quarterly Rebalancing
Rebalance Calculation Date: 3/13/2026
U.S. FSV Portfolio Characteristics*
*as of 3/31/2026, see methodology endnotes.
U.S. FSV Portfolio Sector Weights
*as of 3/31/2026
Past performance does not guarantee future results. Top contributors and detractors are calculated gross of fees and use end of day pricing, which might differ from actual transactions. The top contributors and top detractors represent extracted performance. Strategy level net performance is available on the previous page and upon request. For the Rebalance Summary, position weights and changes are as of the portfolio reconstitution calculation date and data may vary slightly compared to actual implementation based on price fluctuations. Statistical data is sourced from FactSet. Portfolio holdings may change at any time without notice.
U.S. Small/Mid Cap Quality & Value Composite Performance:
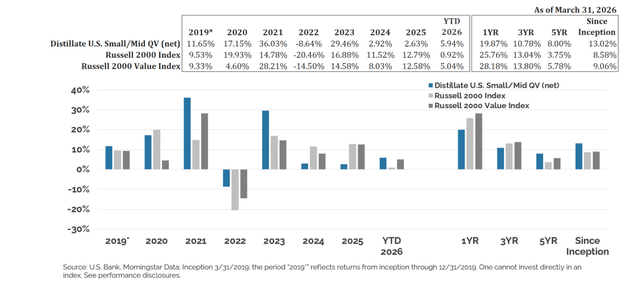
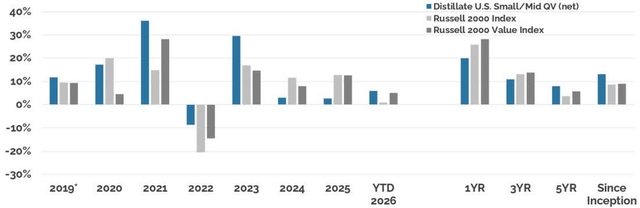
Source: U.S. Bank, Morningstar Data; Inception 3/31/2019; the period “2019*” reflects returns from inception through 12/31/2019. One cannot invest directly in an index. See performance disclosures.
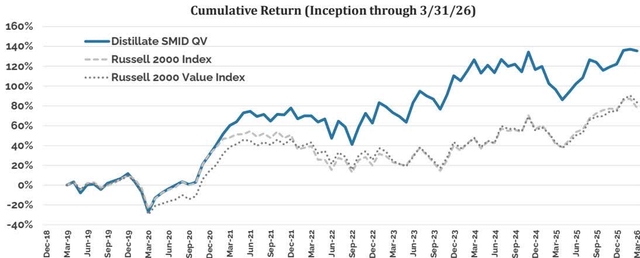
Source: U.S. Bank, Morningstar Data; Inception 3/31/2019. One cannot invest directly in an index. See performance disclosures.
Distillate SMID QV: Upside & Downside Capture vs. Russell 2000 Index (since inception)
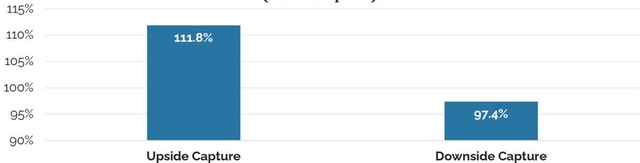
Source: Zephyr Analytics, see definition
Top Contributors and Detractors From Relative Performance:
U.S. SMID QV: Owned Stocks 2026 YTD Impact to Relative Returns (vs. Russell 2000)
Rebalance Summary:
U.S. SMID QV Strategy: Portfolio Changes During Recent Quarterly Rebalancing
Rebalance Calculation Date: 2/24/2026
U.S. SMID QV Portfolio Characteristics*
*as of 3/31/2026, see methodology endnotes.
U.S. SMID QV Portfolio Sector Weights
*as of 3/31/2026
Past performance does not guarantee future results. Top contributors and detractors are calculated gross of fees and use end of day pricing, which might differ from actual transactions. The top contributors and top detractors represent extracted performance. Strategy level net performance is available on the previous page and upon request. For the Rebalance Summary, position weights and changes are as of the portfolio reconstitution calculation date and data may vary slightly compared to actual implementation based on price fluctuations. Statistical data is sourced from FactSet. Portfolio holdings may change at any time without notice.
International Fundamental Stability & Value Composite Performance:
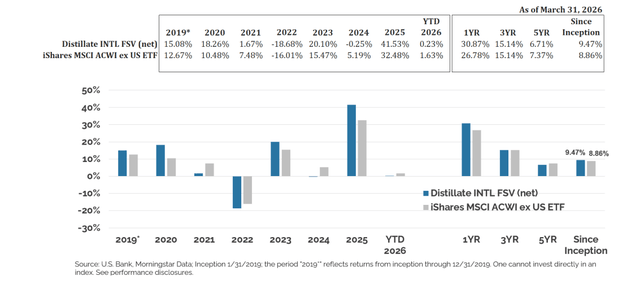
Source: U.S. Bank, Morningstar Data; Inception 1/31/2019; the period “2019” reflects returns from inception through 12/31/2019. One cannot invest directly in an index. See performance disclosures.
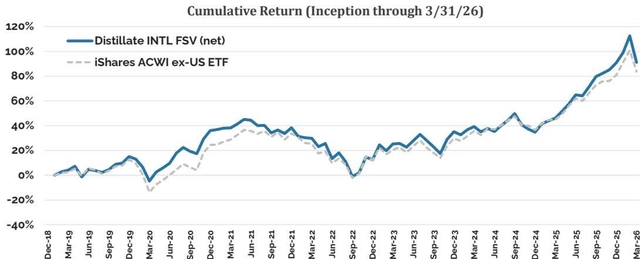
Source: U.S. Bank, Morningstar Data; Inception 1/31/2019. One cannot invest directly in an index. See performance disclosures.
Distillate INTL FSV Strategy: Upside & Downside Capture vs. ACWI ex-U.S. ETF (since inception)
Source: Zephyr Analytics, see definition
Past performance does not guarantee future results. See disclosures. Upside Capture reflects the relative compounded annualized return of a strategy compared to that of the benchmark in periods (months) when the benchmark rose in value; Downside Capture is the same but for periods when the benchmark fell in value. One cannot invest directly in an index.
Top Contributors and Detractors From Relative Performance:
INTL FSV Strategy: Owned Stocks 2026 YTD Impact to Rel Returns (vs. ACWI Ex U.S.)
Rebalance Summary:
INTL FSV Strategy: Portfolio Changes During Recent Quarterly Rebalancing
Rebalance Calculation Date: 3/13/2026
INTL FSV Portfolio Characteristics*
*as of 3/31/2026, see methodology endnotes.
INTL FSV Portfolio Region Weights
*as of 3/31/2026
Past performance does not guarantee future results. Top contributors and detractors are calculated gross of fees and use end of day pricing, which might differ from actual transactions. The top contributors and top detractors represent extracted performance. Strategy level net performance is available on the previous page and upon request. For the Rebalance Summary, position weights and changes are as of the portfolio reconstitution calculation date and data may vary slightly compared to actual implementation based on price fluctuations. Statistical data is sourced from FactSet. Portfolio holdings may change at any time without notice.
U.S. Large Cap Value 130/30 Composite Performance:
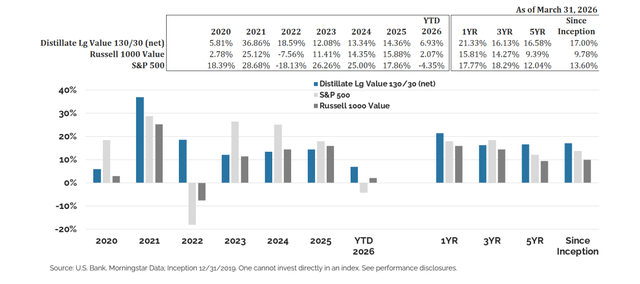
Source: U.S. Bank, Morningstar Data; Inception 12/31/2019. One cannot invest directly in an index. See performance disclosures.
*as of 3/31/26, see methodology endnotes.
Past performance does not guarantee future results. See disclosures. Statistical data is sourced from FactSet.
Valuation: Next 12-Month Free Cash Flow to Enterprise Value
Source: FactSet, See end-notes for methodology. As of 3/31/2026
Quality: Distillate’s Cash Flow Stability Score
Source: FactSet, See end-notes for methodology. As of 3/31/2026
Quality: Net Debt to Adjusted EBITDA
Source: FactSet, See end-notes for methodology. As of 3/31/2026
Original Post
Editor’s Note: The summary bullets for this article were chosen by Seeking Alpha editors.


 (TLTZY) Q2 2026 Earnings Call Transcript")


