


")
Thesis
The iShares Semiconductor ETF (NASDAQ:SOXX) has had a superb run in the past 1~2 years. The chart below shows that over the past year, SOXX has delivered a price return far higher than that of the Nasdaq Index represented by Invesco QQQ Trust ETF (QQQ) and also the S&P 500 index represented by SPDR S&P 500 ETF Trust (SPY), which have enjoyed some of their own best years. More specifically, SOXX went up 59.43% in the past year, compared to QQQ’s 43.89% and SPY’s 32.04%.
Seeking Alpha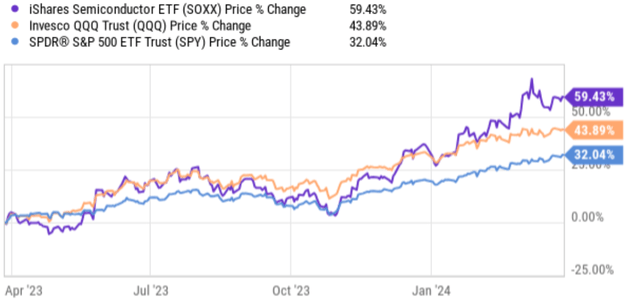
Against this backdrop, I am concerned that the fund now begins to exhibit several of the signs that Ray Dalio developed to identify stock market bubbles. A brief recap of these signs is listed below:
- High Prices Relative to Traditional Measures: This means stock prices are significantly higher than what metrics like the P/E ratio suggest they should be.
- Influx of New and Inexperienced Investors: When a lot of people new to investing jump in due to a hot market, it can be a sign of frothy conditions.
- Widespread Bullish Sentiment: Everyone is overwhelmingly optimistic about the market, with little concern for potential downsides.
- Unsustainable Growth Expectations: The market is anticipating unrealistically high future growth for companies, which can’t be maintained indefinitely.
- Debt-Fueled Buying: Investors are borrowing heavily to buy stocks, which can amplify a bubble and make a crash more severe.
- Speculative Purchases: People are buying stocks not based on company fundamentals but because they expect prices to keep rising regardless.
In the remainder of this article, I will specifically argue that the fund now begins to exhibit the first 2 signs and potentially also the 3rd sign. I am overall bullish about the semiconductor industry in the long run and the goal of this article is NOT to argue SOXX is a bad fund. I do want to caution potential investors of the substantial risks involved at the current price levels.
Fund description
According to the fund description, SOXX provides concentrated “exposure to U.S. companies that design, manufacture, and distribute semiconductors.” And indeed, you can see this very clearly from the chart below showing its largest holdings. To wit, these holdings are the best-established players in the semiconductor industry, encompassing various areas of chip design and manufacturing. Among the top 10 holdings are leaders in graphics processing units (“GPU”) and high-performance chips such as NVIDIA Corporation (NVDA), Advanced Micro Devices, Inc. (AMD), and Intel Corporation (INTC). Connectivity and communications leaders such as Broadcom Inc. (AVGO) and QUALCOMM Incorporated (QCOM). Notably, the funds also included several manufacturers such as Applied Materials, Inc. (AMAT) and Lam Research Corporation (LRCX). These players don’t directly design chips but are critical players in the fabrication process, supplying equipment and materials used by other chipmakers.
SOXX fund description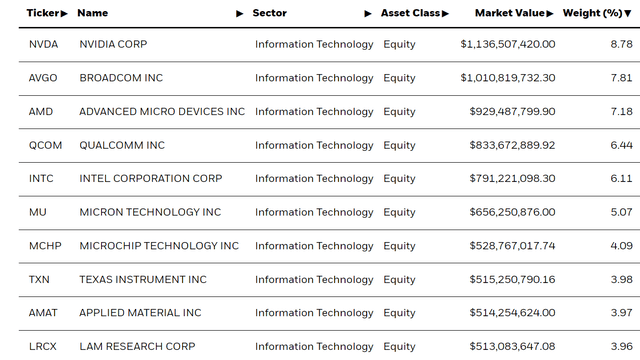
High Prices Relative to Traditional Measures
With the above background, there are good reasons for investors’ enthusiasm for SOXX. Semiconductors are a crucial component in a wide range of technologies, from consumer electronics to electric vehicles. A surge in demand for these products, due to factors like continued growth in tech and the electrification push, could provide secular support for SOXX’s holdings in the long term. Especially, the rapid development of AI could open up another new frontier for these companies to grow. However, I am concerned that the enthusiasm is overdone and has driven up the valuation to a bubble regime. As seen in the chart below, SOXX now trades at a P/BV ratio of 5.49x and a P/E of almost 33x.
SOXX fund description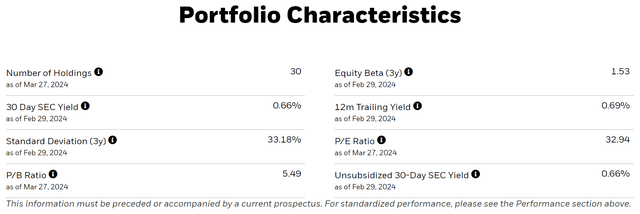
Since Dalio’s method involves high prices RELATIVE to traditional measures, I will need to find a measure to contextualize SOXX’s multiples.
I could not find SOXX’s historical valuation data (please do let me know in the comment section if you know where to find them), so here I will do the next best thing I can think of. I will use the Nasdaq index’s historical P/E as a benchmark. The following data are taken from FullRatio. More specifically,
The PE ratio for Nasdaq stock stands at 30.0x as of Mar 27, 2024. The table below shows the index’s historical P/E over the last ten years. As seen, NDAQ’s P/E ratio peaked in the Dec 2016 quarter at 106.54x, which I think is an outlier and should be excluded from this discussion. Without this outlier, Nasdaq’s current P/E of 30.0x is the highest in the past decade.
And SOXX’s P/E is another 10% above Nasdaq’s current P/E of 30x. With this context, I think it’s reasonable to conclude that SOXX is trading at high prices relative to traditional measures.
Source: FullRatio.com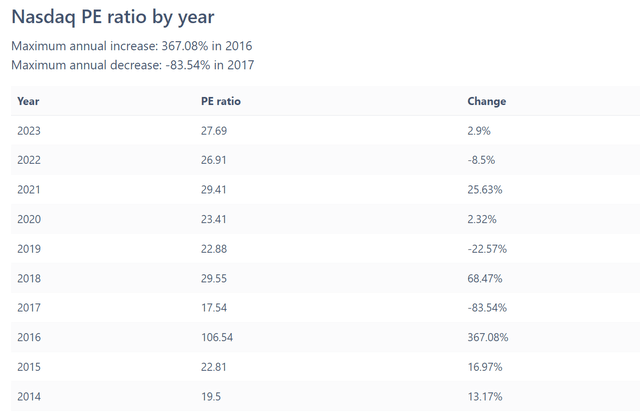
Influx of new funds/investors
The next below shows the top ten creations by net inflows for all ETFs in Jan 2024. The data was taken from Yahoo! Finance. As seen, the fund that has attracted the most inflows early this year is – not surprisingly – a bitcoin fund, Fidelity Wise Origin Bitcoin Fund ETF (FBTC), that provides exposure to Bitcoin through a trust structure. And the second fund is our SOXX. SOXX has enjoyed a 4.3% increase in its AUM, a far cry from FBTC’s 51%+, but many folds above other funds and asset classes such as bonds (represented by the Vanguard Total Bond Market ETF, BND), S&P 500 (represented by the iShares Core S&P 500 ETF, IVV), and also small caps (represented by the iShares Russell 2000 ETF, IWM).
Yahoo!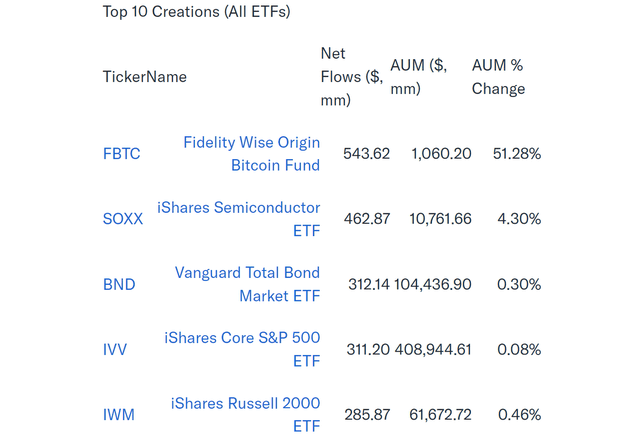
Other signs and final thoughts
Besides the first two signs, the equity market is also dominated by widespread bullish sentiment currently in my view. This overall bullish sentiment of course does not only impact SOXX, but it certainly contributed to the valuation expansion of SOXX. Here I will use the NAAIM Exposure Index shown in the chart below. According to NAAIM’s data:
For the week of March 27, 2024, the index is an average of 103.88 as seen in the chart below. NAAIM member firms’ reported equity exposure, with 0% indication a 100% cash or hedged to market neutral and 100% indicating 100% fully invested in equity.
As such, the current reading of 103.88 is toward the extreme bullish end (the highest level in the past 52 weeks) and also implies some degree of structural use of leverage (which is another one of Dalio’s bubble signs).
To conclude, I want to reiterate that I am bullish on the semiconductor industry overall. The sector presents a compelling growth curve in the long term. However, I think the current conditions call for caution, as the fund begins to exhibit several of the bubble signs. To recap, these signs include a very high P/E ratio, large inflows of new investors and funds, and extremely bullish sentiment in the overall equity market.
NAAIM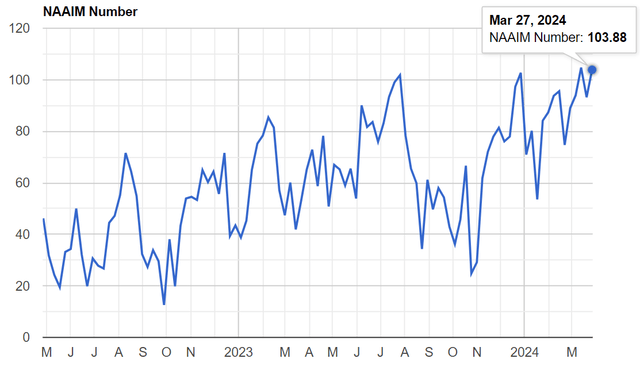
")


")

")