


")
Meta Platforms (NASDAQ:META) is seeing a sharp drop in share prices this week, in moves that might be surprising to some given the positives that were seen in the mega-cap’s most recent earnings report. Even with revenue growth of 27% for the first-quarter period, stock prices have dropped sharply and reached lows below $415 per share before seeing a slight bounce higher.
Most of this disappointment appears to be centered around the fact that second-quarter revenue guidance is indicating additional weakness relative to prior expectations (at $36.5 billion – $39 billion) and the company is now signaling an increase in AI spending, with full-year CAPEX expectations being raised from $30 billion – $37 billion to $35 billion – $40 billion for the period.
META Gaps Lower Post-Earnings (Income Generator via TradingView)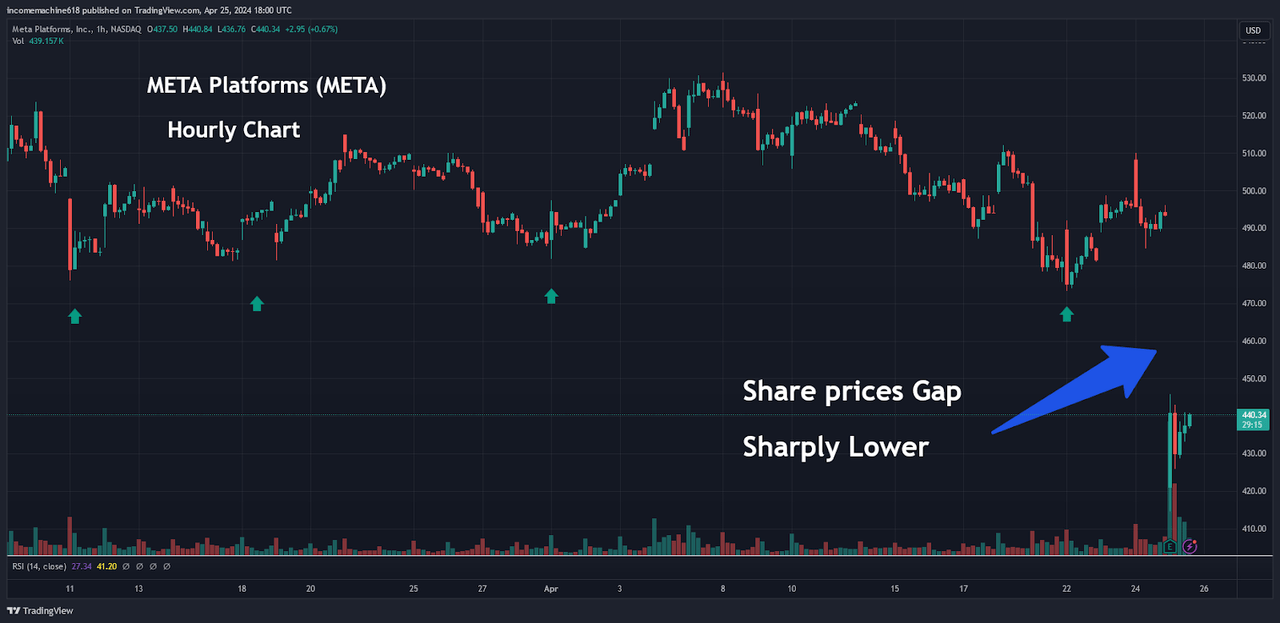
When looking at the shorter-term time frames, we first tend to look at the hourly charts due to the fact that this is one of the most popular time intervals used by technical analysis traders and charting signals on the lower time frames (for example the 5-minute or 15-minute charts) will often send volatile signals that can reverse quite quickly.
However, in this case, the 1-hour charts give us the opportunity to see the strength of the initial market reaction, which we can then compare against our longer-term time frames (daily, weekly, and monthly time intervals) and for a better basis for longer-term trade positioning. In this chart, we can see that the initial impulse lows fell to $414.50 before the initial selling pressure abated.
Unfortunately, this move eroded strong prior support near the $476 level, which essentially marked a quadruple-bottom that might have been expected to contain downside price movements in the event that Meta’s earnings release came as a disappointment to traders.
As we can see, share prices completely fell through this prior support area – and this shifts the focus to the downside with respect to the stock’s near-term outlook. Of course, it will be important to define important downside support levels, so that bullish investors can identify potential buying areas that might provide new opportunities for looking to establish buy-and-hold positions on the broader time frames.
Weekly Chart: Critical Price Levels (Income Generator via TradingView)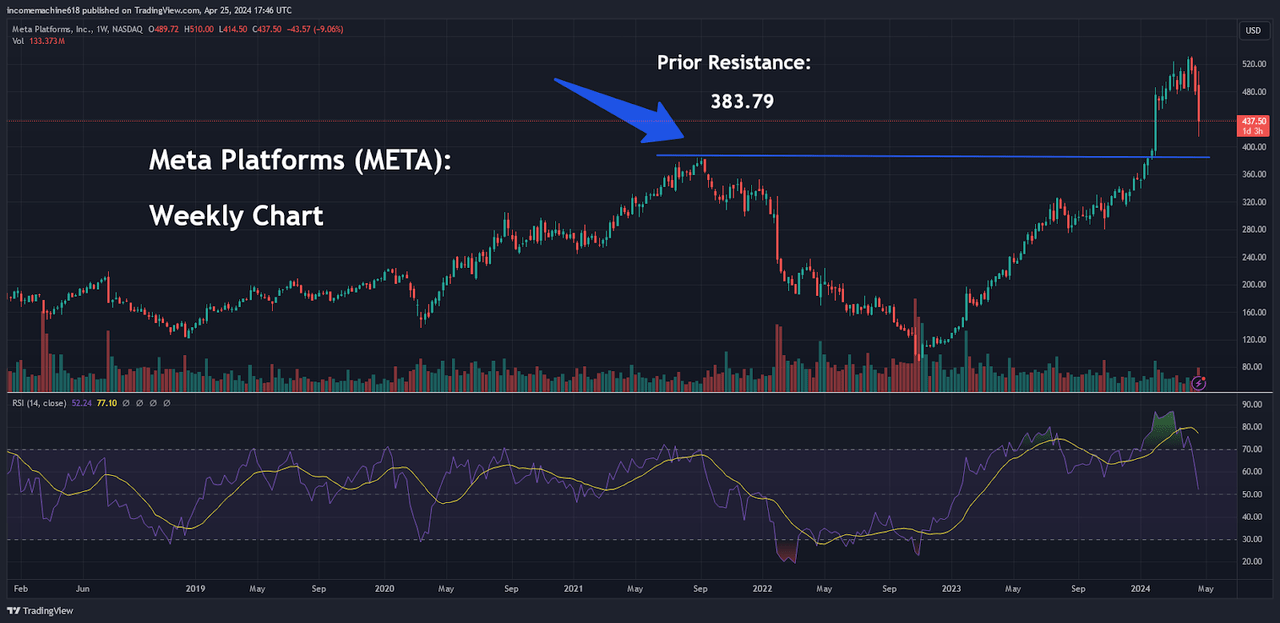
Pulling out to the weekly charts, we can see one price zone which could prove to be critically important in terms of defining the broader trend outlook for META stock prices.
Even with the severe price moves that we have seen after the market’s initial negative reaction to first-quarter earnings, the Relative Strength Index (RSI) remains in its upper regions and is nowhere near approaching oversold territory. Essentially, this suggests that share prices still have plenty of room to extend to the downside before reaching price levels that might be considered excessive.
Lending further credence to this possibility that META prices could fall further is the fact that all near-term support zones have been invalidated and the next important price level is not found until $383.79 (which marks the price high from September 2021).
We are referring to this price zone as significant because it essentially worked as a precursor to the eventual declines in META shares that continued until October 2022 (resulting in the bottoming long-term price low of $88.09). Additionally, this prior resistance zone ($383.79) marked the upside breakout point in January 2024 (which ultimately resulted in further gains of 38.48% with April 2024 highs of $531.49).
Weekly Chart: Fibonacci Retracement Levels (Income Generator via TradingView)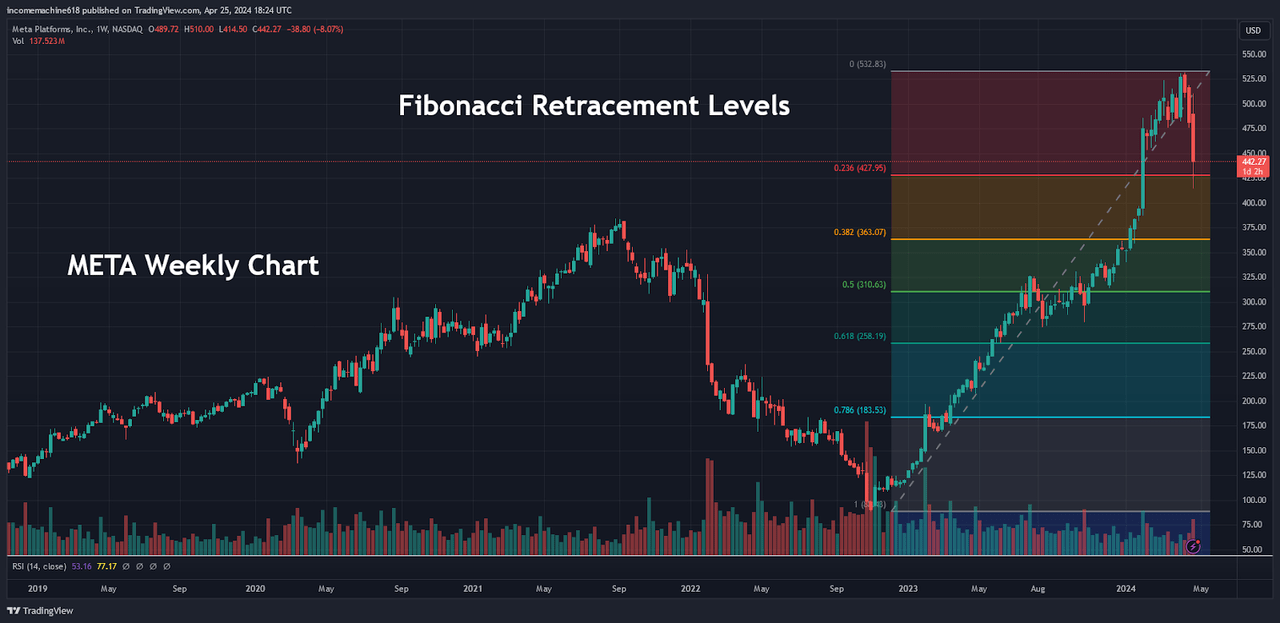
Further evidence of potentially bearish price trends can be found in the long-term Fibonacci Retracement levels that can be found on the weekly charts. Specifically, the post-earnings sell-off eroded the support zone found at the 23.6% retracement of the dominantly bullish move that occurred from October 2022 to April 2024.
Interestingly, the next important Fibonacci level (38.2% retracement) is placed relatively close to the aforementioned resistance zone near $380, so there are several technical arguments which suggest that this price zone should operate as strong support for the stock going forward.
Monthly Chart: Long-Term Momentum Readings (Income Generator via TradingView)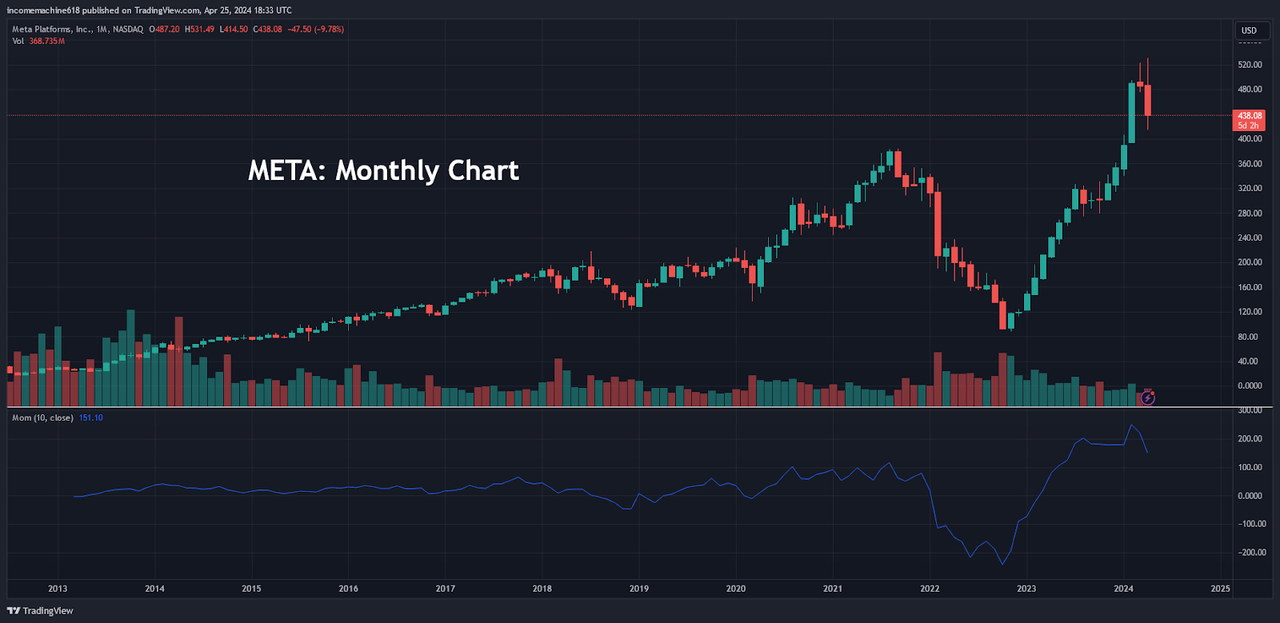
However, it is also important to note that all hope is not lost for bullish investors that are holding long-term positions in META stock. Pulling out to the monthly chart (which is the broadest charting time frame that we watch), we can see that long-term momentous levels are still firmly entrenched in bullish territory.
We can see that the recent impulse move has put a bit of a dent in the prior upside momentum that bullish META investors have enjoyed since October 2022, but the broader outlook remains positive. Essentially, this suggests that META stock should be viewed as a buy on dips and the recent declines appear to be setting up a nicely positioned buying opportunity for anyone looking to establish new long positions (or to build on prior bullish positions).
Overall, the long-term outlook remains bullish, but we believe that it will be critically important for investors to watch price action very closely if we begin to see moves below the $400 level. As we all know, the market can easily become quite fixated on psychological figures. Therefore, if we do see stock prices move below the $400, we could see the critical $380 price zone come under pressure quite quickly – and, if this area fails to hold, losses could begin to accelerate.
Below $380, the next level of significant price support is not found on the monthly charts until we reach the October 2023 price lows (at $279.40). As a result, the market volatility that has been created by the Meta Platforms first-quarter earnings release has certainly created several interesting price zones that have the potential to determine the most likely trend direction that META traders are likely to experience into the second half of this year. We do see the potential for strong value buying opportunities if this reversal in short-term momentum continues. Warning signs, however, should begin to start flashing if the stock is not able to maintain a foothold above the $400 level, as the next long-term support zones are currently found at much lower levels.

")


")