


")
Introduction
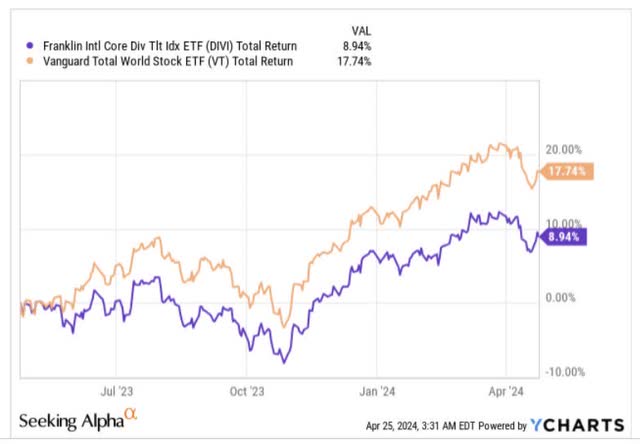
The Franklin International Core Dividend Tilt Index ETF (NYSEARCA:DIVI) is a 7-year-old ETF, with $765m in AUM that offers efficient access (an expense ratio of just 0.09%) to around 25 developed market equities sourced from markets beyond North America.
Over the past year, DIVI has provided steady returns of 9%, but that hasn’t been good enough to trump global stocks, with the Vanguard Total World Stock ETF (VT) generating returns of close to 2x more.
YCharts
If you’re still interested in exploring this product, here are some important things to note.
A Dividend-Oriented Remix
What’s key to note is that DIVI’s tracking index- The Morningstar Developed Markets ex-North America Dividend Enhanced Select Index is a play on the Morningstar Developed Markets ex-North America Target Market Exposure Index. The latter is massive in scope, covering 85% of the float-adjusted developed stocks outside North America. In fact, there’s another ETF- the JPMorgan BetaBuilders International Equity ETF (BBIN) which actually tracks the latter index. Note that BBIN covers around 830 stocks, whereas DIVI only covers around 480 stocks. DIVI’s goal is to optimize the selection and weighting of BBIN’s tracking index to such an extent that it is able to deliver a relatively higher trailing dividend yield. However, to get there, do consider that DIVI engages in a lot of churn (roughly 1 in 2 stocks get churned every year). In contrast, BBIN’s portfolio is very stable, as exemplified by a minuscule annual turnover ratio of just 5%.
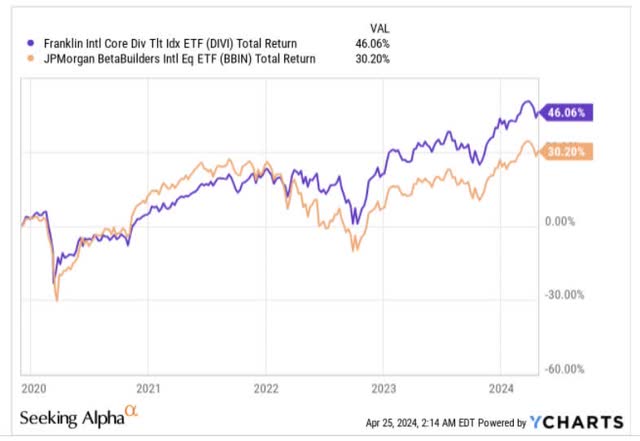
Investors may also appreciate DIVI’s superior risk-adjusted return profile. Since BBIN’s inception, our focus ETF has outperformed it by 1.53x.
YCharts
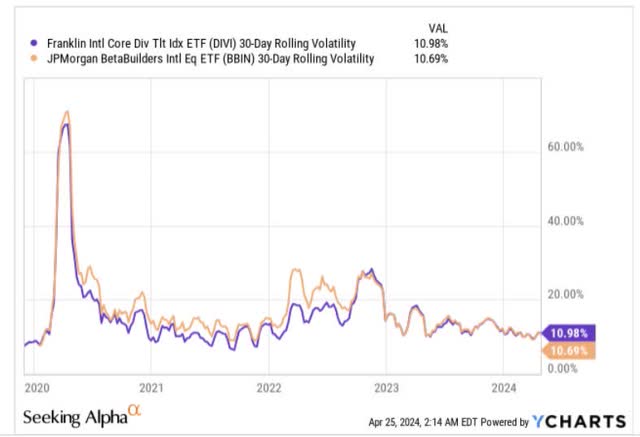
Crucially, the outperformance has also come despite both these products maintaining a similar rolling volatility profile.
YCharts
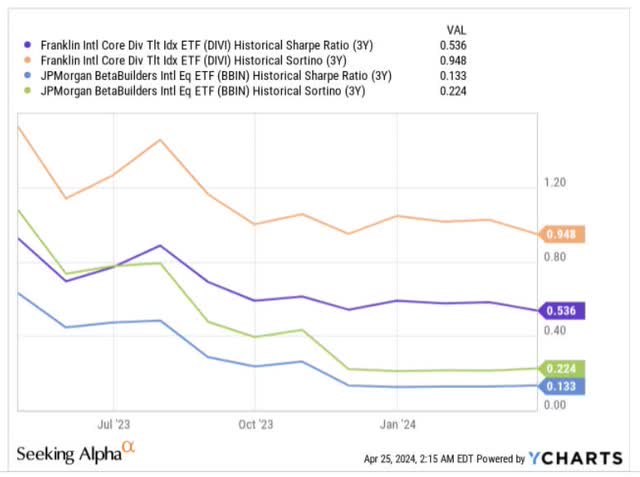
To better understand DIVI’s competence on this front, we can also consider the respective Sharpe ratios and the Sortino ratios which measure how well these products have done (in generating excess returns over the risk-free rate), relative to the total risk taken or just downside risk (in the case of the Sortino ratio). Note that DIVI comes out on top on both fronts.
YCharts
European Tilt Is Favorable
Even though DIVI spreads its tentacles across 25 developed markets in the world, it’s fair to say that a lot will depend on how the European side of the portfolio fares, as stocks from this region alone account for close to 60% of the total portfolio.
The prospects for a pickup in consumer spending in Europe looks bright, as it looks all but certain that the ECB will cut rates next month as recent inflation readings have been very encouraging, coming in well below expectations.
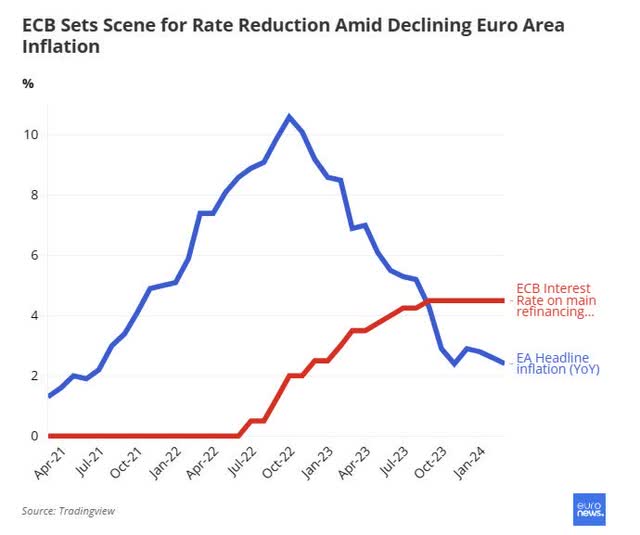
Euro News
With a more salutary rate regime, one could argue that we have quite a bit of pent-up savings ammunition that could be deployed in the periods ahead. Unlike American households where the savings rate is at a miserly figure of 3.4%, in Europe it is a lot higher at 10-15%
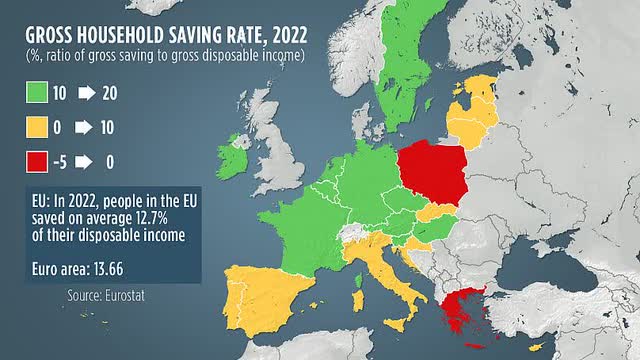
Eurostat
Another important fillip could also come from a pickup in grants from the €750bn recovery fund. As things stand, only one-third of the grants here have been spent.
Also consider that a lot of the stocks here consist of financial stocks, and this is a sector that has traditionally been very generous with its distributions. As things stand, on a shareholder yield basis, which includes both dividends and buybacks, European financials are yielding double-digit figures. Crucially valuations too remain quite depressed with this sector trading at a P/E of just 6x, as opposed to a long-term average of double-digit. A lot of these European financials are also not overly exposed to the deterioration of commercial real estate in the US, as it is less than 5% of their total loan book.
Closing Thoughts- Should You Buy DIVI Now?
Up to now we’ve painted a rather encouraging picture on DIVI, but that doesn’t mean that one should jump in right away. Rather, if one pays attention to the charts, we don’t think it would be too rewarding to open a fresh long position here.
Our first concern is that relative to emerging markets, developed market equities actually look quite overbought, with the relative strength ratio (RS) of these two products currently perched at a 21% premium over its long-term average. Crucially, the RS ratio is now at the GFC highs from where we had seen a reversal.
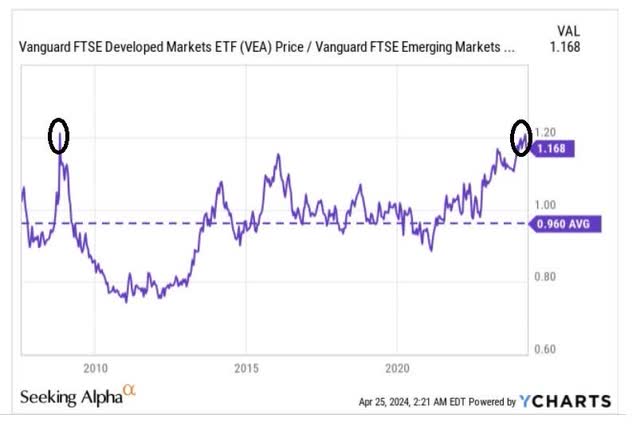
YCharts
Then, within the broad developed market universe, note that DIVI’s portfolio of stocks too are unlikely to benefit from too much of rotational interest given that their relative strength ratio is around 6% higher than its long-term average.
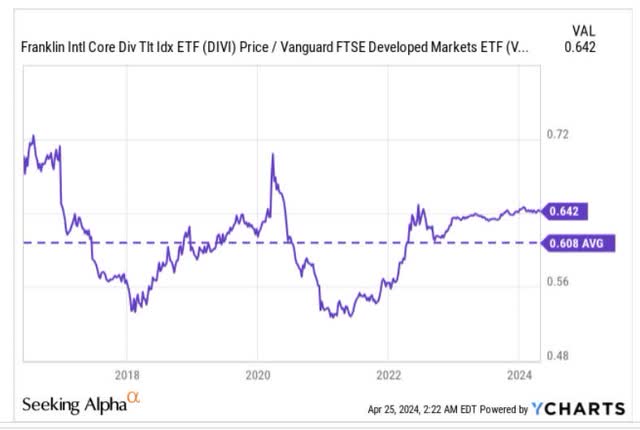
YCharts
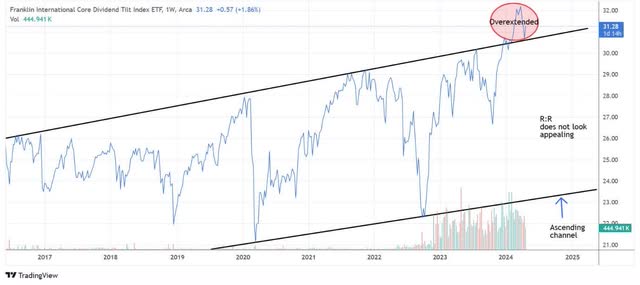
Finally, we’ll point you to DIVI’s weekly chart, which also reiterates how relatively overextended this product currently looks. For around eight years we can see that DIVI has trended up in the shape of an ascending channel. In February, we saw the price surge past its multi-year boundary, but in recent weeks, we’ve also seen some ferocious selling pressure, which threatens to make this a false breakout. Either way, when you consider how far away the price is from the lower boundary of the channel, we don’t feel overly enthused to deploy a lot of capital here. DIVI is a HOLD.
Investing

 (NASDAQ:SPT)")

 Q1 2024 Earnings Call Transcript")

")
