


 (SP500)")

Investment Thesis
The purpose of today’s article is to introduce the Invesco S&P 500 High Dividend Growers ETF (NYSEARCA:DIVG). DIVG launched on December 6, 2023, and although it only has $2.8 million in assets under management, it also has some nice features, like a 3.44% expected dividend yield and a monthly-paying dividend policy. This article highlights these positives but also notes some flaws that are significant enough to avoid buying.
DIVG Overview
DIVG tracks the S&P 500 High Dividend Growth Index, selecting 100 stocks with the highest forecasted dividend yield growth in the S&P 500 Index. According to S&P Dow Jones Indices, companies “must have followed a managed-dividends policy of consistently increasing or maintaining dividends for at least five years.” DIVG’s expense ratio is 0.39%, it pays dividends monthly and has $2.8 million in assets under management with 100,000 shares outstanding. The selection universe is the S&P 500 Index, and qualifying stocks must satisfy the following rules:
- Forecasted dividend yield greater than zero, as sourced from S&P Global Market Intelligence
- Increased or maintained a total dividend per share amount every year for at least five consecutive years
- Forecasted dividend per share must be greater than or equal to its most recent trailing calendar year dividend per share
The Index selects the 100 stocks with the highest forecasted dividend yield growth, subject to a 20% buffer at each semi-annual reconstitution in April and October. The forecasted dividend yield is calculated by subtracting the difference between the forecasted and trailing dividend per share figures and dividing by price. For example, if a company increases dividends from $1.00 per share to $1.10 per share and has a stock price of $30, the forecasted dividend growth is 0.33%. This calculation method is different from what’s used for other ETFs and serves a specific purpose. To illustrate, consider the example below.
The Sunday Investor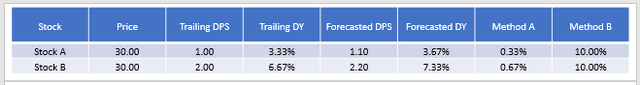
In this example, both stocks have the same 10% dividend growth rate under Method B. However, Method A, the method used for DIVG, assigned twice the forecasted dividend growth to Stock B because its dividend yield was twice as much. By incorporating price into the equation, DIVG aims to reward high-yielding stocks with high dividend growth the most.
The approach seems logical, but it doesn’t result in strong dividend growth. Consider how Altria Group (MO) is DIVG’s top holding, but its one-year dividend growth rate is only 4.25%, with the reason linked to its 9.21% dividend yield. The same applies to Pfizer (PFE), DIVG’s second-largest holding. PFE has a dividend growth rate of just 2.44%, but that’s upward-adjusted to reflect the stock’s 6.40% dividend yield. The Index also weights constituents by forecasted dividend yield, so this all adds up to an Index that prioritizes dividend yield over dividend growth, and that’s not what the ETF’s name suggests.
Other features are that the Index caps individual securities weights at 4% and applies a 30% cap to each sector. These caps should improve diversification but likely only apply to the Financials and Utilities sectors. On that note, let’s discuss DIVG’s composition next.
DIVG Analysis
Sector Exposures and Top Ten Holdings
The following table highlights DIVG’s sector exposures and the top three holdings in each, where applicable. In this analysis, I will compare DIVG with the SPDR S&P 500 High Dividend ETF (SPYD) and the iShares Select Dividend ETF (DVY), as these ETFs also overweight the Financials and Utilities sectors.
The Sunday Investor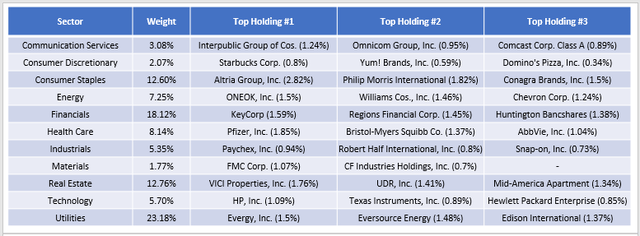
While Utilities are generally less volatile than the market, that’s not always the case with Financials. DIVG’s Financials sector selections have a 1.24 five-year beta, with the breakdown by sub-industry as follows:
- Regional Banks (6.86%): 1.21
- Asset Management & Custody Banks (3.80%): 1.29
- Life & Health Insurance (2.05%): 1.19
- Investment Banking & Brokerage (1.96%): 1.41
- Diversified Banks (1.50%): 1.27
- Consumer Finance (1.16%): 1.47
- Property & Casualty Insurance (0.78%): 0.62
These selections increase risk, but let’s evaluate the entire portfolio on a variety of fundamental metrics to see how it shakes out.
DIVG Fundamentals By Sub-Industry
Since DIVG’s top 25 holdings comprise only 37.15% of the portfolio, evaluating its top 25 sub-industries, which total 82.58%, is more valuable. For comparison purposes, I’ve included summary metrics for DIVG, SPYD, and DVY in the bottom rows.
The Sunday Investor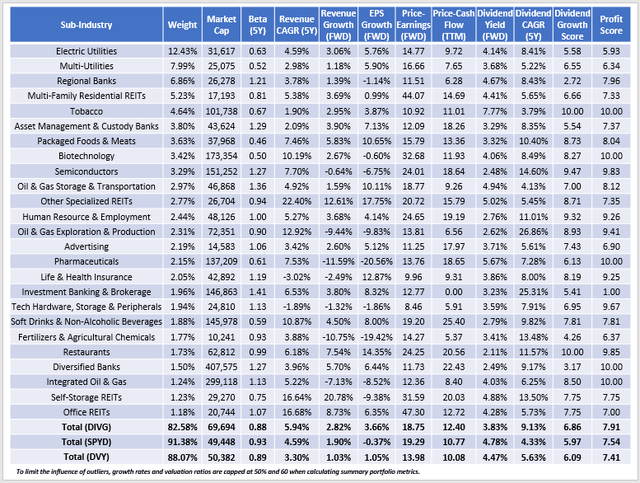
Here are two initial high-level observations:
1. DIVG is a noticeable improvement over SPYD, as its fundamentals are better nearly across the board. For example, its 0.88 five-year beta figure indicates it’s a less volatile portfolio, a feature usually appreciated by conservative income investors. DIVG also has better estimated sales and earnings growth rates, trades at a cheaper forward earnings valuation (18.75x, simple weighted average method), its constituents’ five-year dividend growth rate is solid at 9.13%, and the 7.91/10 profit score reflects a higher-quality portfolio. The primary drawback is a lower Index yield (3.83% vs. 4.78%). After deducting DIVG’s 0.39% expense ratio, shareholders net 3.44%, while SPYD’s 0.07% fee results in a 4.71% net yield. The difference of 1.27% is significant, but I’d still be much more comfortable holding DIVG over SPYD.
2. DIVG also has many advantages over DVY, particularly in diversification (concentration in the top 25 sub-industries), estimated earnings per share growth (3.66% vs. 1.05%), and profitability (7.91/10 vs. 7.41/10 profit score). However, its 18.75x forward earnings valuation is almost five points more than DVY, so it’s not nearly as good of a value play.
I don’t recommend either SPYD or DVY, but they’re most similar in sector composition. Instead, I want to highlight where DIVG ranks among large-cap value ETFs on the Dividend Growth Score metric, which I calculated using Seeking Alpha Factor Grades. Overall, DIVG’s 6.86/10 score ranks #67/98, which is quite disappointing. I explained the reason earlier, but I think this relative ranking is essential evidence indicating that DIVG is not a very good “dividend growers” fund. Alternative high-yield funds with better Dividend Growth Scores include:
- VanEck Durable High Dividend ETF (DURA)
- iShares Core High Dividend ETF (HDV)
- Schwab U.S. Dividend Equity ETF (SCHD)
- Invesco Dow Jones Industrial Average Dividend ETF (DJD)
- iShares Core Dividend ETF (DIVB)
Quality, as measured by profitability, also disappoints. DIVG’s 7.91/10 profit score ranks #22/25 among large-cap value ETFs with Index yields above 3% and #92/98 overall. In short, DIVG is not balanced and sacrifices much dividend growth and quality to deliver a high dividend yield.
Dividend Yield: Expect The Unexpected
Invesco lists DIVG’s trailing dividend yield as 4.83%. However, this yield is calculated by annualizing the most recent monthly payment of $0.11088 ($0.11088 x 12 months / $27.55 = 4.83%). Since most companies pay dividends at the end of each quarter, which the ETF subsequently distributes the following month, this calculation does not represent what shareholders will actually receive for the year.
Invesco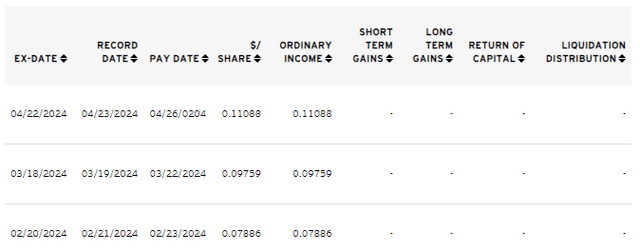
A different calculation is to annualize the dividend payment using all three quarterly payments, which results in a 4.17% dividend yield. My 3.44% expected yield is done using a third method, which considers reconstitutions and adjusts the Index yield by the fund expenses. For well-established funds, this method is reliable.
However, all methods may be inaccurate because DIVG is new. Consider the possibility that if many investors decide to buy just a few days before the fund’s ex-dividend date, the percentage increase in outstanding shares would be significant. However, the dividend dollars DIVG will distribute for that month are fixed at that point, so more shares outstanding means a smaller per-share payment. In short, existing shareholders’ dividend payments become diluted, which is a challenge for DIVG and any income-focused fund that is getting started. Even if the strategy is sound, it’s confusing when a “dividend growers” fund decreases payments, and investors might give up before giving it a fair chance.
Investment Recommendation
I don’t recommend buying DIVG. Its selection and weighting process places more emphasis on dividend yield than dividend growth, and there are no quality screens beyond those required to enter the S&P 500 Index. Relative dividend growth and profit scores confirm these flaws, and although it’s an improvement over high-yielding alternatives like SPYD, it’s far from optimal. Thank you for reading, and I look forward to your comments below.

 Q1 2024 Earnings Call Transcript")


")
