


")
Over the past year, I’ve written two articles regarding natural gas exploration and production (E&P) company Comstock Resources, Inc. (NYSE:CRK).
In the first, published in late April last year “Comstock Resources: 2023 Will Be Messy,” I rated the stock a sell and that call proved correct with the stock falling as much as 30% to its lows in February 2024.
Further, since publication, CRK has dramatically underperformed the widely followed SPDR S&P Oil & Gas Exploration & Production ETF (XOP) by a more than 30 percentage point margin. According to Bloomberg, XOP is up 31.8% since the close on April 26, 2023, while CRK is up just 1.1%, both on a dividends-reinvested basis.
In my second piece on CRK in late January of this year, “Comstock Resources: Serious Cash Flow, Debt and Dividend Headwinds Loom,” I reiterated my sell call on the stock and indicated the company would need to eliminate its dividend and dramatically cut capital spending (CAPEX) to reduce cash burn.
I was correct about the dividend and CAPEX, but wrong about the stock, at least in the short run. CRK has rallied in absolute terms and outperformed XOP to the tune of about 6.4% per Bloomberg.
As I’ll explain in this article, CRK has taken some encouraging steps to reduce cash burn this year. Even more important, CRK has improved its liquidity by selling 12.5 million shares to majority shareholder Jerry Jones and issuing $400 million worth of bonds to pay down its credit line.
However, while CRK’s liquidity position has improved, the company still faces a profitability and cash flow squeeze due to its elevated cost structure, light commodity hedge coverage, and the production impact of its decision to dramatically reduce capital spending.
Based on my estimates, CRK is likely to bleed cash this year and could struggle to benefit from an expected turn in natural gas prices into 2025 relative to its peers. I’m reiterating my sell call on CRK and expect the stock to underperform the group over the next 6-12 months.
Let’s start with this:
CRK’s Cost Structure
In its investor presentations, CRK includes a slide comparing the company’s production costs to nine of its gas-producing peers.
Here’s the slide from their April investor presentation:
CRK Production Costs Relative to Peers (April Investor Presentation)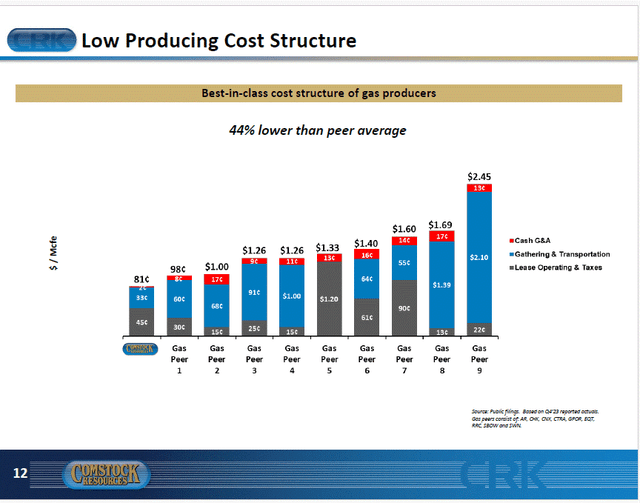
As you can see, CRK’s production costs are $0.81 per thousand cubic feet equivalent (Mcfe), which is 44% lower than the average of the 9 peers listed here.
However, before you conclude CRK is the low-cost producer in Haynesville, look at the footnote at the lower right-hand side of the slide. While CRK doesn’t label peers on the chart itself – the company labels individual columns Gas Peer #1, Gas Peer #2, and so on – that note tells us the ticker symbols for the nine companies CRK considers peers.
Here’s the list:
CRK’s US Gas-Producing Peers (Bloomberg, CRK Investor Presentation)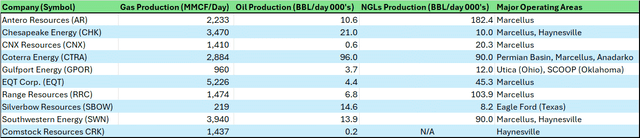
This table contains the nine stocks listed in that slide, and CRK itself, along with some basic production data for natural gas, crude oil, and natural gas liquids (NGLs) from the most recent financial statement sourced from Bloomberg. I’ve also included a list of the major operating regions for each producer.
This is a logical peer group for CRK, and it includes producers of all sizes and commodity mixes. However, there are some major and important distinctions to draw.
First up, CRK is the ONLY pure-play Haynesville producer on the list.
There are two other major Haynesville producers in the table – Chesapeake Energy Corporation (CHK) and Southwestern Energy Company (SWN) – however both are dual basin companies with operations in the Marcellus Shale of Appalachia and the Haynesville.
Further, out of the nine peers in this table, seven have significant operations in Appalachia – the Marcellus and Utica Shale fields. This is the key to understanding CRK’s low production costs listed in its investor presentation slide decks.
Here’s a map from the Energy Information Administration (EIA) showing the location of major shale fields around the US:
Map of Major US Shale Fields (Energy Information Administration)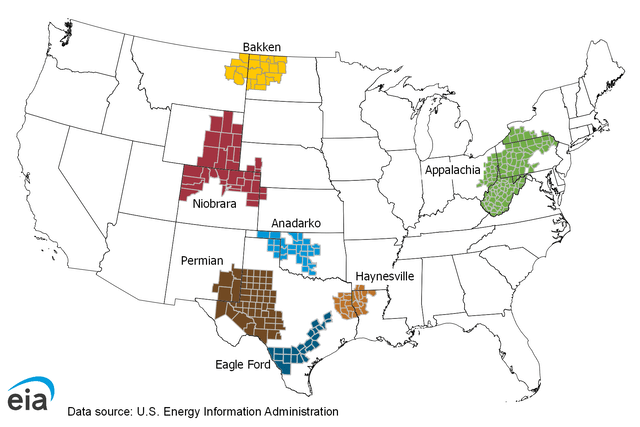
According to the EIA’s latest Drilling Productivity Report, the Appalachian region labeled in green above will produce just under 36.2 bcf/day of natural gas in April 2024 out of total production from all US shale fields of 100.2 bcf/day.
That makes the Marcellus by far the largest gas-producing play in the US.
The Permian Shale of Texas and New Mexico, while primarily considered an oil field, also produces significant volumes of associated natural gas – that’s gas found and produced with oil. The Permian is expected to produce 25.1 bcf/day of natural gas in April making it the second-largest gas-producing shale field in the US.
Third is the Haynesville shale – the orange region straddling the state line between east Texas and Louisiana in the map above – which is expected to produce some 16.2 bcf/day in April 2024.
Let’s deal with the two gas-focused plays.
The Marcellus is widely considered the cheapest-to-produce major gas shale field in the US. However, the issue with the Marcellus is its location – there’s little natural gas demand in Appalachia and, due to the fact regional gas production is so prolific, there’s way too much supply relative to local demand. Prices are generally depressed for gas sold locally.
As of the close last week, for example, natural gas delivered to the Leidy Hub in Pennsylvania traded at $1.01/MMBtu according to Bloomberg. At the same time, the June 2024 NYMEX natural gas futures contract, priced for delivery to Henry Hub on the Louisiana Gulf Coast, sold for about $1.923/MMBtu.
So, the key to making money with Marcellus gas production is to have access to pipelines that can transport the natural gas to regions where it’s in higher demand. That would include states like Florida where it’s used to generate electricity or the Gulf Coast where it’s used in industrial applications like refining and chemical production, or exported in the form of liquefied natural gas (LNG). By moving gas from Appalachia to these more distant demand centers, producers can realize a much higher value for their output.
In contrast, the Haynesville Shale is located close to the US Gulf Coast, home to the nation’s LNG export terminals and a vast demand center of industrial gas consumers. Look at the map again – clearly, the cost of transporting gas from Appalachia to the Gulf Coast by interstate pipeline is higher than the cost of transporting gas intrastate in Louisiana from Haynesville, or to neighboring Texas.
If you look at the production cost table I posted above, you’ll see CRK is comparing production costs with its nine peers and CRK’s definition of production costs includes just three simple line items: Lease Operating Expenses (LOE), Cash General & Administrative (G&A) expenses and Gathering and Transportation costs.
G&A expenses are common across most industry groups and familiar to many investors – it’s by far the smallest production cost listed on that chart.
LOE is an energy industry term that refers primarily to the costs associated with maintaining and continuing to produce natural gas from existing wells – these are wells drilled and put into production in prior quarters.
Finally, Gathering & Transportation costs refer to the costs of transporting gas from individual wells via small-diameter gathering lines and paying pipeline tariffs to use longer-haul interstate lines.
It’s that last line item that accounts for almost all of CRK’s production cost advantage in the slide. Indeed, CRK’s LOE expenses, at around $0.45/Mcfe are higher than six of the nine peers listed in that slide.
In short, the slide comparing CRK’s production costs to its peers represents a case of comparing apples to oranges – pure-play Haynesville producers are always likely to have lower transportation costs than producers with significant output from a region like Marcellus. Proximity to Gulf Coast demand centers and LNG export terminals is a major advantage for all Haynesville production, not something specific to CRK.
And that brings me to a major cost line item that’s not included in CRK’s cost comparison slide:
Shale is a Manufacturing Business
The shale business is more like a manufacturing business than the production of oil and gas from conventional fields.
Hydrocarbons are generally widely distributed under shale acreage in the core of a particular basin, so production is a function of drilling and completion activity and working through an inventory of prime drilling locations.
While the exact decline rate differs between regions and targeted commodities, one of the defining features of shale wells is that they have a high decline rate. The traditional production profile is a quick “rush” of production followed by a sharp decline in the rate of production (Mcf/day) through the first 12 to 18 months after a well is drilled and put into production.
So, producers need to spend some money every quarter to drill and complete (fracture and put into production) new wells just to maintain their current output. That’s because new wells are necessary to offset the high decline rates from wells drilled in prior quarters, the base decline rate of the company’s existing operations.
As I noted earlier, lease operating expenses (LOE) represent the cost of operating existing wells such as maintenance of well-related infrastructure. That’s considered a production cost.
However, the cost of drilling and completing new wells isn’t a production cost – it’s part of a company’s CAPEX and, more specifically, most producers like CRK break out the costs of drilling and completing new wells as D&C CAPEX.
So, while this is technically not considered a production cost, a sizable share of a company’s quarterly CAPEX is not about growth- it’s about just drilling enough new wells to maintain production.
In effect, shale producers are running on a long, moving treadmill. They must hold their CAPEX at some maintenance level just to hold their current level of production. Alternatively, they can run faster, increasing their D&C CAPEX, to make some forward progress, overcoming that base decline rate.
However, if a producer slows down too much – cuts CAPEX too deeply – production will quickly start to slide as decline rates overwhelm output from a dwindling number of new wells. The problem is the farther the producer falls back below the maintenance pace, the harder it is, and the longer it takes, for the company to regain prior peak production levels.
My point is that just because D&C CAPEX is technically not a “production cost” doesn’t mean we can ignore it in assessing CRK’s cost structure – a sizable chunk of their CAPEX is mission-critical to the sustainability of their production and business. While CRK certainly reports CAPEX and offers guidance for CAPEX in future quarters, there is no CAPEX included on a $/mcf basis in that slide I posted at the beginning of this article.
However, we can compare CRK’s cost structure to its peers on a more meaningful basis.
That’s because both Chesapeake and Southwestern – the two other producers with operations in the Haynesville – break out CAPEX by region, telling us how much they spent in the Marcellus compared to the Haynesville region. Both companies also break out production by operating region, so we can calculate CAPEX on a $/mcfe basis in a way that’s more directly comparable to CRK.
Take a look:
CAPEX Costs for CHK, SWN and CRK (Q4 Quarterly Results for CHK, SWN and CRK)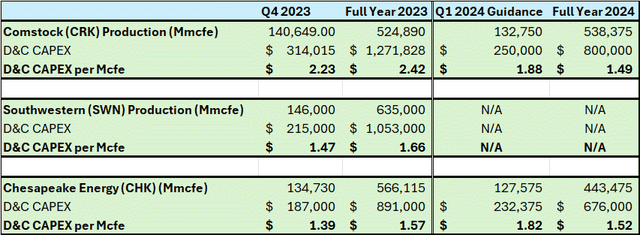
To create this table, I examined Q4 2023 earnings reports for CRK, SWN and CHK as well as their guidance tables for Q1 2024 and full year 2024. In the case of SWN, a company I profiled on SA here, management no longer provides guidance for the year ahead due to the company’s pending acquisition by CHK.
Note that these figures represent only CAPEX spent on drilling and completing new wells; I am excluding any capital spent on items such as midstream infrastructure or land acquisitions to make the capital efficiency comparison more meaningful across companies. For SWN and CHK this table presents only Haynesville portion of their business – D&C CAPEX and production attributed to Haynesville Shale, not their operations in Appalachia.
The left-hand half of my table is historical data for Q4 2023 and full year 2023 and the right-hand side is guidance for the year ahead.
Let’s take Q4 2023 as an example. In the fourth quarter of last year, Comstock spent $2.23 per thousand cubic feet equivalent ($/Mcfe) in D&C CAPEX in Haynesville, its only operating region. In the same quarter, SWN spent $1.47/Mcfe and CHK spent $1.39/Mcfe. In other words, CRK’s CAPEX costs were higher than its two peers in Haynesville on an apples-to-apples basis.
Let’s compare Haynesville producer with the best capital efficiency on my list on this basis – that’s CHK – with CRK.
According to the same financial statements, CHK’s production from Haynesville fell from about 1.61 billion cubic feet equivalent (Bcfe) per day in 2022 to 1.551 Bcfe/day in 2023, a decline of about 3.7% whereas CRK’s production on the same basis was up by 4.8% year-over-year.
So, you could say that CHK spent slightly below a maintenance level in Haynesville last year – they didn’t quite keep up with the treadmill I outlined earlier – whereas CRK’s CAPEX was a bit higher than maintenance levels since production expanded.
However, the cost gap is huge – some $0.85/Mcfe higher costs for CRK in Haynesville relative to CHK last year. Put in a different way, CRK’s costs per Mcfe were more than 50% higher than Chesapeake’s in 2023. The modest difference in production momentum between the two firms pales in comparison to that CAPEX efficiency gap.
CRK has taken steps to ameliorate the situation in 2024, announcing on its Q4 call it plans to reduce its operating rig count in Haynesville from seven to five rigs while cutting D&C CAPEX from a little over $1.27 billion last year to $750 to $850 million in 2024.
The right-hand side of my table above shows CRK’s guidance for Q1 2024 and the full year compared to Chesapeake’s. As you can see, CRK’s guidance implies a significant step up in capital efficiency for the full year. Specifically, in Q1 2024 the mid-point of management’s guidance for D&C CAPEX and production implies spending at $1.88/Mcfe, which is only slightly worse than CHK’s Q1 2024 guidance at $1.82/Mcfe.
And, look at those full year 2024 guidance numbers.
For CRK, D&C capital efficiency on this basis improves further to $1.49/Mcfe at the midpoint of guidance, which is slightly better than CHK’s guidance for the year at $1.52/Mcfe.
And at first blush, the production side of the equation looks compelling for CRK as well. In Q1 2014, the company expects to produce around 132.75 bcfe of gas, down about 5.6% from Q4 2023 levels. And the full year, CRK’s guidance shows production of above 538 bcfe, which is actually higher than the total production last year also listed in my table.
So, a dramatic cut in D&C CAPEX and a small step higher in production is what’s behind that dramatic improvement in capital efficiency for 2024 baked in CRK’s guidance.
Now look at CHK’s guidance. Like CRK, CHK plans to cut CAPEX in Haynesville dramatically for 2024 from $891 million last year to $676 million this year. However, unlike CRK, CHK’s production is expected to decline in 2024 by almost 22% to 443.48 bcfe.
So, this comparison looks favorable for CRK on the surface, but that brings me to this:
Trajectory is Crucial
Dig a bit deeper into the CRK and CHK guidance numbers, and you’ll uncover a different picture.
During CRK’s Q4 2023 earnings release and conference call, management outlined, with some granularity, the steps it’s taking to cut CAPEX and address the serious cash flow outspend that plagued their business throughout 2023. These were the main issues I addressed in my piece back in January and the steps they announced in February included two major steps I anticipated in that piece – the suspension of their dividend and a major cut in capital spending and drilling activity.
One question asked on the Q&A portion of their Q4 2023 conference call was to explain how their guidance for 2024 included both a massive cut in CAPEX and a slight increase in production:
Analyst: Okay, got it. And then, can you talk a little bit about — this is my follow-up, the trajectory of production in 2024? It seems like the implied 2024 guidance is in line with the first quarter, so just a little bit more color there.
Comstock CFO Roland Burns: Yeah. From a — if you think about the time frame related to dropping a rig and starting to show up in terms of impacting production, Dan mentioned, we were dropping the first of those two rigs here this weekend and the second rig within the next two to three weeks I think he said, and so just like when you add a rig, when you drop a rig, there’s plus or minus a six or seven-month lag between the timing of changing your activity level and having it flow through to production. So that’s why — the first half of the year, production should remain relatively flat, and you start to see a little bit of a decline in the third quarter and a little bit larger decline in the fourth quarter as you start to feel the full brunt of running five rigs.
Source: CRK Q4 2023 Conference Call Transcript, February 14, 2024
As I said, the company announced it was dropping two of its seven rigs in Haynesville to cut spending and drilling activity in response to low natural gas prices. However, at the time of the company’s Q4 call in mid-February, they still had seven rigs operating, with one rig set to be released the following weekend and the second by around the end of February.
So, that means CRK really only dropped two rigs for one month in Q1. Up through the end of February, the company was still operating at a higher activity level.
And, as the CFO explains here, there’s a 6-to-7-month lag between adjusting activity levels and having that reduced activity show up in production figures. So, CRK’s guidance for a slight increase in production for 2024 as a whole anticipates relatively strong production through the first half of the year; starting in Q3 and, accelerating in Q4, production is on course to tail off significantly as the drop in drilling and completion activity starting in March begins to catch up to CRK.
Put in a different way, CRK has positive production momentum in the first half of 2024 because capital spending decisions it made 6-7 months ago, and drilling and completion activity 6-7 months ago, are what determines the current level of output. In the second half of 2024, however, the company’s production will begin to fall as CAPEX cuts made in the first half begin to bite.
Unfortunately, that’s not a favorable trajectory for production in 2024 because of this:
Natural Gas Futures Curve Through December 2025 (Bloomberg)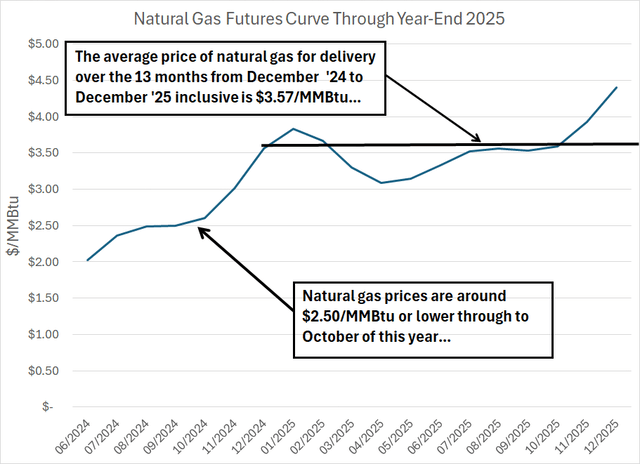
This chart shows the NYMEX Henry Hub Natural Gas futures curve from June 2024 (the current front month) through December 2025.
These are the actual current prices for natural gas for delivery in every month from June 2024 to December 2025. That’s important because a producer today could likely hedge gas production in future months at levels approximated by this curve.
Look at this chart – through to October 2024, US gas futures prices are trading at generally low levels of around $2.50/MMBtu or lower. Then, starting in the final two months of this year, prices start to move sharply higher, and the average price of gas for delivery over the 13 months from December 2024 to December 2025 inclusive is $3.57/MMBtu.
There are a few different reasons for that. One is simply that, as I explained in an article here on Seeking Alpha earlier this week “ProShares Ultra Bloomberg Natural Gas: Trading Short-Term Tailwinds (Rating Upgrade),” producers including CHK, EQT and CRK, are responding to current low natural gas prices, and elevated storage, by cutting production. As supply falls, that should serve to tighten up the gas market supply-demand balance and support prices.
Further, several new LNG export facilities are due for start-up on the US Gulf Coast by early next year – that’s expected to support demand and tighten up the US gas market.
However, regardless of the reason, this futures curve does not sit well with CRK’s production cadence through this year.
That’s because CRK is expecting to produce more gas earlier in the year when prices are depressed, and production is expected to be falling by the second half of 2024 and into 2025 just as futures pricing improves dramatically.
And, given the lag times between CAPEX, drilling activity and production I just outlined, even if CRK were to boost spending amid a strengthening gas market in early 2025, that might not “show up” in results until Q3 of next year at the earliest.
Also note the trajectory of CRK’s planned production in 2024 flatters the company on the capital efficiency basis I outlined earlier (D&C CAPEX in $/Mcfe). That’s because production in 2024 is benefiting from CRK’s elevated CAPEX in 2023 while the big cut in CAPEX for 2024 will negatively impact production into 2025.
In contrast, CHK’s strategy for 2024 is different primarily because of what are known as deferred TILs.
TIL is an acronym for turn-in-line. A TIL is an industry term for the final step of putting a well that’s been drilled and completed (fractured and ready to produce) into actual production.
So, by deferring TILs, CHK will continue to drill and fracture wells across both its Haynesville and Marcellus acreage, but it will not put those wells into production immediately. Instead, CHK plans to defer production start-up until the natural gas market is healthier. CHK’s strategic plan, outlined in their Q4 2023 earnings presentation is to build up to around 80 deferred TILs by Q4 of this year, which represents as much as a billion cubic feet per day of deferred production capacity.
Management estimates it could put all those deferred TIL wells into production at a minimal cost of just $50 million and, during their Q4 call, management indicated that putting TILs into production would result in an almost immediate bump in production – a matter of a few weeks or a month rather than the 6-7 month lag between a change in drilling activity and a corresponding production response.
Also, note that deferred TILs are different from the more familiar drilled uncompleted wells known in the industry by the acronym “DUCs.”
A DUC is essentially a well that’s been drilled but not fractured or completed, so it’s in an earlier stage of development than a deferred TIL. In CHK’s case, the company also plans to build up to 35 DUCs by Q4 of this year. These DUCs would take longer to activate – CHK estimates it takes a full quarter to Activate a DUC and impact production – and the cost of activation is higher because these wells have not yet been fractured. Specifically, CHK estimates a cost of $175 million to activate the DUCs it’s planning to build this year.
Two points to note about all this.
First, CRK’s strong production momentum in the first half of 2024 and dramatic CAPEX cuts flatter its capital efficiency statistics, making them appear artificially good this year. In CHK’s case the opposite is true – its capital spending will reflect the cost of drilling and completing wells (TILs), but production won’t benefit until the company activates that production, likely as gas prices start to improve in 2025. So, that artificially inflates the D&C CAPEX/Mcfe numbers for CHK and deflates them for CRK this year.
Second, I like CHK’s production trajectory far better than CRK’s because it’s allowing production to fall dramatically near term when the economics of producing and selling gas at sub-$2/MMBtu are poor. At the same time, it’s setting itself up for a rapid increase in production as prices recover next year, and it activates TILs for a small incremental CAPEX cost ($50 million out of a 2024 D&C CAPEX guidance of over $1 billion).
Back in my bearish January piece on CRK, I noted management faced some tough choices in 2024 due to the company’s relatively high cash cost structure, hefty net debt burden and poor hedge coverage to protect cash flows amid a near-term plunge in gas prices.
Management has taken some constructive and, in my opinion, necessary steps such as eliminating their dividend and cutting CAPEX to reduce their cash flow outspend (negative free cash flow). As I’ll detail in a moment they’ve also taken some steps with the support of majority shareholder Jerry Jones to ease near-term concerns about their financial stability and debt position.
However, even with these moves, CRK had effectively no choice but to cut CAPEX this year – they simply do not have the financial flexibility to pursue a strategy of deferring near-term cash flows in favor of production momentum in 2025 as CHK has done.
So, with those points in mind, let’s take a quick look at CRK’s free cash flow outlook for 2024 and beyond.
Free Cash Flow Model
Here on Seeking Alpha I’ve covered multiple oil and gas producers in recent months including, most recently, Matador Resources Company (MTDR) back on April 9, EOG Resources, Inc. (EOG) in “Organic Growth at a Discount” and Devon Energy Corporation (DVN) in “Turnaround Underway, Time to Buy.”
My approach is always the same.
I create a model of the company’s production, costs and CAPEX based on management’s latest guidance. Then I use conservative commodity price assumptions, based on pricing already factored into the futures curve, to derive a basic free cash flow estimate for the producer.
Here’s my model for CRK:
Free Cash Flow Model for CRK in Q1 and FY 2024 (April 2024 Guidance)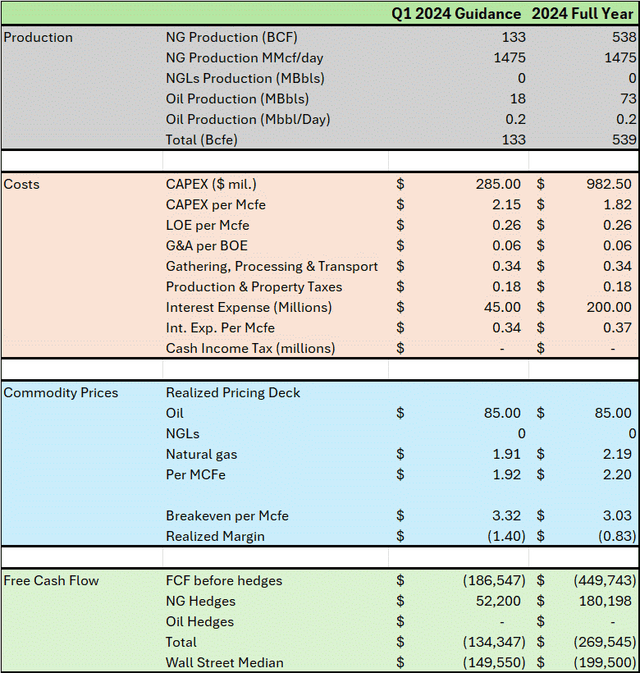
This table presents my production and cash flow guidance for both Q1 and full year 2024. It’s based on the company’s guidance released in their April 2024 investment presentation.
The top segment of the model in grey shows the midpoint of management’s production guidance for Q1 and the full year. CRK does not report production of any natural gas liquids (NGLs) like ethane or butane and their oil output is small at 73,000 barrels for the year. While I did break out that oil production in the table for the sake of providing some detail, it’s essentially meaningless to the model.
The CRK story is all about natural gas.
I covered most of the cost line items in my discussion earlier. The one point to note is the CAPEX and CAPEX in $/Mcfe line items differ from what I covered earlier. That’s because previously I only covered drilling and completion (D&C) CAPEX and these higher figures include guidance for spending on midstream infrastructure and land acquisitions.
For the realized commodity pricing I simply used actual historical data for commodity prices year-to-date (Henry Hub front-month natural gas futures) through late April and the futures market curve for the months of June through December 2024, the same prices that I showed you on my futures curve graph earlier in this article.
In the past few quarters on an unhedged basis, CRK has sold its gas production for a price of roughly 92% of the Henry Hub benchmark, so I used that same pricing discount for my estimated prices in the model.
And that brings me to the most important part.
Based on my estimates, CRK would have needed average gas prices of about $3.32/mcf – by convention that’s the same as $3.32/MMBtu – in Q1 2024 to cover all its operating costs and CAPEX and produce free cash flow before hedges. The actual average realized price of gas I’ve estimated is closer to $1.92/MMBtu, which means CRK likely faced significant negative free cash flow through Q1.
On the same investor presentation, the company revealed it has hedged 400 million cubic feet of gas production per day in Q1 2024 at a price of $3.55/MMBTu, which gives the company’s cash flow a $52.2 million boost in Q1.
However, even after accounting for hedges as I’ve done in my table, I still estimate CRK’s cash flow at negative $134.4 million in Q1 2024 – the company likely spent more than it generated in cash, forcing it to take on debt to cover the difference. As you can see, my estimate is pretty much in line with the median estimate on Wall Street of -$149.6 million in free cash flow for Q1.
CRK is due to report earnings on May 1 (Wednesday) after the market close and will host a conference call to discuss results the following morning. If free cash flow does come in that negative, don’t be surprised if management fields questions from analysts on the call regarding the possibility of reducing activity levels still further by, for example, dropping an additional rig later this year.
The good news is the main issue for Q1 free cash flow is that, as I noted earlier, the company wasn’t able to drop two of its drilling rigs until the final month of the quarter, which inflated CAPEX in Q1 relative to the remainder of the year.
So, if we produce the same model based on full-year guidance and full year hedging, I calculate a total free cash flow outspend for 2024 in the region of $269.6 million, so cash outspend through the last nine months of 2024 (Q2 through Q4) is set to be about the same in aggregate as the first three months of the year.
Wall Street consensus is a bit more sanguine than my estimates at just under $200 million in total outspend. However, regardless, even though CRK’s outspend is improving, free cash flow is still likely to be negative straight through 2024.
So, any buy case for CRK would need to be based on the outlook for cash flows beyond 2024 and, as I noted earlier, the problem here is the trajectory of production. Because of the lagged effects of CAPEX cuts in the first half of 2024, CRK’s production is likely to fall at an accelerating clip as we approach year-end, just as commodity prices are expected to recover.
I re-ran my model with a few new assumptions just to get an idea of what’s possible longer term.
If natural gas prices do recover in 2025, I’d expect CRK to boost CAPEX again to stabilize, and eventually grow output. So, let’s pencil in $1 billion in spending for 2025, which is higher than 2024, but not quite as high as 2023 at over $1.3 billion. Let’s further hold production, and all other costs steady.
At $3.60/MMBtu Henry Hub gas prices – approximately the current average price of gas futures for delivery in all 12 months of 2025 — I’d estimate free cash flow of around $150 million before hedges and at $4/MMBtu free cash flow jumps up towards $335 million.
However, CRK has an enterprise value – the market value of the stock and net debt – of close to $6 billion. On this basis, CRK’s free cash flow yield based on its enterprise value doesn’t look impressive compared to other major gas producers I’ve covered here like EQT.
In short, I believe CRK has good long-term free cash flow upside potential and that CAPEX cuts and dividend suspension announced earlier this year were necessary to shore up the company’s financial stability. However, these were not painless choices – there are longer-term negative repercussions for production and CRK’s ability to generate free cash flow amid an expected recovery in gas prices in 2025.
And given the negative near-term free cash flow estimate, and production and CAPEX efficiency questions hanging over 2025 and beyond as well, it’s still difficult for me to create a meaningful discounted cash flow valuation target for CRK as I’ve done for other producers covered here on Seeking Alpha.
Diminished Tail Risks
Let me be clear about one more point.
I do believe CRK has reduced the “tail risks” facing the firm. As I explained back in January a business-as-usual approach would have resulted in serious cash flow outspend and a dangerous accumulation of debt through 2024.
CAPEX cuts and the dividend elimination have halved the potential free cash flow outspend for 2024 from the $500 million I estimated back in January to around $250 million per the estimates I just outlined.
Further in April, CRK announced two major additional moves.
First, the company sold 12.5 million shares of its common stock to entities controlled by majority shareholder Jerry Jones, boosting the billionaire’s stake in CRK to 67%.
While that handed CRK over $100 million in proceeds, it’s also diluted the value of the stock – as of the end of 2023, before this offering of stock, the share count stood at approximately 277 million, so the share count increased by about 4.5%. The company indicated it used the proceeds from this sale to pay down debt drawn on its credit lines.
Second, the company priced an offering of $400 million worth of bonds due 2029. Management indicated they’d use the proceeds of this offering to pay down debt drawn on CRK’s credit facility with a consortium of banks.
As of the end of last quarter, CRK had drawn about $480 million on its credit facility, so it’s likely these two moves have allowed the company to repay its outstanding borrowings under that line. That’s attractive because while the company’s revolving credit line is open until 2027, the banks redetermine CRK’s borrowing capacity twice per year – in spring and autumn – as I outlined in my January article on the stock.
There were legitimate concerns that with debt creeping higher – balances on the credit line rising – the banks could decide to cut the size of the company’s borrowing capacity this spring. That could have threatened the company’s capacity to fund even a reduced level of CAPEX through the current period of depressed gas prices.
There’s still a risk the company’s borrowing base will be cut this year – redeterminations are slated for this month (April 2024) and October. However, at least the money CRK has raised will assuage near-term liquidity concerns even with reduced borrowing capacity.
I also believe it’s a strong show of confidence and support from Jerry Jones that he stepped in to support the company and shore up confidence in the stock that slid as low as $7.28 earlier this year. Fading downside “tail” risks have undoubtedly helped the stock, which has recovered from that February nadir to trade near $10.50 per share in recent sessions.
However, it’s important not to conflate a liquidity crisis – concerns about near-term financial stability and access to capital – and a profitability crisis. While the former has been alleviated to a significant extent, the latter remains a headwind for CRK.
Specifically, the company’s dramatic CAPEX cuts have reduced cash burn; however, they’ve also hampered the company’s ability to take advantage of longer-term upside in gas prices.
While I continue to believe Haynesville, with its proximity to the Gulf Coast, will become the key source of gas for LNG export terminals, CRK isn’t the only play on that Haynesville story.
On a standalone basis, both CHK and SWN for example, have a lower cost structure for their Haynesville business than CRK. And, should the firms merge as proposed and expected, the combined company would overtake EQT to become the largest gas producer in the US and Haynesville. At the end of last year, CHK had a net debt of just $871 million compared to around $2.7 billion for CRK despite the former’s stock market value of more than $12 billion per Bloomberg compared to less than $3 billion for CRK.
Risks and Conclusion
A long-term reader recently told me, likely only partly in jest, that I’m a hard grader when it comes to exploration and production (E&P) companies like CRK. So, perhaps I should explain my Sell rating on CRK.
Let me start by warning readers I see multiple upside risks for the stock.
The most obvious is commodity prices. Should gas prices recover more quickly than expected, that would be a serious tailwind for CRK. And, with the company’s light hedging this year – only about 27% of production through the first three quarters of this year – a jump in near-term gas prices could mean that CRK manages to produce more free cash flow than I’ve modeled.
In a recent SA article, I outlined a bullish case for gas through the summer months due, in large part, to expectations for production cuts and a tightening supply/demand balance this summer. Such a move, especially should gas prices jump over $3/MMBtu where CRK gets close to a cash cost breakeven, could catalyze a rally in the stock.
Confirmation that major LNG export terminals – like Exxon’s Golden Pass facility in Texas — are due for start-up on schedule by early 2025 could also support the gas futures curve in 2025, boosting valuations for stocks like CRK.
Finally, while President Biden’s decision to pause new LNG export licenses has little or no impact on US LNG exports through 2028, a lift in that ban could give a psychological boost to Haynesville producers, since they’re best placed geographically to benefit from LNG export growth.
More broadly, as you can tell by reading my articles covering several E&P companies here in SA, I’m generally bullish on the group and my DCF valuation targets on conservative assumptions imply significant upside in most cases.
In short, I see the potential for a rising tide in the group that lifts all boats to some extent regardless of underlying fundamentals.
Despite my sell rating, I think it’s quite possible CRK will rally in price over the next few quarters just based solely on the rise in gas prices factored into the futures curve and the consequent stabilization of the company’s cash flow outspend as I’ve outlined.
However, I see elevated risk CRK underperforms the group as a whole into 2025.
My issue is that while CRK would benefit from higher gas prices, and the other upside catalysts I’ve outlined, many other producers like SWN/CHK are also likely to benefit from the same tailwinds. Indeed, these companies have arguably more near-term leverage to gas prices given the flexibility of producers like CHK to activate TILs quickly to boost output into an improving market environment. In contrast, CRK by its own estimates sees a 6-7 month lag between boosting CAPEX and enjoying higher output.
At the same time, I believe CRK faces above-average downside risks. Chief among those is that the expected recovery in gas prices, already factored into the curve, could be delayed due to a warm winter in 2024-25 or a delay in new LNG terminal start-up until Q2 2025 or later.
Granted, such an event would be bad for all gas producers. However, given CRK’s elevated cost structure and high net debt, continued cash burn beyond the second half of 2024 could force it to sell more stock or take even more dramatic action on CAPEX and activity levels.
So, with those points in mind I see an elevated risk of continued underperformance from CRK relative to its peers and greater downside risks should gas prices take longer than expected to recover. That’s the rationale behind my sell rating.
 (NASDAQ:SOUN)")

 J.P. Morgan 52nd Annual Global Technology, Media and Communications Conference (Transcript)")

")

")
