


")


The layout has been adjusted to lead with the tickers and charts. Why? Because I think it allows the article to flow more naturally. Like it or hate it? Let me know in the comments.
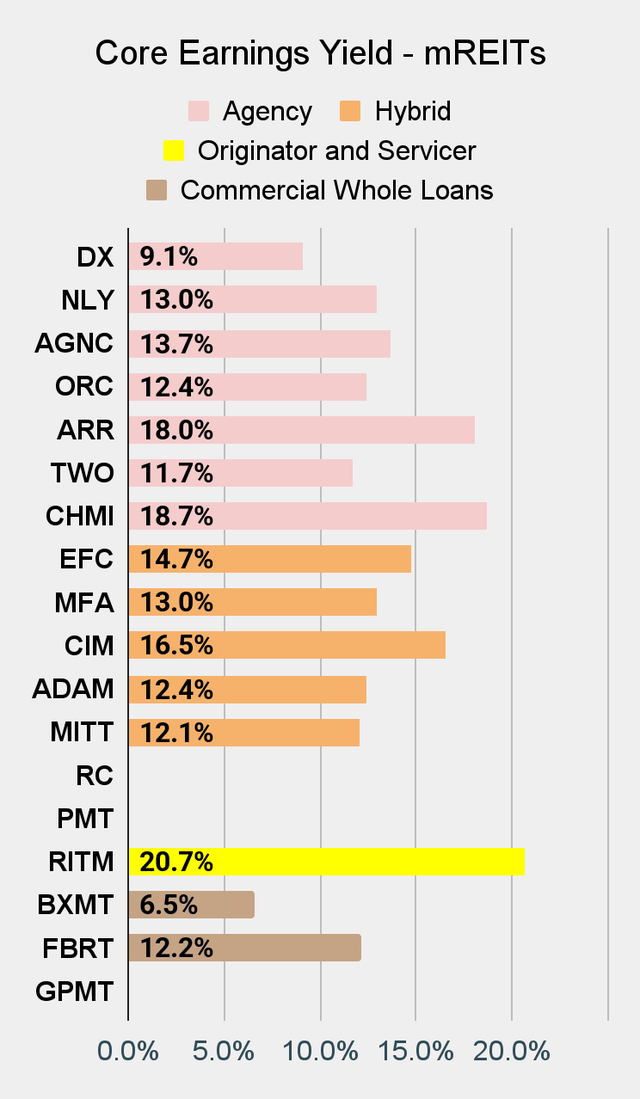
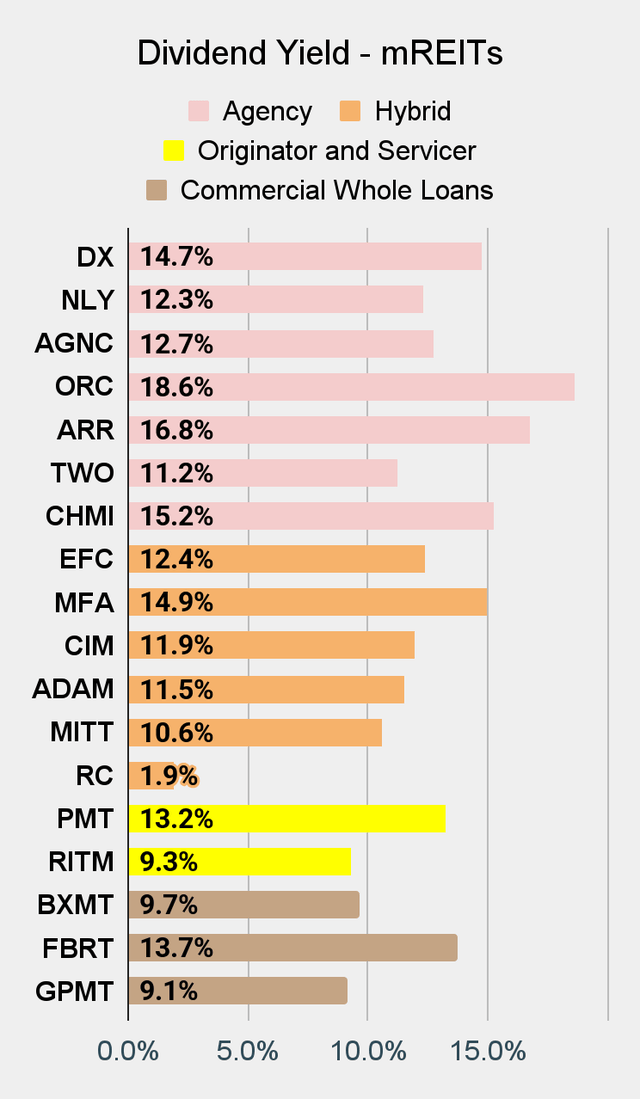
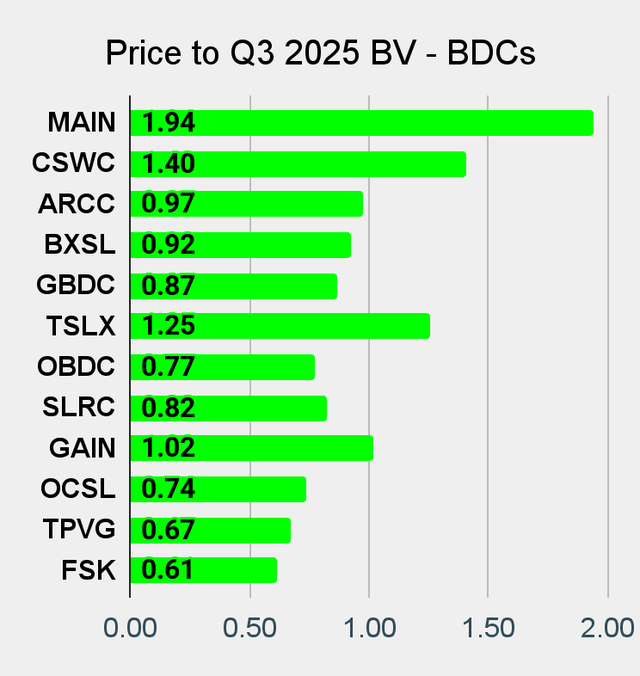
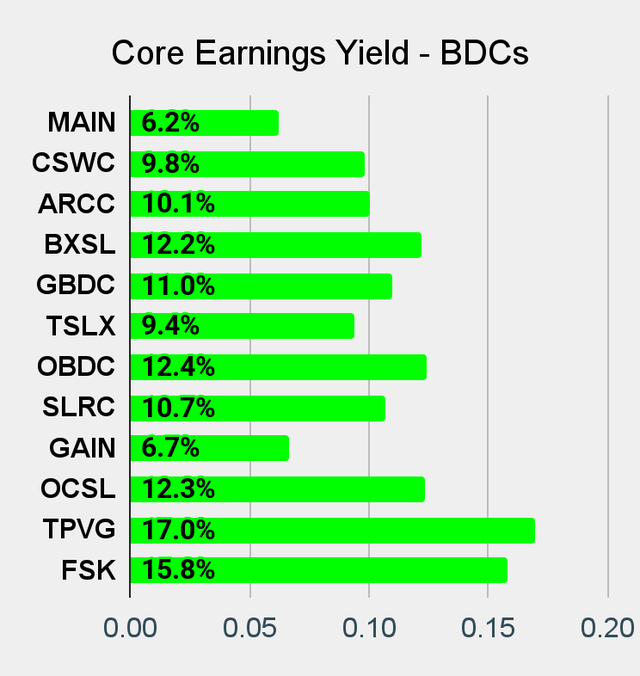
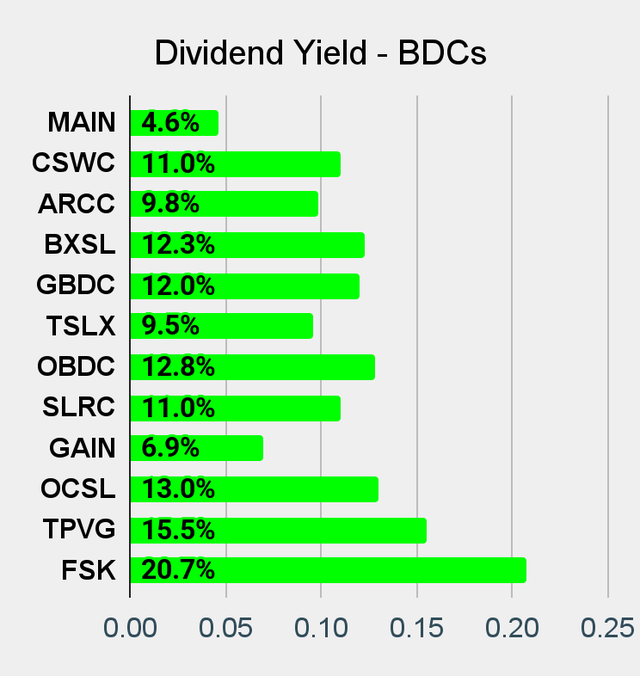
The High Yielders
The charts compare the common shares from the following mortgage REITs and BDCs:
The Charts
Mortgage REITs and BDCs:
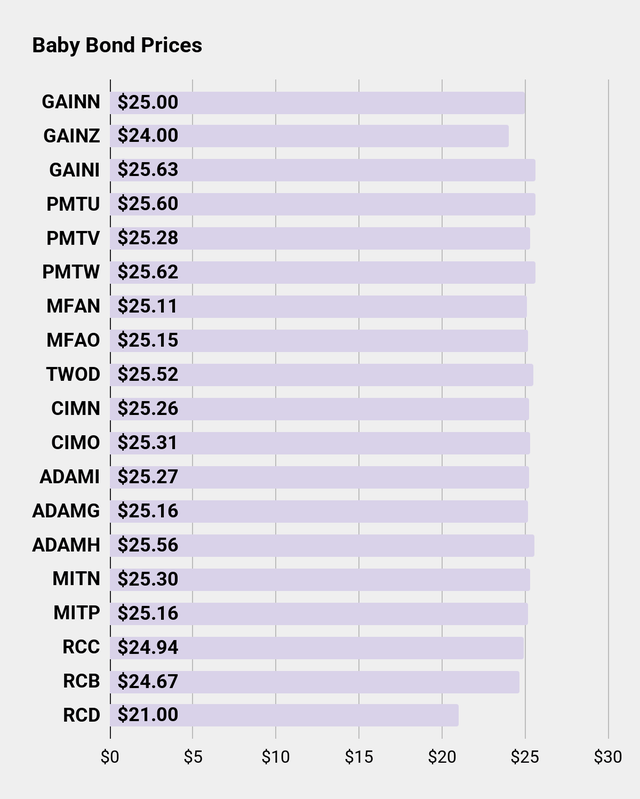
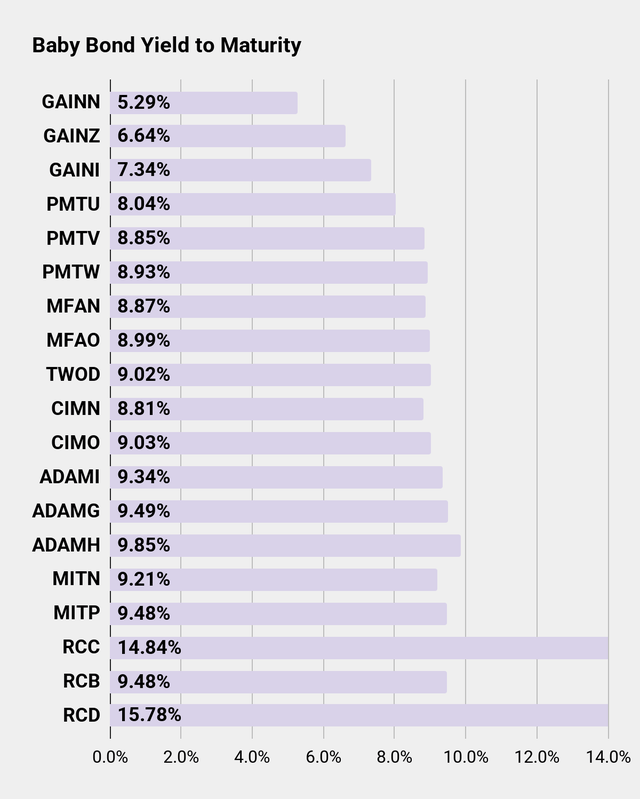
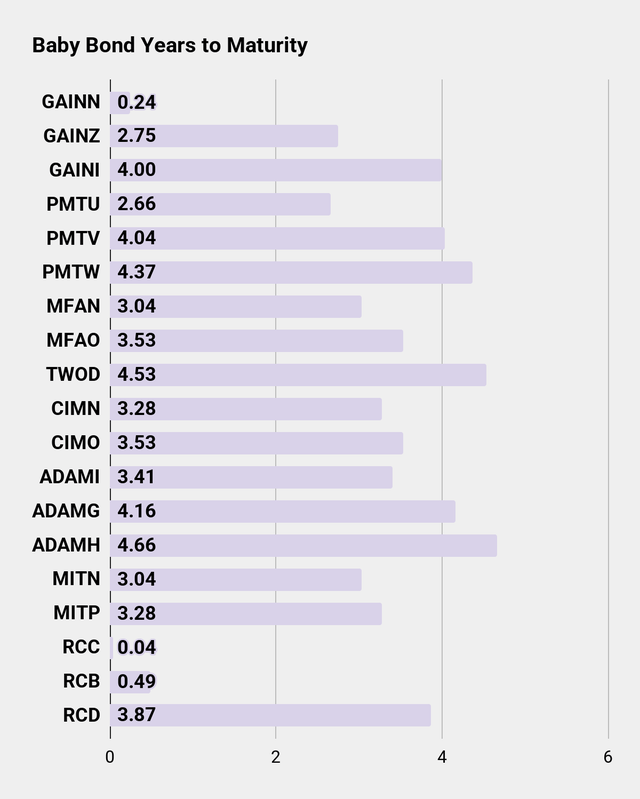
Preferred shares and baby bonds:
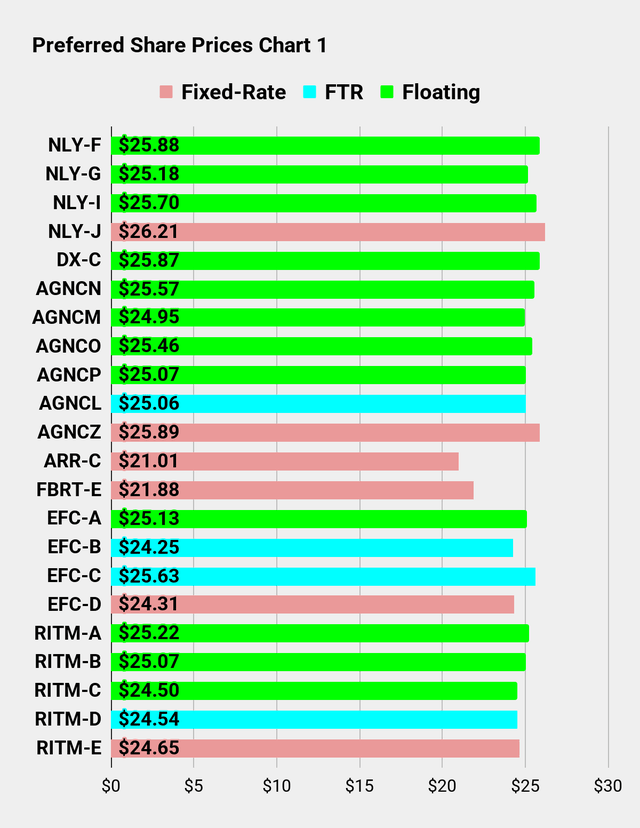
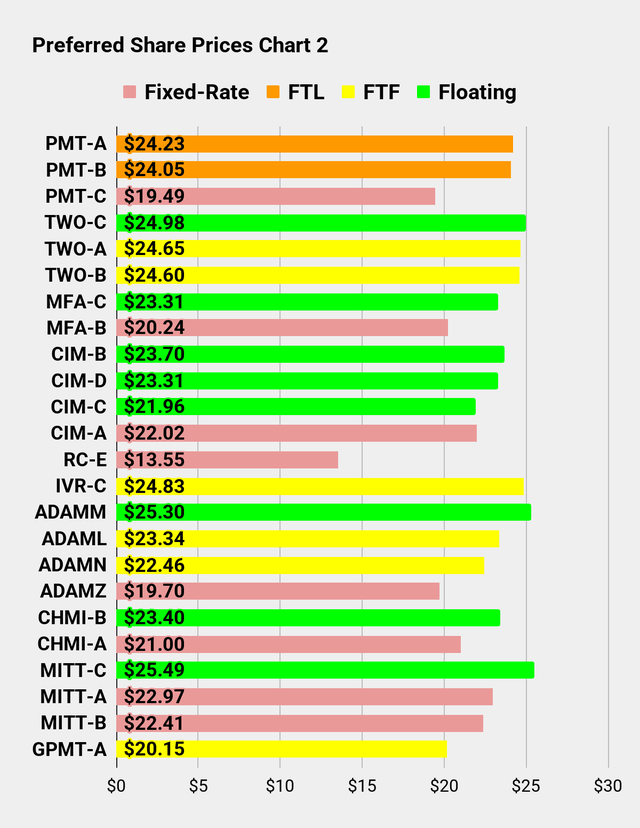
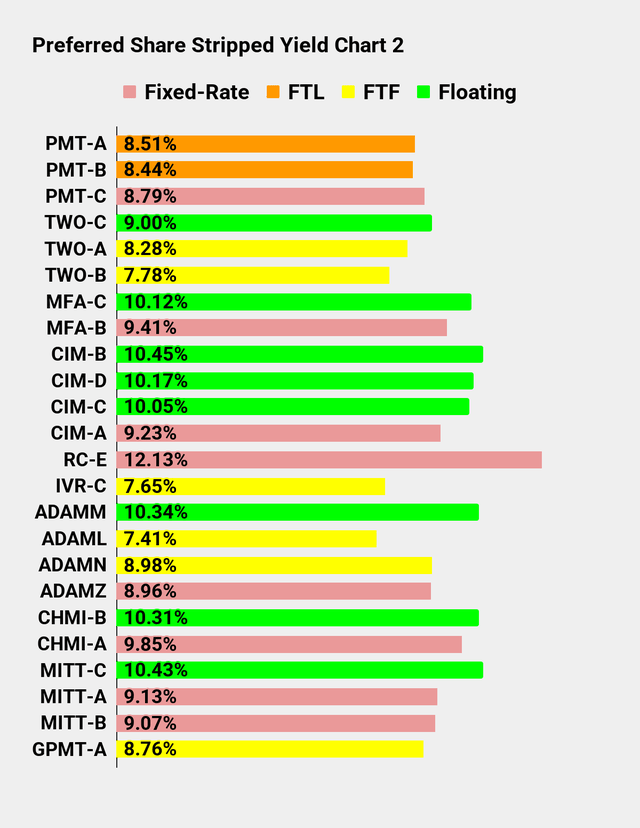
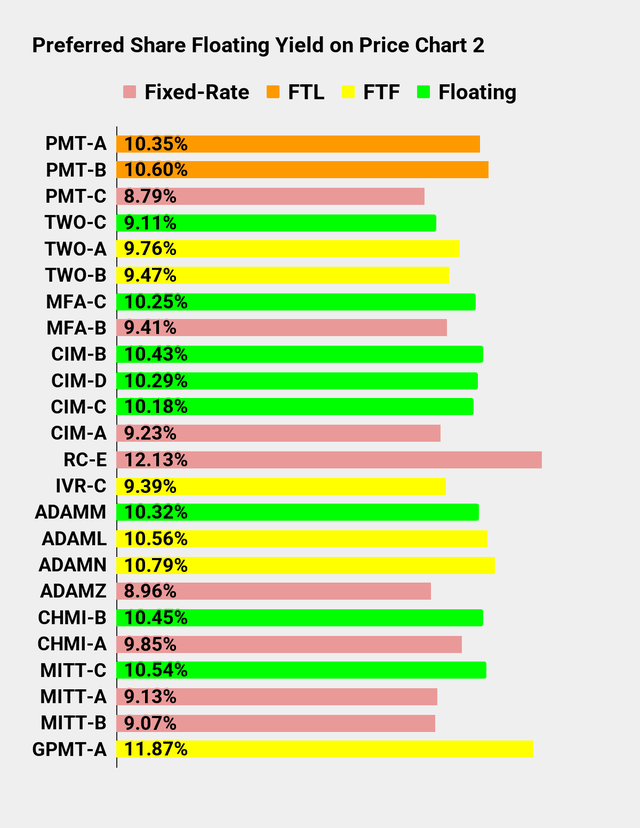
Definitions for preferred shares:
- FTF stands for “fixed-to-floating.” It means the share is fixed-rate but will begin floating based on SOFR. We may still refer to LIBOR, but LIBOR simply means SOFR + 26.161 basis points.
- FTR stands for “fixed-to-reset.” These shares are currently fixed rate but will eventually reset their dividend rate based on the 5-year treasury rate plus a given spread. They typically continue to reset every 5 years thereafter. At least in theory. That’s pretty far away, but those are the terms.
- FTL stands for “fixed-to-lawsuit.” It only gets applied for PMT because they were the only mortgage REIT (that we know of) where management announced that “floating” really means a fixed dividend rate that never changes. PMT was sued over its actions. The shares continue to pay out a fixed rate while the lawsuit is in progress.
- Floating stands for a share that is floating. Pretty obvious, right? This is the adult version of “FTF.” The rate is typically updated every 3 months.
Commentary From The REIT Forum
Earnings for Q4 2025 are just getting underway. We’re still using Q3 2025 book values in our charts to avoid having them distorted by which REITs announce their performance first. It doesn’t make sense to value one REIT based on the Q4 2025 position and the other on the Q3 2025 position. We have estimates for the current book value (or net asset value) for the mortgage REITs and BDCs we cover, but that’s part of our service on The REIT Forum.
The big story from Friday is the plunge in Silver (SLV):
Seeking Alpha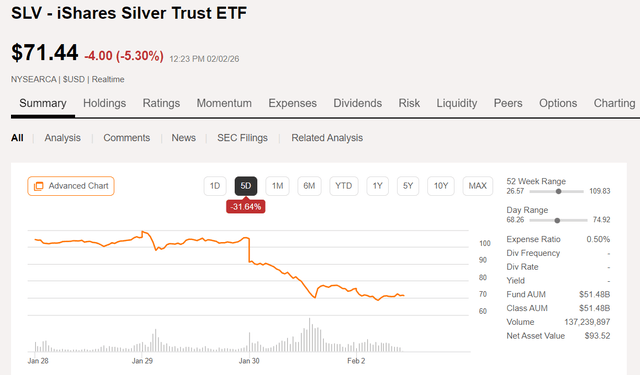
Shares briefly touched near $110 before plunging back to $71.44 by Monday morning. Most of the damage came on Friday. Do we care? Not that much. It’s not a big part of our story. No, we want to talk about the mortgage REIT mayhem.
Check out the meltdown:
Seeking Alpha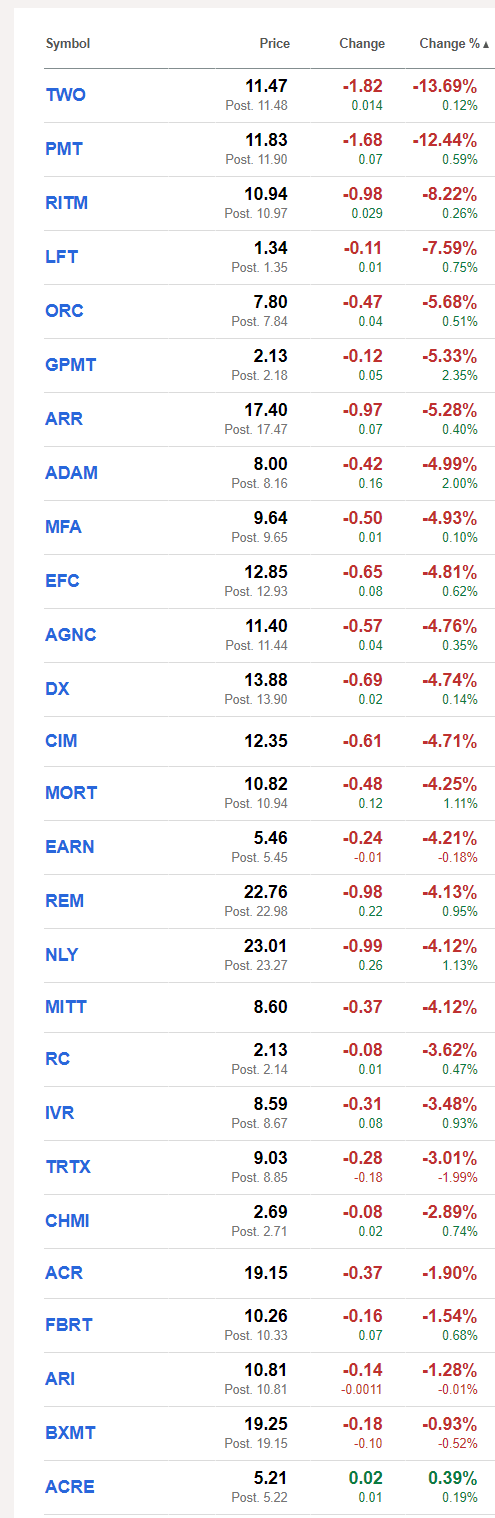
It looks like Microsoft (MSFT) reported earnings again. That earnings report was amazing because it even prompted Nvidia (NVDA) to promptly announce that the proposed $100 billion investment in OpenAI was never a commitment.
The vast majority of mortgage REITs saw substantial declines. That table includes a pair of mortgage REIT ETFs, but their declines look a little smaller than most of the players in the sector.
The part I want to focus on is why the mortgage REITs got hammered. By looking at the table, we can see that the 3 mortgage REITs to take the biggest hits also have the most exposure to mortgage REIT origination and MSRs (mortgage servicing rights).
Two Harbors holds a bunch of MSRs. That is only part of the story, though. Two Harbors is being purchased by UWM Holdings Corporation (UWMC). Shareholders of Two Harbors are getting shares of UWMC, so the value of Two Harbors is driven by the merger.
Driving The Decline
What caused the huge decline in mortgage REIT valuations?
They were all down on sympathy to the plunge in PennyMac Financial Services (PFSI), as shown below:
Seeking Alpha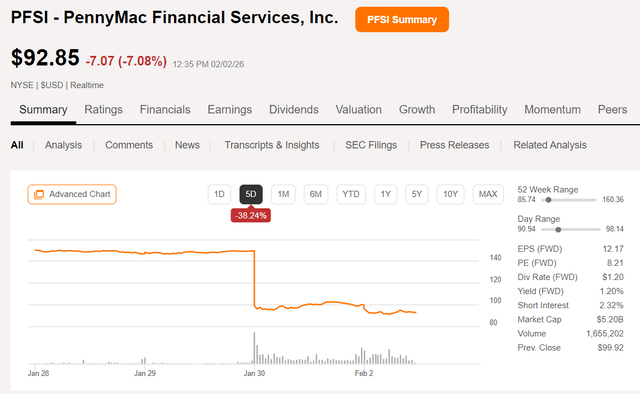
For a deeper explanation, I’ll bring out some commentary Scott Kennedy provided for members of The REIT Forum:
On Friday, there was notable mREIT sector volatility regarding stock price movements. As noted above, there really was not a “blow out” in agency/non-agency MBS and mortgage-related spreads. Therefore, generally speaking, there was modest – notable improvement in sector valuations. The large sell-off in mREITs Friday was basically from a “1-2” punch between hotter-than-expected CPI/PPI data and PMT/PFSI reporting compressed gain-on-sale/loan margins and larger MSR amortization (though PFSI’s results were more severe vs. PMT; see below). Could even throw the Fed Chair announcement in the mix. These events basically caused the market to sell the entire sector regardless of fundamentals or specific sub-sector performance. To remain non-bias, I would say a minor sell-off could have been justified in some names but certainly not to the levels some stocks sold-off.
Even though this service does not specifically cover PennyMac Financial Services (a non-REIT affiliate of PMT), I believe a (33%) drop in stock price on Friday is a good reason to quickly review PFSI’s recent valuation and quarterly performance when compared to PMT (who reported results matching my expectations). Simply put, a quick “compare and contrast” between PFSI and PMT as both companies have a similar investment portfolio and overall business model.
Again, just to reiterate, PFSI is an originator + servicer company but is not a REIT. Even after a massive (33%) sell-off on Friday, PFSI’s stock still only generates an annualized dividend yield of 1.20%. Simply put, I believe this would not be appealing to a dividend investor. Since PFSI is not a REIT entity per the Internal Revenue Code (“IRC”), there are no dividend “thresholds” needed for a C-Corp. Entity. At a minimum, a REIT entity per the IRC needs to distribute 90% of the company’s annual “earnings and profit”/REIT taxable income (“AREITTI”) to remain in compliance with the IRC. Failure to do so would be a de-listing of REIT status and severe penalties. There is an exclusion to this mandate, the spillback provision, but this topic/discussion moves beyond this specific discussion and has been extensively covered in past mREIT analyzes/articles. This is important to point out. This is one of the main reasons this service does not cover non-REIT originator and servicer stocks. With that being said, let us perform a quick comparison between PFSI and PMT.
First, PFSI’s BV as of 12/31/2025 was $82.77 per share. This was a slight increase during Q4 2025 which largely matched PMT’s quarterly BV movement. However, unlike PMT, PFSI was trading at a very large premium leading up to earnings (as some of the non-REIT originator + servicers have been doing lately). In my opinion, that was a pretty large “red flag”. Simply put, trading at an 80% premium to CURRENT BV means the company, with only a dividend yield of 1%, has to be “running on all cylinders”. Any type of “sputter”/miss and the stock will get punished (as PFSI did on Friday). In comparison, at the time of earnings, PMT was trading at a discount to CURRENT BV of (13%). That is a “valuation spread/gap” of (93%). Simply put, a huge difference in valuation.
Second, PFSI’s weighted average coupon (“WAC”) within the company’s MSR sub-portfolio was 5.0% as of 12/31/2025. Similar to UWM Holdings Corp. (UWMC) that was recently discussed in the TWO acquisition article, that was a pretty high coupon. Simply put, higher coupons typically have higher prepayment rates when compared to lower coupons (continuously mentioned/discussed in mREIT coverage). As such, when compared to PMT’s MSR WAC of only 3.9% as of 12/31/2025, it makes sense PFSI’s current period MSR amortization costs rose more severely (on a percentage basis) when compared to PMT. PMT also experienced a net increase in MSR amortization (which was correctly projected in my modeling) but not nearly to the same extent when compared to PFSI. A 1.1% difference may not seem like a notable difference. However, when dealing with MSR amortization/prepayment rates, it’s a noticeable difference.
Third, PFSI’s hedging results were not great (they had a contra net long position to combat valuation fluctuations of the MSR portfolio). PMT’s hedging results were negative as well so pretty similar results there. Again, correctly modeled on our end regarding PMT (see link above). That said, both PMT and PFSI slightly increased BV during Q4 2025 which was a bit of a “silver lining” for PFSI.
So, in summary, PFSI’s non-mREIT valuation was extremely expensive (at least when compared to my/our covered mREITs) heading into earnings. So, a glaring “red flag” there. PFSI’s high MSR WAC should have also been, at the least, a “yellow flag” as rates/yields continued to decrease during Q4 2025.
Again, since my/our mREIT methodology centers around valuation, if I/we covered PFSI, this stock would have been deemed “notably overvalued” leading up to Q4 2025 earnings.
So, was it fair the entire mREIT sector was negatively impacted, to a large degree, from PFSI’s results on Friday? Simply put, no. However, markets usually act first and analyze later. As noted on Friday in chat, the CPI/PPI data was likely a culprit as well. Also the new Fed. Chairman could have led to some of the volatility. I hope this quick PFSI vs. PMT comparison helps subscribers understand what happened on Friday and why some stocks, in my professional opinion, unjustifiably sold-off.
High-Yield Positions
I’ve already started shifting my portfolio to increase my allocation to preferred shares and baby bonds. As I’ve been reviewing our performance by sector, I’ve found the preferred shares and baby bonds have provided great results over a long period. They were not only doing well on a risk-adjusted basis. They were also regularly outperforming the sectors. That’s no surprise since we often ended positions with a modestly higher price in addition to collecting a very large yield. Consequently, the returns on many of our preferred share and baby bond positions surpassed the fairly substantial yield. Consequently, it just makes sense to allocate a greater portion of my portfolio to the sector. Over the last several months, most of my purchases have been preferred shares and baby bonds.
Editor’s Note: This article covers one or more microcap stocks. Please be aware of the risks associated with these stocks.
")


