


The market divergences are growing, especially now when it seems clear that the S&P 500 (SP500) is pulling away from its peers like the Russell 2000 (RTY), the Dow Jones (DJI), and even the equally weighted S&P 500 (RSP). The biggest driver of this divergence has been the rally’s lopsided nature, driven by just a few names that accounted for most of the gains in 2024.
However, this may change in the second half of 2024, as the growth rate slows for the “Magnificent 7” and growth rates for the broader S&P 500 catch-up, based on sell-side analysts’ estimates. That may leave the biggest winner in the first half of 2024, Nvidia (NVDA), in a tough spot as the year progresses.
Lopsided Returns
The Bloomberg US Large Cap Index can be used as a proxy for the S&P 500 because it has tracked the returns over the past five years and gives us access to the breakdown and returns of individual tickers and index impacts.
Bloomberg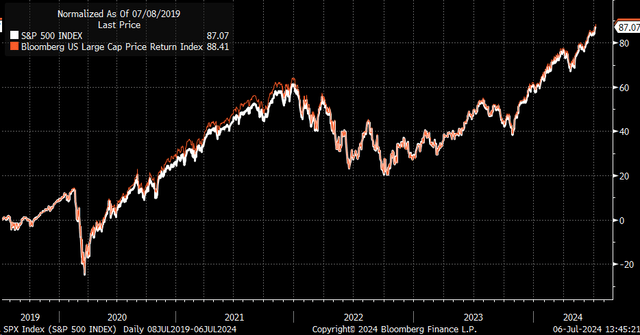
The data shows that year to date, the top five stocks account for 57% of the returns. The top five stocks include Nvidia, Microsoft (MSFT), Apple (AAPL), Amazon (AMZN), and Meta (META). Nvidia is the clear winner in 2024 and has accounted for about 27% of the gains in the index, with Microsoft a distant second, accounting for about 10%. The impacts of the Nvidia in 2024 are certainly not within the historical norm over the past decade.
Bloomberg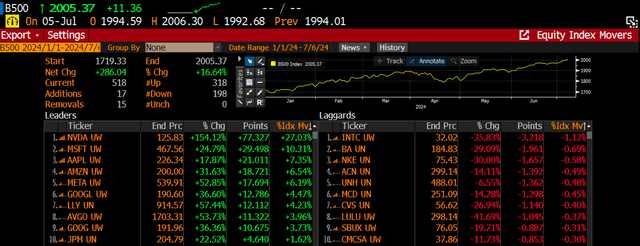
Additionally, in the years when the index was higher, such as in 2014, 2016, 2017, 2019, 2020, and 2021, approximately 40% or more of the stocks outperformed the index. However, in 2023 and 2024, this trend changed, with only about 30% and 25% of the stocks outperforming the index, respectively. If you take that one step further, one stock has never accounted for more than 20% of the gains over the past decade, except in 2024. Only in 2020 did Apple account for about 17% of the gains.
| DATE | SYMBOL | % OF GAINS |
| 2014 | AAPL | 10.30% |
| 2016 | JPM | 4.90% |
| 2017 | AAPL | 7.20% |
| 2019 | AAPL | 9.30% |
| 2020 | AAPL | 17.50% |
| 2021 | MSFT | 10.50% |
| 2023 | MSFT | 12.60% |
| 2024 | NVDA | 27.00% |
Paying Up For Growth
There seems to be a logical explanation for all of this herd mentality and concentration into just a few names, and that seems to come down to the fact that earnings growth has been better among the “Magnificent 7” than the rest of the market. The year-over-year gains for the Bloomberg Magnificent 7 index seem to ebb and flow with changes in the group’s earnings growth going back to 2019. However, what is also clear is that after this quarter, the growth rate is expected to slow dramatically.
Bloomberg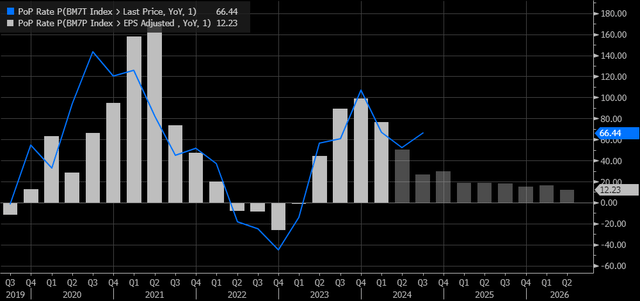
What is also clear right now is that earnings estimates for the second quarter of the Bloomberg Magnificent 7 index have been revised higher. In contrast, the S&P 500 earnings estimates for the second quarter have been revised lower.
Bloomberg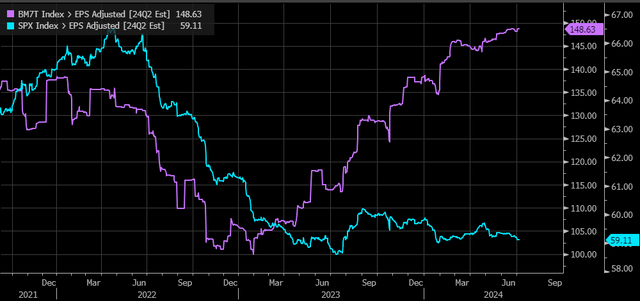
Further, the growth rates in the S&P 500 and the Bloomberg Magnificent 7 index are expected to balance better starting this quarter. Third-quarter Magnificent 7 earnings growth is forecast to slip from 50% in 2Q’24 to just 18% by 2Q’25, while S&P 500 earnings growth is expected to increase from 5.7% in 2Q’24 to 14.2% in 2Q’25.
Bloomberg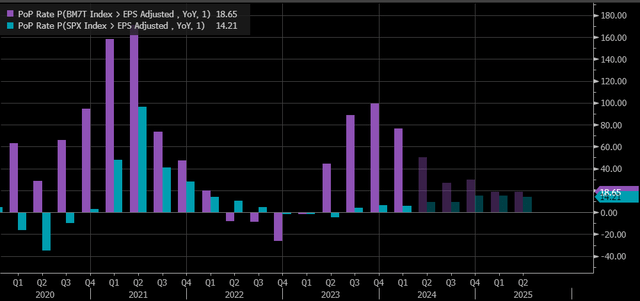
This means that investors have been paying a higher premium for higher growth rates, pushing PE and PS multiples higher. The question is whether investors will be as willing to pay those premiums as growth rates come down and even out.
Meanwhile, the group’s sales growth rates have already peaked and started to slow, peaking in the third quarter of 2023. They are expected to decrease incrementally every quarter until the end of 2025.
Bloomberg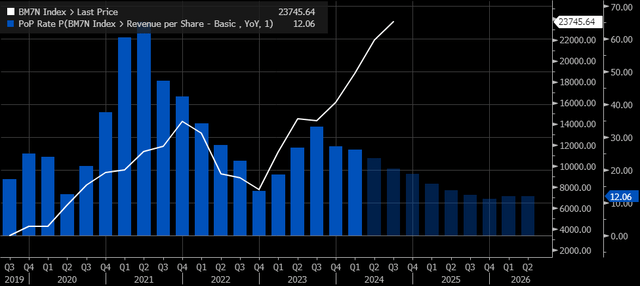
Overpaying For Growth
But what is more ironic is that the Magnificent 7’s 2024 revenue estimates have risen only 15% from their peak in March 2022, while the price-to-sales ratio has increased from a range of 6 to 6.5 times 2024 sales to about eight times sales. So investors today are willing to pay 23% more for these stocks when revenue is only 15% more than it was expected to be at this point two years ago.
Bloomberg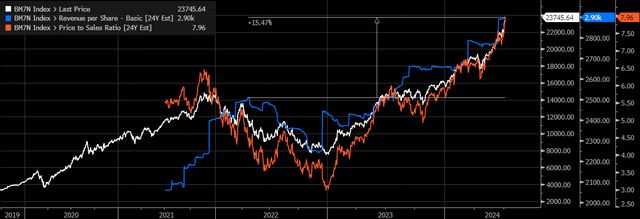
The story is not much different for 2025 sales estimates, with estimates just 17% higher than in April 2022. Meanwhile, the price-to-sales ratio has expanded to 7 times the 2025 estimate from around 4 to 4.5 times in 2022. So, in this case, investors are willing to pay 55% more than they were willing to pay in 2022 for just 17% more revenue growth than what had been priced in 2022.
Bloomberg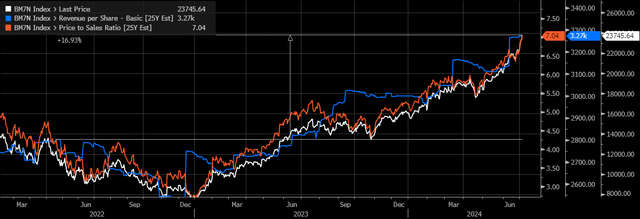
Low interest rates are certainly not the cause for this because the 10-year rate today is around 4.25% versus a rate of 1.75% in March of 2022. The only logical explanation is that this group offers more growth than the rest of the S&P 500. But again, just like in the earnings scenario, the revenue scenario is the same, with more balance coming from the overall index in future quarters.
Bloomberg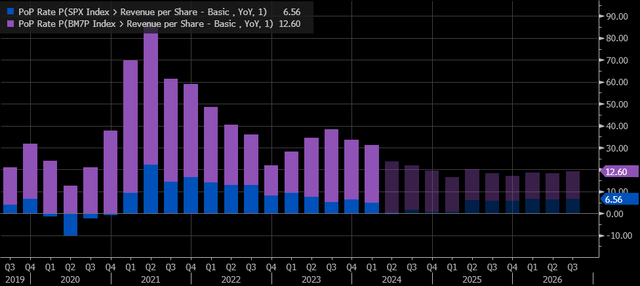
So, if it comes down to growth balancing out, then one needs to wonder if the multiples investors are currently paying will hold up, and the stock that is most vulnerable here is Nvidia because it accounts for so much of the gains in 2024 thus far. Also, at least over the last decade, in years when the Bloomberg 500 index was higher, no stock has accounted for more than 17.5% of the gains. This means that either Nvidia has a steep decline in front of it or the other stocks within the index have big gains in front of them.
The most ironic thing is that Nvidia could grow into a $200 billion revenue company someday yet still have a lower stock price. What ultimately matters for a stock beyond the actual results and growth rates is the perceptions surrounding those stocks and their growth rates. So if Nvidia is perceived to be at peak growth, and all future growth has been priced in. The price to sales multiple investors are willing to pay could decrease sharply. So even if revenue rises as expected, the stock may never see these lofty valuations again. Just ask Cisco, or better yet, Intel.

")


