 Q2 2024 Earnings Call Transcript")


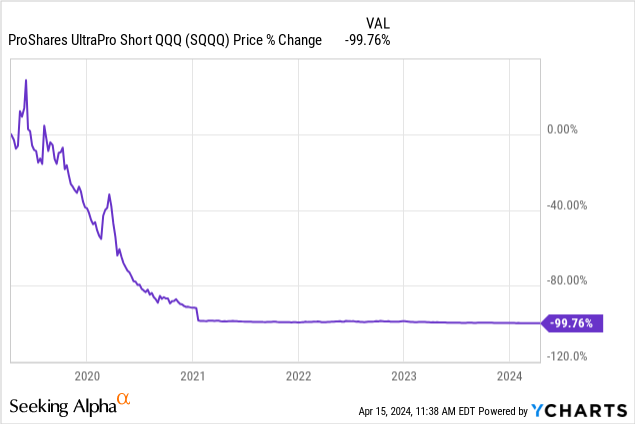
The UltraPro Short QQQ (NASDAQ:SQQQ) is an ETF that most investors write off as a speculative, ultra-short-term play due to its aggressive, 3x leveraged bet against tech and/or growth stocks. Not only that, but SQQQ has produced cumulative losses of 66% and more than 99% in the past one and five years, respectively (see chart below). Why bother owning a fund with such a dismal track record?
If used properly, however, I think that SQQQ can help even long-term investors to create a so-called “alpha overlay” play. I explain below how to assemble the portfolio and in what circumstances the strategy could pay off.
About the Nasdaq 100
The Nasdaq 100 (QQQ) is probably one of the three best-known stock indices in the US and possibly the world. While the S&P 500 (SPY) may be the standard in diversification for most equity investors in the country, QQQ stands out as a highly concentrated portfolio of mega-cap tech names disguised as a broad stock index.
About one-third of QQQ is currently allocated to only five stocks: Microsoft (MSFT), Apple (AAPL), NVIDIA (NVDA), Amazon (AMZN), and Meta Platforms (META) in quantities proportionate to their market cap size. Each of these stocks amounts to at least 5% of the portfolio but no more than 9%. Therefore, betting on or against the Nasdaq 100 effectively means having a bias (bullish or bearish) towards Big Tech.
About SQQQ
To own SQQQ means to be short the portfolio described in the section above. More specifically, it represents a leveraged bet that produces three times the inverse of the daily gains or losses generated by the Nasdaq 100.
Because the exposure resets daily, SQQQ should be expected to deliver its stated goal for a given day only. As gains or losses compound over time, the ETF’s longer-term performance (that is, the performance for any period other than a single day) will very likely be different from negative three times the return of the Nasdaq 100.
SQQQ “swims against the current” in two ways. First, it benefits from the decline in a beta-positive asset. In other words: because the Nasdaq 100 fundamentally has a positive return bias over the long run (i.e., a risk asset that is expected to produce positive cash flow should, in theory, produce gains), an inverse ETF on QQQ will naturally have a negative return bias. Second, SQQQ suffers from volatility drag which, very simply put, is the loss of value that is caused by exposure to high volatility.
SQQQ is often considered by many a day-trading instrument only. No wonder: the ETF trades 135 million shares per day on average, or about $1.5 billion for a fund whose NAV is only twice that much. However, I think that SQQQ could also be used strategically by longer-term investors.
For the sake of proof of concept only, assume a portfolio that allocates 75% to QQQ and 25% to SQQQ, rebalanced quarterly and held for over a decade. The chart below shows that this setup has produced something very close to zero return over time with fairly benign volatility, which is consistent with the idea of being both long and short the Nasdaq 100 by the same amount. In other words: yes, SQQQ can probably be used in pairs with other assets in long-short fashion to achieve a specific investment goal.
Portfolio Visualizer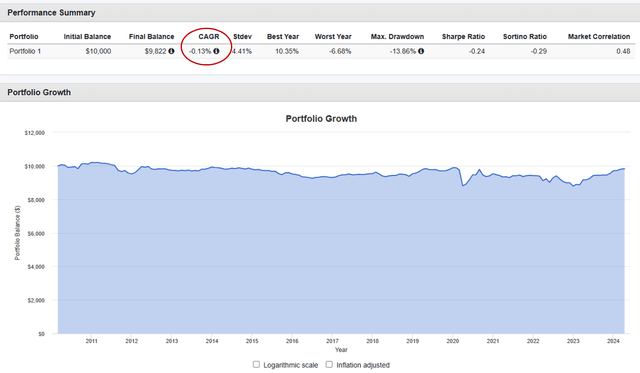
Setting up an alpha overlay using SQQQ
An alpha overlay is an approach in which investors can express a view (e.g., interest rates will rise, a recession will hit soon, energy stocks will underperform, etc.), usually without having to give up much or any exposure to beta – i.e., the S&P 500 (SPY) or treasuries (TLT). If, for example, someone believes that tech growth stocks will underperform another group of assets, he or she can hold some SQQQ and pair it with long exposure to another (possibly leveraged) ETF to express that view, while at the same time allocating most of the portfolio to SPY or TLT.
Think of the Russell 2000 small-cap index (IWM), for example. This is a group of stocks that can be seen as the antithesis of the Nasdaq 100: small cap vs. mega-cap, and value vs. growth. The value bias comes from the heavier exposure to the industrial and financial sectors, at an allocation of 18% and 16%, respectively. Compared to the tech space, these are thought to be a group of lower-growth cyclical stocks that carry much lower valuations.
Below is a depiction of how IWM has performed relative to QQQ since the start of the dot-com bubble burst – it is a long IWM, short QQQ hypothetical portfolio. The story goes as follows:
- As tech stocks fell off a cliff in 2000-2002, small-cap value lavishly outperformed through the end of the bubble burst period.
- Following the end of the 2001 recession through the beginning of the next (the Great Financial Crisis or GFC), the Russell 2000 continued to beat the Nasdaq 100, as one might expect to be the case during a period of economic recovery.
- The tides turned in 2008, when the tech growth factor benefited relative to small-cap value, both from the economic downcycle and the sharp decline in interest rates.
- Coming out of the GFC, a long, secular-like period of tech growth outperformance started. For the past 16 years, QQQ has topped the performance of IWM twelve times, including in 2024 YTD.
Portfolio Visualizer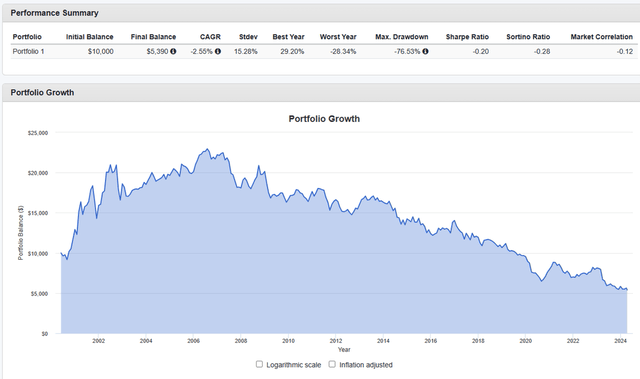
Small-cap and/or value investors have been puzzled for over a decade. How can the likes of Microsoft, Apple, and Amazon have done so well for so long relative to lower P/E stocks? With NVDA up 78% in 2024 alone and 1,800% in the past five years, couldn’t the Nasdaq 100 deflate catastrophically in the foreseeable future? And when will small cap and value finally have their run at outperforming the market?
Value investors looking to bet on mean reversion following over a decade of consistent outperformance by the Nasdaq 100 might choose to do the following:
- Allocate 70% to a plain S&P 500 ETF like SPY.
- Allocate 10% to the ProShares UltraPro S&P 500 (UPRO) for a 3x bet on the US stock index which, added to the first allocation above, adds up roughly to 100% exposure to the S&P 500 (the beta piece of the portfolio).
- Allocate 10% to SQQQ to express a bearish view on the Nasdaq 100.
- Allocate 10% to the Direxion Daily Small Cap Bull 3X Shares (TNA) which, paired with the allocation immediately above, creates the bullish small cap/value alpha overlay piece of the portfolio.
- Rebalance quarterly.
Historically, the portfolio above would have underperformed SPY, as the chart below illustrates (portfolio 2 in red is the plain S&P 500). However, keep in mind that the goal here would be to bet on an IWM vs. QQQ mean reversion in the future, and not to make a backtest “look good”.
Portfolio Visualizer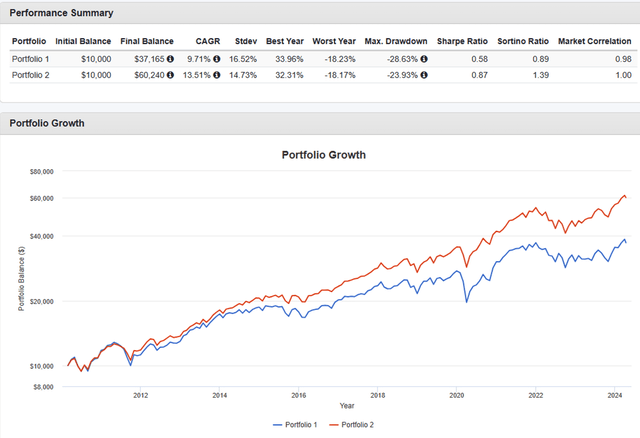
Risks to consider
The alpha overlay strategy above would be a good way, in my view, to take advantage of a potential mean reversion in the relationship between QQQ (tech growth) and IWM (small cap/value). However, I am a bit skeptical that the portfolio would have its best chance of thriving in the foreseeable future.
For small-cap and value to have a good shot at beating tech growth, either (1) a period of sustained economic growth would need to be in its early innings, and/or (2) interest rates would have to climb steadily from lower to higher levels. I don’t think that either is likely to happen soon.
On the former, I think that the recovery from the depths of the COVID-19 crisis provided the best environment for small-cap and value to thrive. They did, in fact, in late 2020 and Q1 of the following year, but the period of outperformance was very short-lived. Today, we are likely closer to the end of the current economic upcycle rather than at the start of the next leg up.
On the latter, I think that the cyclical pressure on interest rates at this point is lower, not higher. Even the Federal Reserve has hinted at rate cuts later in 2024 and 2025, with the only unanswered question being “by how much” and “how soon”. Worth noting, higher geopolitical uncertainty also tends to favor a flight to safety, which generally benefits tech growth while often pushing yields lower.
")

")


