






The high yield segment of the bond market walks on a tightrope between two simultaneously attractive and cautionary points: the first is the fact that yields can be attractive. The second is the premium they can provide over investment grade.
And it is here that State Street SPDR Portfolio High Yield Bond ETF fund (SPHY) reflects this strategic relevance: it is a high yield ETF that shows its competitiveness for two factors: costs (ER) and returns.
Let’s try to understand how SPHY fits into this trade off, and how it can standing out among other ETFs.
Intro
This is a passive ETF that began in 2012 using sampling replication rather than full replication of the ICE BofA US High Yield Index benchmark; an index that measures the performance of USD sub-investment grade corporate debt (“junk”).
SPHY – profile (Seeking Alpha)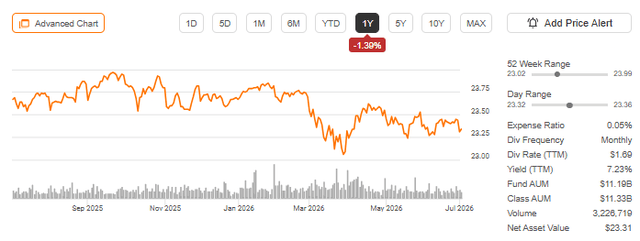
It offers an expense ratio of 0.05% to which today is added a 30-day median bid/ask spread of 0.04%; a distinctive and certainly cheap TER, considering that other HY ETFs from the same SPDR family cost around 0.4%, so SPHY is about 8 times cheaper than similar products from the same issuer. In fact it has had a good reception on the market gathering an AUM of about 11.08 billion dollars at the time of writing.
SPHY – yield (Seeking Alpha)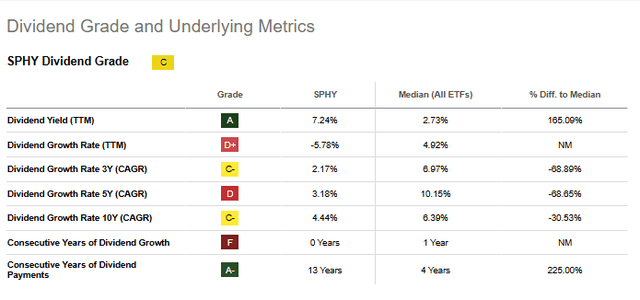
Exposure to this market today generates a 30 day SEC yield that oscillates between 6.99% and 7.10% with a monthly distribution frequency. Of course, this will change as interest rates and the various other factors in the bond space change.
What Does SPHY Do?
The objective declared by the prospectus is to provide investment results that, before fees and expenses. The return is generated by exposure to USD-denominated high yield debt mainly through carry, where nonetheless the 3-month carry remains low at ~1.80% while the 12-month carry is ~7%; from this it follows that the rolldown is minimal because the curve under 5 years is flat. In theory the steeper the curve is between two nearby maturities (that is, the wider the yield spread between, for example, a 5-year bond and a 4-year one), the greater the gain from rolldown. So it becomes a potentially growing instrument in terms of price when the curve steepens, not when it flattens or when it inverts.
Yield curve (ustreasuryyieldcurve.com)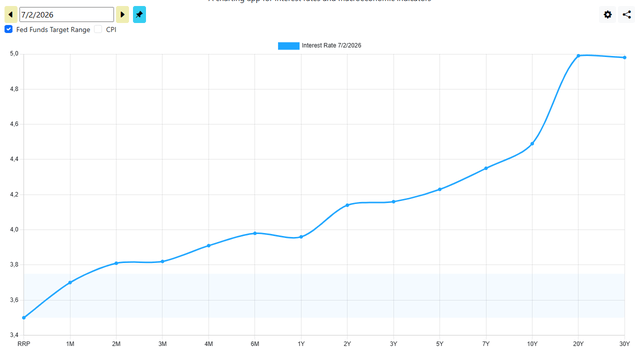
In any case duration is contained within the 2.7-2.9 year threshold, which makes it less sensitive to expectations of rate fluctuations, not something to be taken for granted considering the rate increase expectations shared by the Fed at the June meeting. Compared to the aggregate selection of IG debt, well represented in my opinion by the iShares Core US Aggregate Bond ETF (AGG), this is an advantage, considering that it has a duration of almost 6 years.
SPHY – AGG (Seeking Alpha)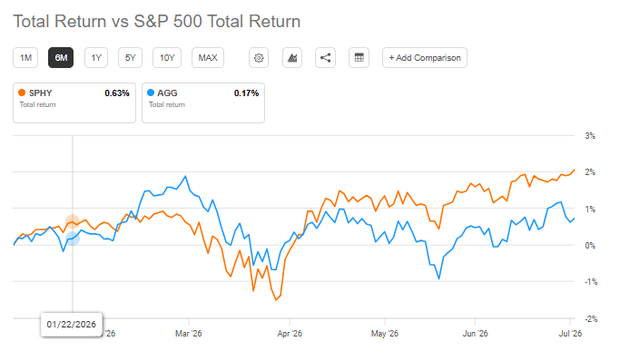
It naturally remains more sensitive to changes in credit spread. With an option adjusted duration OAD of 2.74 years, every 100 basis points (1%) of spread widening (OAS) produces a price loss of about 2.74%.
Who Is SPHY For?
It therefore presents itself as a solution for an investor looking for “carry adjusted for unit of duration” among HY funds. Naturally for those looking for a monthly cash flow from the US HY segment, still today with more competitive returns compared to IG, despite the spread being very compressed compared to the past average.
OAS (FRED)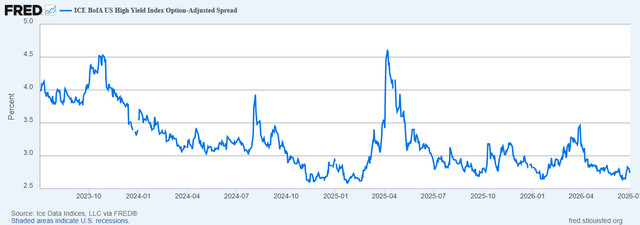
It nonetheless remains a competitive return on paper compared to aggregate solutions such as AGG; therefore a reference point for those seeking additional risk premium in the fixed income market.
SPHY – AGG: yield (Seeking Alpha)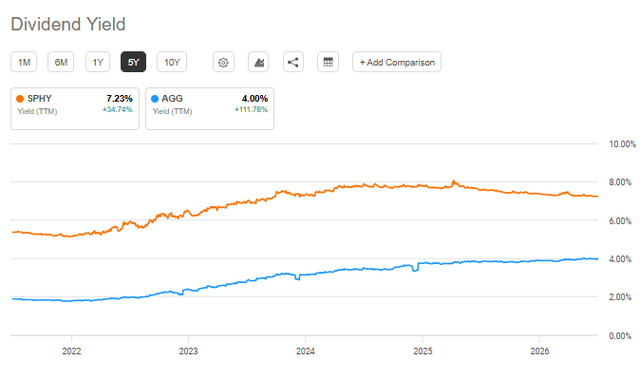
How Is SPHY Built?
Being sampling replication, the fund selects a subset of securities trying to maintain, in aggregate, the same risk/return characteristics of the index. Specifically it uses as a selection pool sub-investment grade rated securities based on the average of Moody’s, Fitch and S&P; at least 18 months to maturity at time of issuance, strictly USA, where no position should in theory exceed 0.45% of weight, although before rebalancing this can happen, then it does monthly rebalancing with a historical turnover of 52%.
SPHY – top 10 holdings (Seeking Alpha)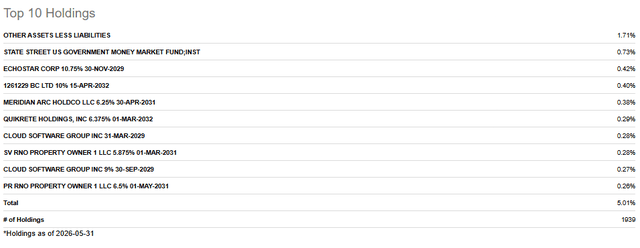
The fund has about 1904 holdings, where today the top 10 positions weigh overall only 4.02% of the fund with a credit rating/quality unbalanced toward BB or equivalent (above 55% on average) with a duration of around 2.8 years with an avg maturity of 4.62 years (60% of the fund is concentrated in the 3-7 year range across all sources).
At the sector distribution level, it remains unbalanced toward the consumer cyclical segment, today above 17%, followed by the communications sector at almost 15% and then energy at 11.35%; a composition that has remained fairly linear during the year, as can be seen from the info shared in previous research here on Seeking Alpha.
Risks
The risk that I personally prefer to put in the foreground is that of compression/repricing of the spread (OAS). In practical terms, as we like to reason, there would be a pure Effect on price ≈ − OAD × ΔOAS. Assuming an OAS in line with the historical average at +115 bpt, there would potentially be a price effect of about -3.15%. However this would be covered by a coupon, let’s assume in the low scenario at 7%. So a total return that is nonetheless positive. Isolating precisely the impact of the OAS, it would be at +240 bps of spread that would potentially zero out performance, I repeat … without considering other negative components (simply because for this OAD I think it is the biggest risk). Not by chance the std dev is 2.47 points, with an annualized volatility of less than 4%.
SPHY – Risk grade (Seeking Alpha)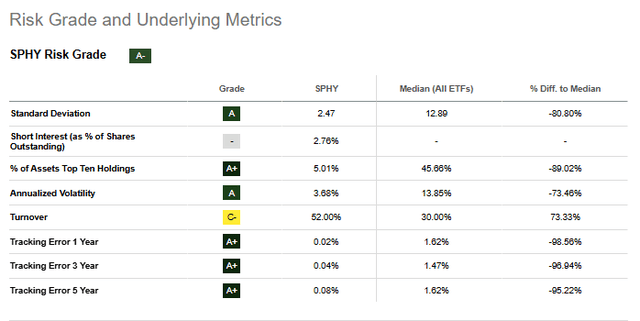
This scenario would materialize during an increase in credit/default risk, therefore significant GDP contractions that could bring about the expectation or concretely an increase in the default rate of BB and lower tranches. Depending on the depth of the contraction of expectations, the spread adjusts accordingly generating precisely the losses. Of course this is not the only risk. Although residual, spread changes on maturities also have an impact on expected return, and with a duration close to 3 years, partially even a rise in rates can cause negative price variations.
Peer Comparison
For an overall view of the matter, I introduce this peer table on the peers of the HY category.
SPHY – peer comparison (Seeking Alpha)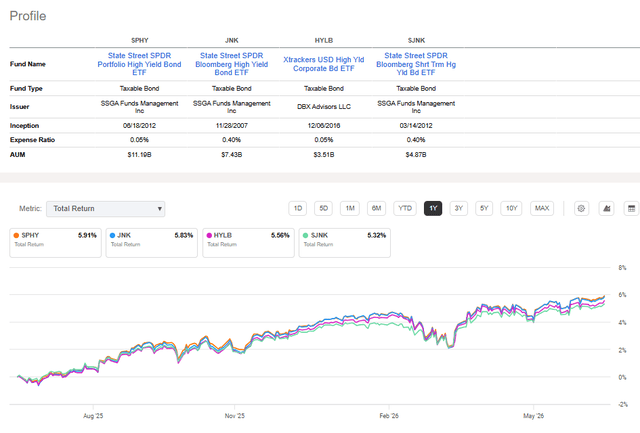
SPHY is the least costly and potentially among the most profitable, with a competitive yield, the highest in its category. In other words as of today the best carry adjusted for unit of duration. This of course could change over time.
SPHY – yield comparison (Seeking Alpha)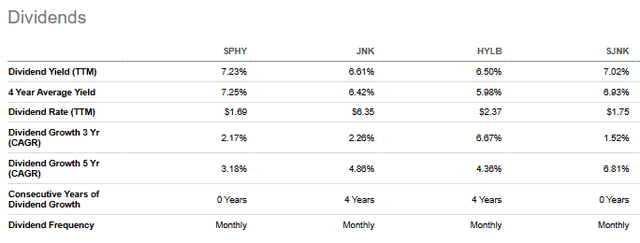
Then compared to the more classic and generic solutions like the iShares Broad USD High Yield Corporate Bond ETF (USHY) and the iShares iBoxx $ High Yield Corporate Bond ETF (HYG), the same considerations apply, although here SPHY is not the ETF with the highest AUM.
SPHY – comparison (Seeking Alpha)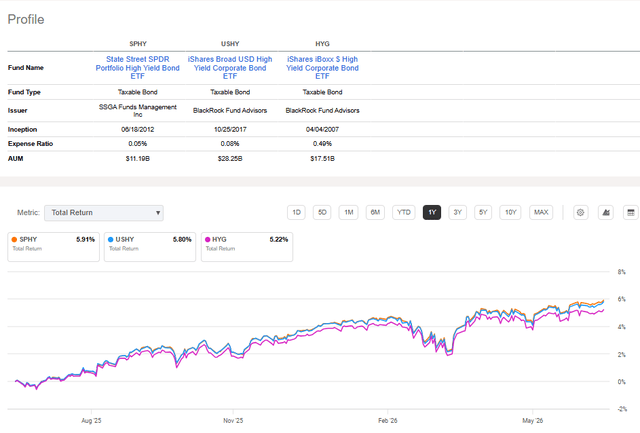
On an aggregate level, it nonetheless remains a competitive solution also in terms of number of holdings.
Usually having more holdings in a portfolio tends to dilute the fund’s returns compared to more selective competitors.
SPHY – comparison (Seeking Alpha)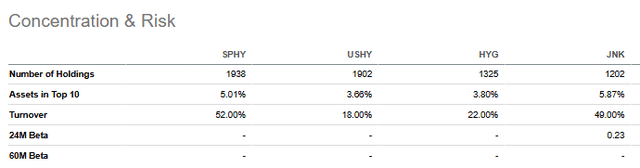
Pros and Cons
To conclude, it is clear that SPHY has fairly evident advantages:
- Firstly, extremely competitive TER: among the absolute lowest in the HY category
- Then, very wide bond-level diversification: 1,940+ positions
- And contained duration (2.7-2.9 years): it help to reduce interest rate sensitivity
- Competitiveness in yields and total returns compared to selected peers.
And naturally points of attention, which need to be dealt with:
- It is sensitive to changes in the OAS which today is below the historical average.
- It nonetheless has a high sector concentration: Consumer Cyclical (17-19%)
- Turnover that is nonetheless high for a passive fund (52% annual)
This article answers three main questions regarding SPHY:
- What kind of securities are in SPHY’s portfolio?
- What impacts SPHY’s performance?
- How can investors incorporate SPHY into their portfolios?
Editor’s note: This article is intended to provide a general overview of the ETF for educational purposes only and, unlike other articles on Seeking Alpha, does not offer an investment opinion about the ETF.