


")
Focus of Article:
The focus of this two-part article is to provide a very detailed analysis comparing Rithm Capital Corp. (NYSE:RITM) to 17 other mortgage real estate investment trust (mREIT) peers I currently fully cover. I am writing this two-part article due to the continued requests that such an analysis be specifically performed on RITM and some of the company’s mREIT peers at periodic intervals. For readers who just want the summarized conclusions/results, I would suggest scrolling down to the “Conclusions Drawn” section at the bottom of each part of the article.
PART 1 of this article analyzed RITM’s recent results and compared several of the company’s metrics to 17 mREIT peers. PART 1 also showed how RITM’s book value (“BV”) as of 12/31/2024 compared to the 17 other mREIT peers. PART 1 helps lead to a better understanding of the topics and analysis that will be discussed in PART 2.
The focus of PART 2 of this article is to compare RITM’s recent dividend per share rates, yield percentages, and several dividend sustainability metrics to 17 mREIT peers. This analysis will show recent past data with supporting documentation within Table 11 below. This article will also discuss RITM’s dividend sustainability, which is partially based on the metrics outlined in Table 11. A more in-depth analysis of RITM’s dividend sustainability will be provided in Table 12 below.
By analyzing these metrics, one will better understand which mREIT generally has a safer dividend rate going forward versus other peers who generally have a higher risk for a dividend decrease or a higher probability of a dividend increase and/or a special periodic dividend being declared. When both backtesting and projecting the metrics within this analysis, the results have continued to be proven extremely reliable. This is not the only data that should be examined to initiate a position within a particular stock/sector. However, I believe this analysis would be a good “starting-point” to begin a discussion on the topic. At the end of this article, there will be a conclusion regarding the following comparisons between RITM and the 17 mREIT peers: 1) trailing 12-month (“TTM”) yields based on a stock price as of 3/28/2025 (including 1- and 5-year dividend change); 2) annual forward yield based on a stock price as of 3/28/2025; and 3) annual forward yield based on my estimated CURRENT BV (BV as of 3/28/2025). I will also provide my current RITM BUY, SELL, or HOLD recommendation, price target, and dividend per share rate projection for Q2 2025 and Q3 2025.
Side Note: I believe there are several different classifications when it comes to mREIT companies. For purposes of this article series, I am focusing on 4. For readers who are new to my articles or for existing readers who need a “refresher” on several different mREIT classifications, please see PART 1 of this article.
Dividend Per Share Rates and Yield Percentages Analysis – Overview:
Let us start this analysis by getting accustomed to the information provided in Table 11 below. This will be beneficial when comparing RITM to the 17 mREIT peers within this analysis.
Table 11 – Dividend Per Share Rates and Yield Percentages
The REIT Forum
(Source: Table created by me, obtaining historical stock prices from NASDAQ and each company’s dividend per share rates from the SEC’s EDGAR Database)
Using Table 11 above as a reference, the following information is provided (see each corresponding column): 1) dividend per-share rate for Q4 2024 (for monthly dividend payers, the total monthly dividends during the quarter); 2) core earnings (or core earnings equivalent) for Q4 2024; 3) stock price as of 12/27/2024; 4) TTM dividend yield (dividend per share rate from Q1 2024 – Q4 2024); 5) annual forward dividend yield based on the dividend per share rate for Q4 2024 using the stock price as of 12/27/2024 (for monthly dividend payers, the latest monthly dividend per share rate during the quarter); 6) annual forward dividend yield based on the dividend per share rate for Q4 2024 using a BV as of 12/31/2024 (for monthly dividend payers, the latest monthly dividend per share rate during the quarter); 7) dividend per share rate for Q1 2025 (for monthly dividend payers, the total monthly dividends during the quarter); 8) stock price as of 3/28/2025; 9) TTM dividend yield (dividend per share rate from Q2 2024 – Q1 2025); 10) annual forward dividend yield based on the dividend per share rate for Q1 2025 using the stock price as of 3/28/2025 (for monthly dividend payers, the latest monthly dividend per share rate during the quarter); 11) annual forward dividend yield based on the dividend per share rate for Q1 2025 using estimated CURRENT BV (BV as of 3/28/2025) (for monthly dividend payers, the latest monthly dividend per share rate during the quarter); 12) dividend per share rate for Q1 2025 versus the Q1 2024 (percentage fluctuation); and 13) dividend per share rate for Q1 2025 versus Q1 2021 (percentage fluctuation; shows post-COVID-19 and interest rate/yield impact to each company’s dividend).
As of 3/28/2025, ARMOUR Residential REIT, Inc. (ARR) and Dynex Capital, Inc. (DX) had a stock price that “reset” lower regarding each company’s March 2025/Q1 2025 dividend accrual. In other words, each company’s “ex-dividend date” had already occurred.
As of 3/28/2025, RITM, AGNC Investment Corp. (AGNC), Cherry Hill Mortgage Investment Corporation (CHMI), Annaly Capital Management, Inc. (NLY), Orchid Island Capital, Inc. (ORC), Two Harbors Investment Corp. (TWO), Chimera Investment Corporation (CIM), Ellington Financial Inc. (EFC), MFA Financial, Inc. (MFA), AG Mortgage Investment Trust, Inc. (MITT), New York Mortgage Trust, Inc. (NYMT), Ready Capital Corporation (RC), PennyMac Mortgage Investment Trust (PMT), Blackstone Mortgage Trust, Inc. (BXMT), Franklin BSP Realty Trust, Inc. (FBRT), and Granite Point Mortgage Trust Inc. (GPMT) had a stock price that had not reset lower in reference to the company’s March 2025/Q1 2025 dividend accrual. Readers should take these points into consideration as the analysis is presented below. Let us now begin the comparative analysis between RITM and the 17 mREIT peers.
Analysis of RITM:
Looking back at RITM’s dividend history over the past 10 years, the company increased its dividend from $0.35 per common share during Q3 2014 to $0.50 per common share by Q4 2019. This consisted of gradual dividend increases over the span of approximately 5 years. However, along with a majority of sector peers, RITM cautiously reduced the company’s quarterly dividend to just $0.05 per common share during Q1 2020 as a direct result of fear surrounding the COVID-19 “pandemic panic”. During this timeframe, prior to the Federal (“Fed”) Reserve’s quick, decisive action to calm markets through both interest rate and monetary policy, repurchase (“repo”) agreement and hedging counterparties quickly (and incorrectly in my opinion) initiated margins calls on most sector peers which created a “snowball” effect on this specific market. This included both agency and non-agency mortgage-related investments.
In other words, there was a quick, sharp leverage/liquidity crisis across certain pockets of credit markets where certain assets/investments are used as collateral regarding underlying outstanding borrowings/debt. Most sector peers either voluntarily, or were forced, to deleverage and raise cash during this time period. Results varied greatly from peer-to-peer regarding the severity of each company’s investment portfolio decrease and dividend reduction. In fact, several broader sector peers suspended dividends for several quarters out of an abundance of caution. Remember, at the time, an enormous amount of fear/speculation/uncertainty surrounded markets regarding future economic performance. Regarding RITM, this mainly pertained to residential housing issues; largely potential strains on mortgage servicer’s from the potential “influx” of missed mortgage payments and a servicer’s responsibility to “front” principal and interest payments to investors (who are then reimbursed by government-sponsored enterprises [GSEs] regarding agency MSRs).
However, as fear/caution quickly subsided, RITM increased the company’s dividend to $0.10, $0.15, and $0.20 per common share during Q2, Q3, and Q4 2020, respectively. RITM subsequently increased the company’s dividend to $0.25 per common share during Q3 2021, which has remained constant since. I would remind readers that while many sector peers have reduced dividends over the past 3 years, RITM has been one of the rare exceptions to this trend (especially when compared to a majority of agency, hybrid, and commercial whole loan mREIT sub-sectors).
Using Table 11 above as a reference, RITM declared a dividend of $0.25 per common share for Q4 2024. This was an unchanged dividend when compared to the prior quarter. RITM’s stock price traded at $10.92 per share on 12/27/2024. When calculated, this was a TTM dividend yield of 9.16%, an annual forward yield to RITM’s stock price as of 12/27/2024 of 9.16%, and an annual forward yield to the company’s BV as of 12/31/2024 of 7.96%. When comparing each yield percentage to RITM’s originator + servicer mREIT peer within this analysis, the company’s TTM dividend yield percentage, annual forward yield percentage based on its stock price as of 12/27/2024, and its annual forward yield percentage based on its BV as of 12/31/2024 were modestly (at or above 1.00% but less than 2.00%) below average.
As was discussed in PART 1 of this article, RITM’s at-risk leverage ratio (on- and off-balance sheet) was lower when compared to the company’s lone sub-sector peer within this analysis, PMT. Historically speaking, RITM has typically run lower leverage versus PMT. From charting past trends, typically a lower leverage ratio has equated to below-average dividend yield percentages. Of course, there are various other factors at play regarding dividend sustainability (especially during events surrounding the COVID-19 pandemic panic back in March 2020). However, a company’s leverage ratio is one “general” metric which, I believe, should be analyzed.
I continue to believe an important metric to analyze when assessing RITM’s near-term dividend sustainability is the company’s quarterly core earnings (and adjusted core earnings when applicable). RITM’s earnings available for distribution (“EAD”) is now the equivalent to the company’s previously disclosed core earnings. As such, the terms are interchangeable within this article. Currently, RITM’s core earnings/EAD is the closest metric to the company’s “true earnings power” regarding its investment portfolio’s performance. To explain/discuss this metric, Table 12 is provided below.
Table 12 – RITM Quarterly Core Earnings/EAD Analysis (Q1 2023 – Q4 2024)
The REIT Forum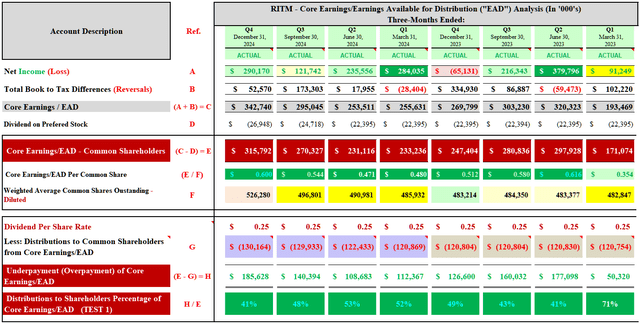
(Source: Table created by me, partially using data obtained from RITM’s quarterly shareholder presentation for Q1 2023 – Q4 2024)
Using Table 12 above as a reference, RITM reported core earnings/EAD available to common shareholders of $171.1, $297.9, $280.8, and $247.4 million for Q1, Q2, Q3, and Q4 2023, respectively (see red reference “E”). When calculated, RITM had core earnings/EAD available to common shareholders of $0.35, $0.62, $0.58, and $0.51 per share, respectively (see red reference “E / F”). These figures were notably above the company’s dividend of $0.25 per common share for Q1 – Q4 2023. This calculates to a quarterly dividend distribution payout ratio of 71%, 41%, 43%, and 49% for Q1, Q2, Q3, and Q4 2023, respectively (see red reference “H / E”). Simply put, a very attractive quarterly dividend distribution payout ratio throughout 2023; even after a dividend increase of $0.05 per common share during Q3 2021. This even includes the fact that short-term rates/borrowing costs rapidly increased during 2022.
Moving to 2024, RITM reported quarterly core earnings/EAD available to common shareholders of $233.2, $231.1, $270.3, and $315.8 million for Q1, Q2, Q3, and Q4 2024, respectively. When calculated, RITM had core earnings/EAD available to common shareholders of $0.48, $0.47, $0.54, and $0.60 per share, respectively. This calculates to a quarterly dividend distribution payout ratio of 52%, 53%, 48%, and 41% for Q1, Q2, Q3, and Q4 2024, respectively. Simply put, a continued very attractive quarterly dividend distribution payout ratio throughout 2024. A VERY consistent theme for RITM which has been a rare occurrence regarding the broader mREIT sector.
However, to remain unbiased, when excluding a one-time benefit of $0.08, $0.07, $0.09, and $0.11 per common share in direct relation to the sale of excess MSRs (and other related sales) during Q2 2024, Q3 2024, and Q4 2024, RITM reported adjusted core earnings/EAD of $0.40, $0.40, $0.45, and $0.49 per common share, respectively. Still, this calculates to a quarterly dividend distribution payout ratio of 62%, 62%, 58%, and 50%, respectively.
Repo agreement financing rates have very likely peaked in late 2023. Borrowing/Financing rates outside repo agreements have very likely have peaked in early 2024. Net interest spreads across the broader sector have likely “bottomed out” in late 2023 – early 2024. A slow, gradual increase in net spreads began during 2024 which should continue during 2025 (likely will fade some by year-end). This also considers the derivatives side of the equation.
It should also be noted 100% of RITM’s 2023 and 2024 dividends were classified as “ordinary income”. In other words, 0% of RITM’s 2023 and 2024 dividends were classified as a “return of capital” (“ROC”) distribution. I expect similar tax treatment regarding RITM’s 2025 dividends. This should be considered a positive catalyst/trend.
Once again, using Table 11 as a reference, RITM declared a dividend of $0.25 per share for Q1 2025. This was an unchanged dividend when compared to the prior quarter. RITM’s stock price traded at $11.39 per share on 3/28/2025. When calculated, this was a TTM dividend yield of 8.78%, an annual forward yield to RITM’s stock price as of 3/28/2025 of 8.78%, and an annual forward yield to the company’s estimated CURRENT BV of 8.00%. When comparing each yield percentage to PMT, the company’s TTM dividend yield percentage, annual forward yield percentage based on its stock price as of 12/27/2024, and its annual forward yield percentage based on its BV as of 12/31/2024 were now notably (at or above 2.00%) below average. Going forward, I believe RITM should have an annual forward yield near the originator + servicer mREIT average. As such, RITM continues to have a notable “cushion” regarding future dividend sustainability; even if there is a modest decrease to the company’s core earnings/EAD during 2025.
A Couple of Comparisons Between RITM and the Company’s 17 mREIT Peers in Ranking Order:
Investing Group Feature
Conclusions Drawn (PART 2):
PART 2 of this article compared RITM to 17 mREIT peers in regard to recent dividend per share rates, yield percentages, and several other dividend sustainability metrics. This article also discussed RITM’s past dividend trends/history. Using Table 11 as a reference, the following were the recent dividend per share rate and yield percentages for RITM:
RITM: $0.25 per common share dividend for Q1 2025; 8.78% TTM dividend yield; 8.78% annual forward yield to the company’s stock price as of 3/28/2025; and 8.00% annual forward yield to my projected CURRENT BV.
When combining this data along with metrics within Table 12 (core earnings/EAD) and other modeling sources, the following probability regarding RITM’s near-term dividend sustainability is provided:
RITM: Very High (90%) probability of $0.25 – $0.30 per common share dividend for Q2 2025
RITM: Very High (90%) probability of $0.25 – $0.30 per common share dividend for Q3 2025
Q1 2025 Projected ADJUSTED Core Earnings/EAD: $0.430 – $0.480 per common share
Preliminary Q2 2025 Projected ADJUSTED Core Earnings/EAD: $0.435 – $0.475 per common share*
* = Assuming a RITM spin-off does NOT occur prior to the end of Q2 2025
As explained in PART 1 of this article, RITM’s portfolio composition, leverage, borrowing costs, hedging coverage ratio (risk management strategy), prepayment speeds, and management fees also need to be considered when discussing the company’s core earnings/EAD.
While I believe RITM’s core earnings/EAD will remain relatively unchanged as short-term funding costs remain elevated (though will gradually net decrease during 2025) and MSR prepayment speeds will fluctuate, as evidenced in Table 12 this mREIT has a very large “cushion” regarding dividend sustainability.
18 mREIT Dividend Projections for Q2 2025:
Investing Group Feature
My BUY, SELL, or HOLD Recommendation:
From the analysis provided above, including additional catalysts/factors not discussed within this article, I currently rate RITM as a SELL when I believe the company’s stock price is trading at or greater than a 5% premium to my projected CURRENT BV (BV as of 3/28/2025; $12.50 per share), a HOLD when trading at less than a 5% premium through less than a (7.5%) discount to my projected CURRENT BV, and a BUY when trading at or greater than a (7.5%) discount to my projected CURRENT BV.
Therefore, with a closing stock price of $11.39 per common share as of 3/28/2025, I currently rate RITM as UNDERVALUED from a stock price perspective.
As such, I currently believe RITM is a BUY recommendation (but fairly close to a HOLD recommendation).
I/we had a NOTABLY UNDERVALUED classification (STRONG BUY recommendation) on RITM (and most of the broader mREIT sector) in early 2023 which quickly “paid off” to readers/subscribers who deeded our advice. To remain unbiased (since I continue to own the stock), RITM is currently not as great of a value versus early 2023. Still, I believe it is a decent valuation.
My current price target for RITM is approximately $13.15 per common share. This is currently the price where my recommendation would change to OVERVALUED/a SELL recommendation. The current price where my classification/recommendation would change to APPROPRIATELY VALUED/a HOLD recommendation is approximately $11.55 per common share. Put another way, the following are my CURRENT BUY, SELL, or HOLD per share recommendation ranges (our Investing Group subscribers get this type of data on all 18 mREIT (and 12 business development company (“BDC”)) stocks I currently cover on a weekly basis):
$13.15 per share or above = SELL
$11.56 – $13.14 per share = HOLD
$10.01 – $11.55 per share = BUY
$10.00 per share or below = STRONG BUY
Along with the data presented within this article, this recommendation considers the following mREIT catalysts/factors: 1) projected future MBS/investment price movements; 2) projected future derivative valuations; and 3) projected near-term (up to 1-year) dividend per share rates. This includes all recent, current, and projected macroeconomic indicators and FOMC monetary policy. This also considers the potential RITM future spin-off of the company’s origination/servicing/mortgage operations.
My Personal RITM Past + Current Stock Disclosures:
The following are my RITM (formerly NRZ) past and current stock disclosures and total returns since I have been writing on Seeking Alpha (since 2013):
Table 16 – RITM Past + Current Stock Disclosures/Returns
The REIT Forum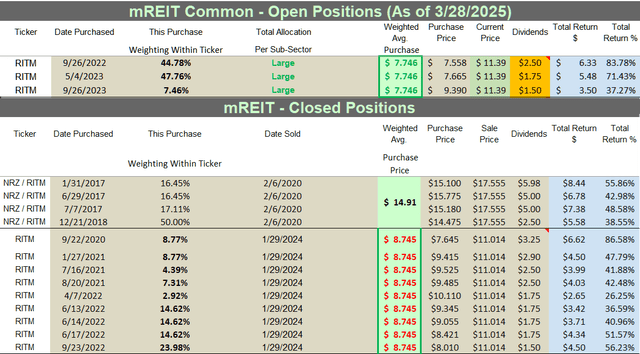
Final Note: All trades/investments I have performed over the past 8+ years have been disclosed to readers in “real time” (that day at the latest) via Seeking Alpha and, more recently, the “live chat” feature of our Investing Group (which cannot be changed/altered). Beginning in January 2020, I transitioned all my real-time purchase and sale disclosures solely to subscribers of the REIT Forum. All applicable public articles will still have my “main ticker” purchase and sale disclosures (just not real-time alerts). At the end of February 2025, I had an unrealized/realized gain “success rate” of 90.9% and a total return (includes dividends received) success rate of 96.1% out of 77 total past and present mREIT and BDC positions (updated monthly; multiple purchases/sales in one stock count as one overall position until fully closed out). I encourage other Seeking Alpha contributors to provide real-time buy and sell updates for their readers/subscribers, which would ultimately lead to greater transparency/credibility.
Simply put, a contributor’s/team’s recommendation track record should “count for something” and should always be considered when it comes to credibility/successful investing.
Understanding My/Our Valuation Methodology Regarding mREIT Common and BDC Stocks:
The basic “premise” around my/our recommendations in the mREIT common and BDC sectors is value. Regarding operational performance over the long term, there are above average, average, and below average mREIT and BDC stocks. That said, better-performing mREIT and BDC peers can be expensive to own, as well as being cheap. Just because a well-performing stock outperforms the company’s sector peers over the long-term, this does not mean this stock should be owned at any price. As with any stock, there is a price range where the valuation is cheap, a price where the valuation is expensive, and a price where the valuation is appropriate. The same holds true with all mREIT common and BDC peers. As such, regarding my/our investing methodology, each mREIT common and BDC peer has their own unique BUY, SELL, or HOLD recommendation range (relative to estimated CURRENT BV/NAV). The better-performing mREITs and BDCs typically have a recommendation range at a premium to BV/NAV (varying percentages based on overall outperformance) and vice versa with the average/underperforming mREITs and BDCs (typically at a discount to estimated CURRENT BV/NAV).
Each company’s recommendation range is “pegged” to estimated CURRENT BV/NAV because this way subscribers/readers can track when each mREIT and BDC peer moves within the assigned recommendation ranges (daily if desired). That said, the underlying reasoning why I place each mREIT and BDC recommendation range at a different premium or (discount) to estimated CURRENT BV/NAV is based on roughly 15-20 catalysts which include both macroeconomic catalysts/factors and company-specific catalysts/factors (both positive and negative). This investing strategy is not for all market participants. For instance, not likely a “good fit” for extremely passive investors. For example, investors holding a position in a particular stock, no matter the price, for say a period of 5+ years. However, as shown throughout my articles written here at Seeking Alpha since 2013, in the vast majority of instances I have been able to enhance my personal total returns and/or minimize my personal total losses from specifically implementing this particular investing valuation methodology. I hope this provides some added clarity/understanding for new subscribers/readers regarding my valuation methodology utilized in the mREIT common and BDC sectors.
Each investor’s BUY, SELL, or HOLD decision is based on one’s risk tolerance, time horizon, and dividend income goals. My personal recommendation will not fit each reader’s current investing strategy. The factual information provided within this article is intended to help assist readers when it comes to investing strategies/decisions. Please disregard any minor “cosmetic” typos if/when applicable.
Build a foundation for steady income with REITs
As demand for key real estate sectors increases and supply fails to keep pace, 2025 presents a prime opportunity to invest in REITs, Preferreds, and BDCs.
The REIT Forum offers a proven, transparent approach with actionable insights. Subscribers receive precise trade alerts, portfolio tracking, and exclusive articles. Strategies from The REIT Forum have consistently outperformed sector indexes for nearly a decade.
Start your risk-free two-week trial today and capitalize on the power of real estate returns.


 Q4 2024 Earnings Call Transcript")


