


")
Investment Thesis: I revise my rating on Ralph Lauren from Buy to Hold.
In a previous article back in August, I made the argument that Ralph Lauren (NYSE:RL) has the capacity to see further upside going forward, on the basis of strong Europe and Asia performance, as well as a strong balance sheet and an attractive P/E ratio.
Since then, the stock has seen substantial growth – up by over 45% since my last article.
TradingView.com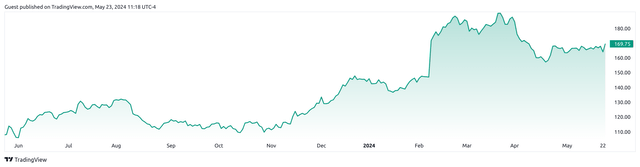
With that being said, we also see that at a price of $169.75 at the time of writing – the stock has also descended from the high of over $190 that we saw in mid-March.
The purpose of this article is to assess whether Ralph Lauren has the capacity to see upside back to the $190 mark – taking recent performance into consideration.
Performance
When looking at fourth quarter and fiscal full year 2024 results for Ralph Lauren (as released May 23, 2024), we can see that net revenues were up slightly by 1.7% as compared to the prior year quarter.
RL-2024.03.30 – Ex 99.1 – Press Release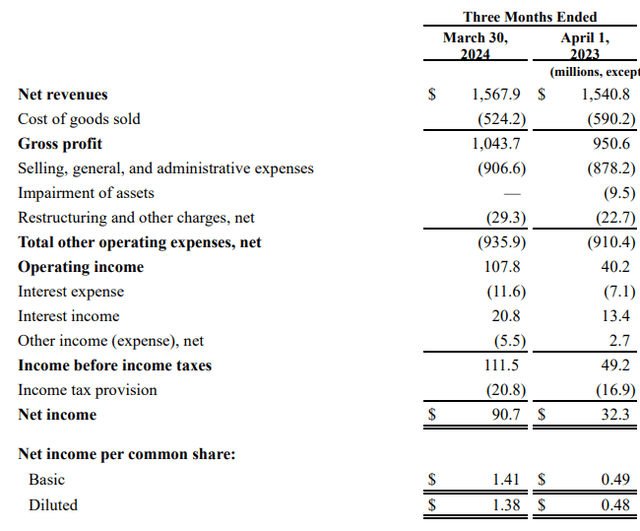
Such revenue growth came in below expectations in part due to subdued demand across the U.S. market.
With that being said, we can see that net income was up significantly from $32.3 million to over $90.7 million – with the main driver of this being a significant reduction in the cost of goods sold from $590.2 million to $524.2 million over the same period.
However, both revenues and net income are substantially lower than that of Q3 2024, which came in at $1.934 billion and $276.6 million respectively – reflecting a significant dip in sales following the holiday season.
I had previously made the argument that as compared to Europe and Asia – North America had been seeing a decline in revenue over the past five years. While North American revenue on a twelve month ended basis was down from $3.02 billion to $2.95 billion, we see that growth across this region had outpaced that of Europe and Asia as compared to the prior year quarter.
| Apr 1, 2023 | Mar 30, 2024 | Growth (%) | |
| North America | 655.6 | 667.7 | 1.85% |
| Europe | 460.8 | 469.2 | 1.82% |
| Asia | 390 | 394.3 | 1.10% |
| Other non-reportable segments | 34.4 | 36.7 | 6.69% |
| Total net revenues | 1540.8 | 1567.9 | 1.76% |
Source: Figures sourced from Ralph Lauren Fourth Quarter And Full Year Fiscal 2024 Results. Growth percentages calculated by author.
It is also notable that when compared to Q3 2024, revenues across geography have also seen a significant decline – once again owing to lower demand following the holiday season.
Ralph Lauren Q3 2024 Results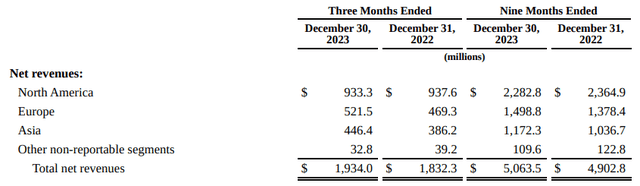
From a balance sheet standpoint, we can see that Ralph Lauren’s quick ratio (calculated as total current assets less inventories and prepaid expenses all over total current liabilities) has risen to 1.56 from 1.38 in the prior year quarter. A quick ratio above 1 indicates that the company has the capacity to meet its current liabilities using its existing liquid assets.
| Apr 1, 2023 | Mar 30, 2024 | |
| Total current assets | 3324.1 | 3359.8 |
| Prepaid expenses and other current assets | 188.7 | 171.9 |
| Inventories | 1071.3 | 902.2 |
| Total current liabilities | 1493.5 | 1467.2 |
| Quick ratio | 1.38 | 1.56 |
Source: Figures sourced from Ralph Lauren Fourth Quarter And Full Year Fiscal 2024 Results. Quick ratio calculated by author.
From a longer-term standpoint, we can see that the long-term debt to total assets ratio has remained at virtually the same level as compared to the prior year quarter.
| Apr 1, 2023 | Mar 30, 2024 | |
| Long-term debt | 1138.5 | 1140.5 |
| Total assets | 6789.5 | 6602.6 |
| Long-term debt to total assets ratio | 16.77% | 17.27% |
Source: Figures sourced from Ralph Lauren Fourth Quarter And Full Year Fiscal 2024 Results. Long-term debt to total assets ratio calculated by author.
Overall, we see that revenues showed modest growth in the most recent quarter, but a reduction in cost of goods sold resulted in a significant boost to earnings.
Looking Forward and Risks
In terms of prospects for Ralph Lauren going forward, we have seen that while earnings and operating margin has seen significant growth – this has been primarily due to a decrease in costs whereas revenue growth has remained modest. Over the longer-term, revenue needs to see further growth to ultimately bolster earnings, as cost reduction can only achieve so much in this regard.
Ultimately, performance across the North American market needs to improve in order to facilitate this. When looking at comparable store sales data, it is notable that while Europe and Asia saw double-digit growth in digital commerce, North America saw a decline of 4%. Moreover, while brick and mortar sales were up by 6%, this was significantly less than Europe with growth of 13%.
RL-2024.03.30 – Ex 99.1 – Press Release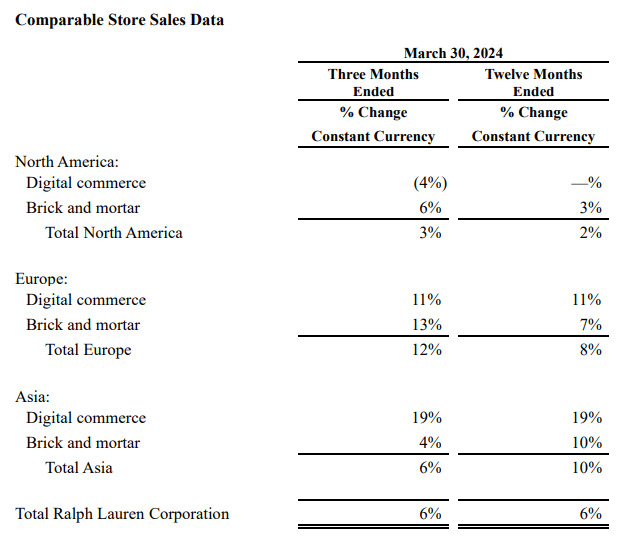
Moreover, we can see that while the North American market saw growth in digital commerce for Q2 and Q3 of this year, this subsequently reversed in the most recent quarter and we saw a further drop in growth as compared to the prior year quarter.
Heatmap generated by author – figures sourced from historical Ralph Lauren quarterly reports.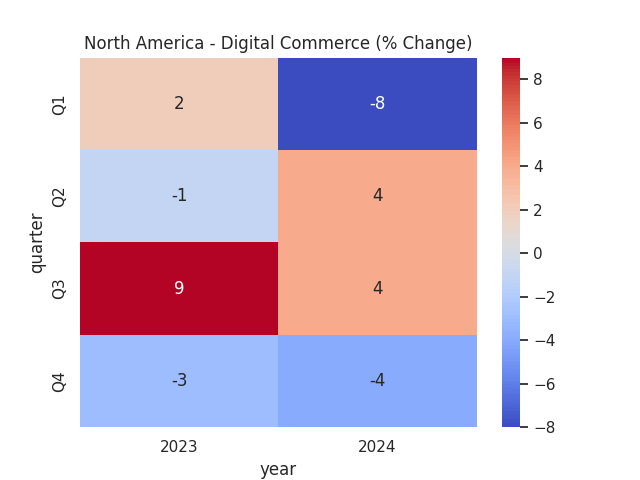
Back in September 2023, Ralph Lauren had expanded on its North American digital strategy by launching an e-commerce platform in Canada (as well as a luxury brick and mortar store). DTC (or direct-to-consumer) sales are reportedly worth 64% of total revenue for Ralph Lauren, and for the company as a whole – AUR (or average unit retail) saw growth of 13% across the direct-to-consumer network for the fourth quarter. For the 2023 fiscal year, the company added 5 million new DTC customers.
While the contribution of digital commerce versus brick and mortar to overall revenue is unclear, we see that for North America – growth of 6% across brick and mortar sales have outpaced the decline in 4% across digital commerce.
With the company set to add more stores in Canada to increase its North American foothold – I take the view that Ralph Lauren has the capacity to grow revenue across North America by maintaining a focus on brick and mortar expansion, but will be looking at whether digital commerce growth can see a rebound in the next quarter.
Moreover, we can see that while earnings per share for Ralph Lauren has been rising, the P/E ratio has also seen an increase. Moreover, while Ralph Lauren previously traded at the lowest P/E ratio among its peers, it now trades at the highest.
P/E Ratio
ycharts.com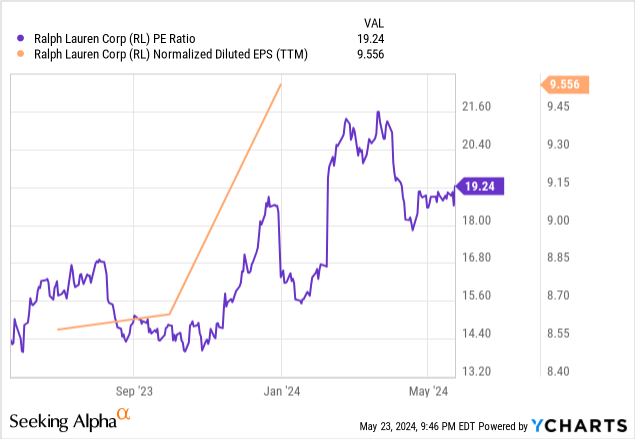
P/E Ratio comparison
ycharts.com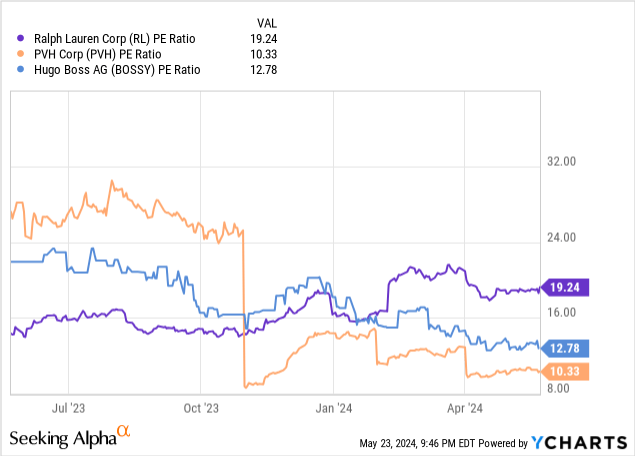
In this regard, I take the view that Ralph Lauren is likely to continue trading near the current level in the short to medium-term, and upside to $190 is not likely unless we see a significant improvement in revenue growth.
Conclusion
To conclude, while Ralph Lauren has seen impressive earnings growth – revenue growth remains modest and North American performance in particular has significant room for improvement. For this reason, I revise my rating on Ralph Lauren from Buy to Hold.


 Q2 2024 Earnings Call Transcript")


