

")


Investment Thesis
On January 14, 2024, I recommended readers avoid the Invesco Dynamic Food & Beverage ETF (NYSEARCA:PBJ) due to severe valuation problems. Although its selections offered more growth potential than those in the Consumer Staples Select Sector ETF (XLP), they were more volatile and of lesser quality, and this thesis has played out nicely over the last five months. Since that article was published, PBJ has lagged behind XLP, the Vanguard Consumer Staples ETF (VDC), and the Fidelity MSCI Consumer Staples ETF (FSTA) by 7-8%.
Seeking Alpha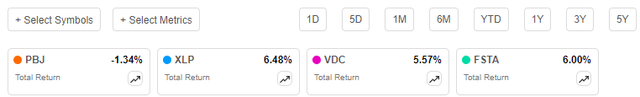
Today’s article re-evaluates PBJ’s prospects by considering these relatively poor returns and the latest quarterly reconstitution. I expect a better value opportunity, but I will use various fundamental metrics to determine if it’s worth the risk over low-cost, plain vanilla Consumer Staples sector ETFs. I hope you enjoy the analysis.
PBJ Overview
Strategy Discussion and Performance
PBJ tracks the Dynamic Food & Beverage Intellidex Index, selecting 30 U.S. food and beverage securities based on fundamental and technical factors like price momentum, earnings momentum, quality, management action, and value. Within these categories are sub-factors like return on assets, valuation ratios, and analyst estimate changes, so the expectation is that PBJ will look reasonably well on paper. I’ve found this often to be the case, but investors must know the model does not emphasize the quality factor. To illustrate, PBJ’s constituents’ weighted average return on assets is 7.60% compared to 9.75% for XLP. I’d expect that figure to be better, considering it’s one of the metrics named in the selection process.
According to the methodology document, the Index rebalances quarterly at the end of February, May, August, and November. Each security receives a proprietary “model score,” and the Index includes those with the highest scores within each sector and market capitalization group. Based on my review of the holdings, larger companies receive a higher weight than smaller companies. This is why the top ten holdings average $65 billion in market cap compared to $6.5 billion for the bottom ten holdings.
Finally, I believe PBJ’s 0.57% expense ratio is excessive. XLP, VDC, and FSTA have expense ratios between 0.08% and 0.10%, and even the multi-sector iShares US Consumer Staples ETF (IYK) does slightly better on fees with a 0.40% expense ratio.
Seeking Alpha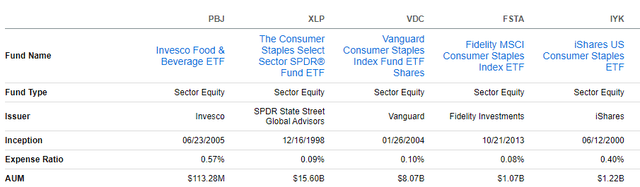
PBJ’s expense ratio and choppy performance track record likely contribute to its low $113.28 million in assets under management. Its three-year rolling returns line rarely moves above XLP’s, and while past performance does not predict future results, there is little to justify charging this much for a fund more suited for traders than investors.
Portfolio Visualizer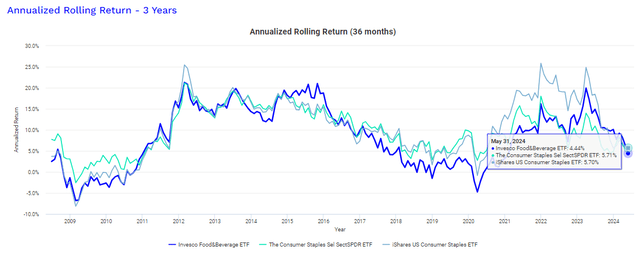
PBJ Analysis
PBJ Composition vs. XLP, VDC, FSTA, IYK
The following table highlights the cash-adjusted allocations for PBJ’s top 25 holdings, totaling 87.61% of the portfolio. One reason to consider PBJ is its composition significantly differs from XLP, VDC, FSTA, and IYK. Except for Coca-Cola (KO) and Mondelez International (MDLZ), most have little to no representation in plain vanilla funds. Instead, they’re dominated by mega-caps like Procter & Gamble (PG), Costco (COST), and Walmart (WMT), three stocks excluded in PBJ.
The Sunday Investor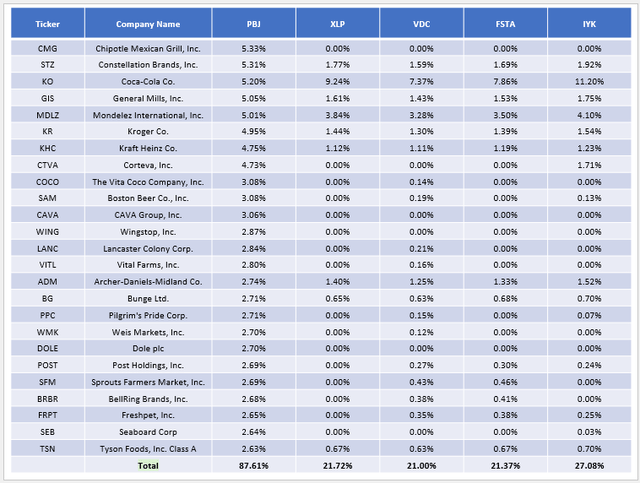
PBJ Fundamental Analysis
The following table highlights selected fundamental metrics for these top 25 holdings. I’ve also included summary metrics for the four peers at the bottom.
The Sunday Investor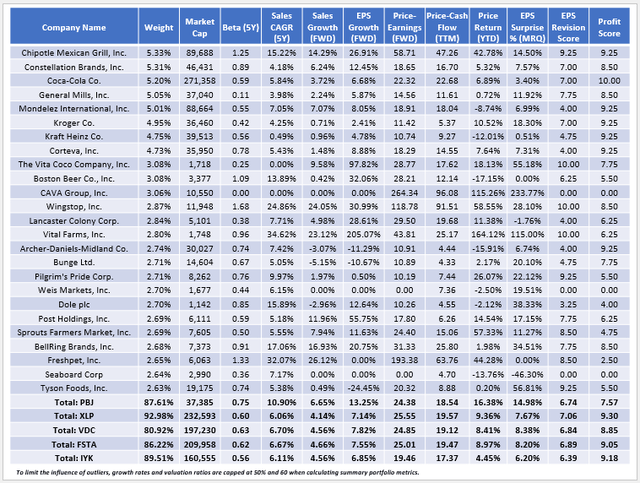
Here are four observations to consider:
1. PBJ has a 0.75 five-year beta, substantially higher than what XLP, VDC, FSTA, and IYK feature. This implies that some downside protection is given up, and historically, that’s been the case. PBJ declined by 34.22% during the subprime crisis between November 2007 and February 2009 compared to 28.12% for XLP, and it also didn’t perform as well in Q1 2020.
Portfolio Visualizer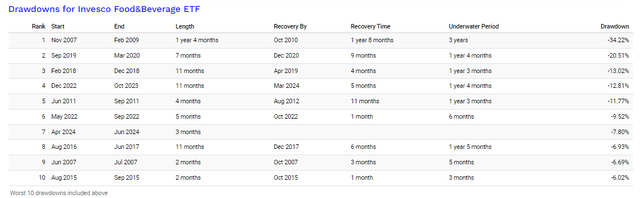
The benefit of a higher beta portfolio is that it can capture more upside. However, that’s not a typical objective for investors in this sector. The fundamental analysis table identifies several small- and mid-cap stocks with betas close to or above one, so the difference in size is the primary source of this additional risk.
2. Smaller companies often offer more significant growth potential, and that’s featured with stocks like The Vita Coco Company (COCO) and Vital Farms (VITL), which have forward earnings growth rates of 97.82% and 205.07%, respectively. I’ve capped these at 50% to calculate PBJ’s 13.25% forward earnings growth rate, but even so, it’s nearly twice as good as its peers.
There are only about 100 U.S. Consumer Staples stocks with market caps above $1 billion, and the median forward earnings growth rate is only 7.31%. Therefore, I am confident that the proprietary model overweights the growth factor. I’ve found the same with other Invesco ETFs in defensive based on Intellidex indexes in defensive sectors, with forward earnings growth rates vs. their sector benchmarks as follows:
- Invesco Dynamic Biotechnology & Genome ETF (PBE): 11.79% vs. 8.62%
- Invesco Dynamic Leisure & Entertainment ETF (PEJ): 16.64% vs. 7.09%
- Invesco Dynamic Pharmaceuticals ETF (XLV): 9.90% vs. 8.62%
3. As I mentioned earlier, the model does not emphasize quality. PBJ’s sector-adjusted profit score based on Seeking Alpha Factor Grades is lower than XLP’s (7.57/10 vs. 9.30/10) and, in my view, the most likely source of its long-term underperformance. Instead, the model emphasizes momentum. Consider how its constituents are up 16.38% YTD, but the ETF’s price has declined by 2.03%. The discrepancy relates to turnover, calculated at 95% for the most recent fiscal year. Specifically, 13/30 current holdings are new to the fund, including CAVA Group (CAVA) and Vital Farms, up 115.26% and 164.12% YTD. Unfortunately, they weren’t selected to begin the year, and investors now need to contend with their high valuations.
4. The last time I recommended PBJ was on August 5, 2023, and the ETF subsequently ended up with a slight 0.49% total return gain compared to a 1.49% loss for XLP until my downgrade in January 2024. I felt confident with my rating at the time because PBJ traded at a five-point discount on forward earnings compared to XLP using the simple weighted average method (18.88x vs. 23.80x). That discount is necessary to make PBJ a successful trade, given the additional risk, lower quality, and higher fees.
Unfortunately, despite its weak recent performance, PBJ offers only a one-point discount on forward earnings (24.38x vs. 25.55x) and trailing cash flow (18.54x vs. 19.57x). On valuation, IYK looks the most attractive (19.46x forward earnings, 17.37x trailing cash flow). Although it doesn’t offer nearly the same growth potential as PBJ, its fundamentals are competitive with XLP, VDC, and FSTA.
Investment Recommendation
PBJ is a high-fee food and beverage fund based on a proprietary model emphasizing growth and momentum. Unfortunately, quality is consistently low, a feature I suspect has led to poor long-term returns. To compensate, I suggest readers look for steep valuation discounts in the 4-5 point range on forward earnings, and since that’s not the case today, I don’t recommend buying. Thank you for reading, and I look forward to your comments below.
: A Strong Loan Book, But Earnings Are Under Pressure")

")

")
