

")


All Along the Watchtower
Song by The Jimi Hendrix Experience (1968)
“There must be some kind of way out of here”
Said the joker to the thief
“There’s too much confusion I can’t get no relief
Businessmen, they drink my wine Plowmen dig my earth
None will level on the line
Nobody offered his word”
Introduction
“There’s too much confusion, I can’t get no relief.” Hendrix wasn’t writing about global markets, but he might as well have been. War in Iran, political turmoil, an AI reckoning, and a private credit crisis are dominating headlines all at once and investors are searching for a way out. But through the noise, American business keeps doing what it does best: innovating and producing higher earnings.
In my year-end 2025 letter, we discussed stock market volatility versus bear markets, with the expectation that 2026 would bring heightened turbulence. That expectation has arrived in force. Although the Iran conflict is front and center, the broader thesis from that letter remains intact. As the chart below shows, 100% of midterm election years since 1950 have produced significant corrections, averaging more than –17%.
Add the well-documented pattern of –10%+ pullbacks surrounding the appointment of a new Fed chair, and 2026 is delivering both events in a single year.
The good news: one-year returns following midterm correction troughs have been positive every single time.
Carson Group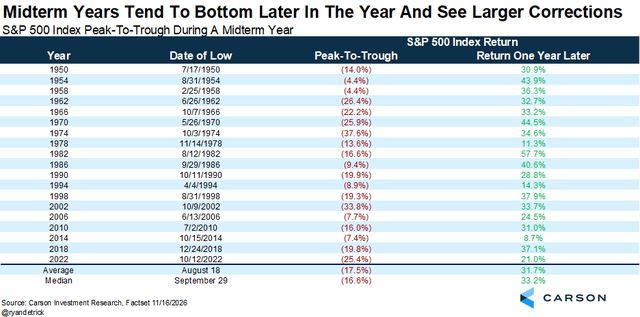
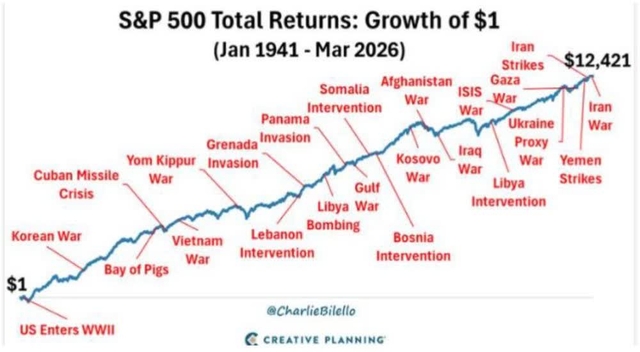
The year-end letter also introduced “the law of unpredictability”—which turned out to be accidentally perfect timing heading into the 2026 bombing of Iran. Markets are amoral. Wars tend to produce short-term disruptions that, historically, create buying opportunities. As the chart below illustrates, geopolitical shocks have rarely derailed markets for long. That may prove true again—but today’s letter will examine the three trends I believe will define the balance of 2026.
Part I. Rising Prices and Rising Rates After the Bombs Drop
The Iran conflict triggered the closure of the Strait of Hormuz, and that single event sent commodities sharply higher. Oil grabbed the headlines, but other critical supply chains—shipping, fertilizer, chemicals—have also been disrupted. Just when the Fed appeared ready to cut rates, a geopolitical curveball sent interest rates in the opposite direction.
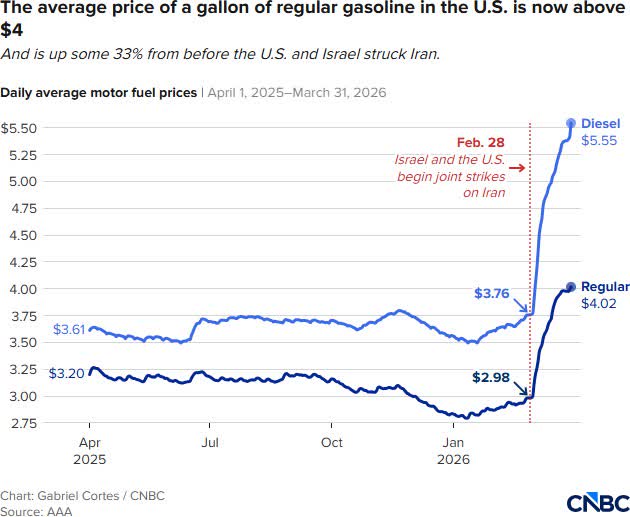
The charts below paint a picture of rising prices hitting Americans where it hurts most. This comes at a time when affordability is the number one political topic in the country—and more importantly, it is pushing the 10- year Treasury yield higher.
Shipping, Fertilizer, and Chemical Price Increases
Edward Elson Charlie Bilello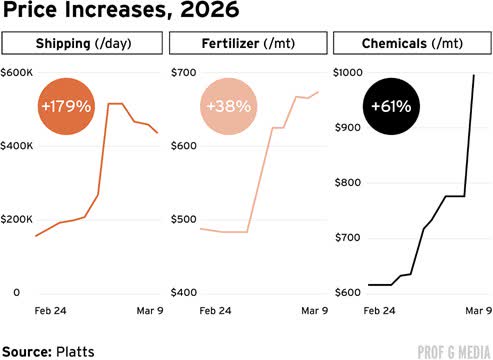
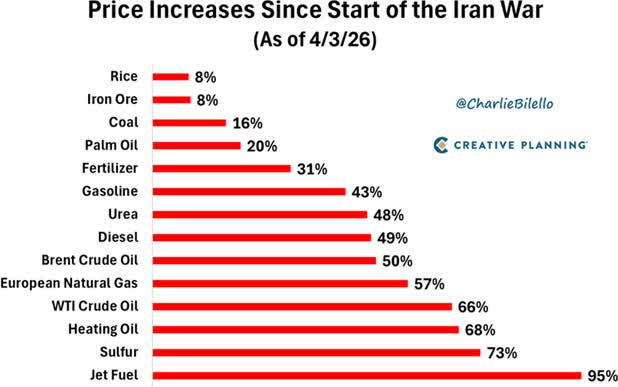
Right now, Americans are feeling the pain at the gas pump, in the grocery store, and through higher borrowing costs. But international markets are in a full-blown supply chain crisis. Unleaded gas is up roughly 35%.
Fertilizer and shipping costs are driving food prices higher. Mortgage rates remain stubbornly elevated.
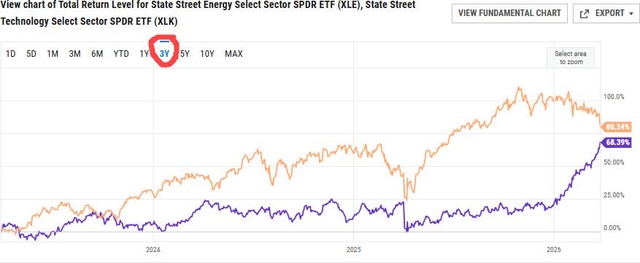
For all you Millennials and Gen Z readers—do not look now, but energy stocks are outperforming technology stocks on a one-year basis. As the chart below shows, energy is closing in on three-year outperformance. This may dissipate quickly if the conflict resolves, but oil prices are unlikely to reset to recent lows under any uneasy peace agreement.
XLE Energy ETF (Purple) vs. XLK Tech ETF (Orange)
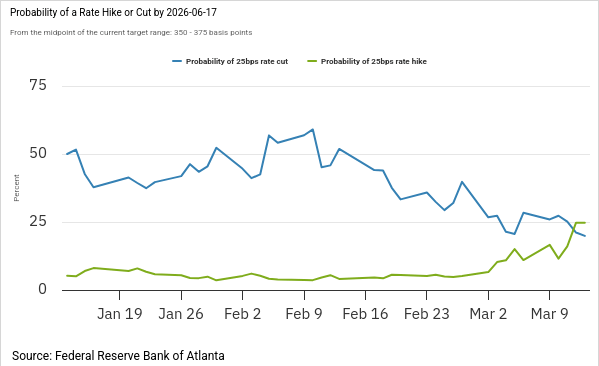
The biggest market consequence of the war is that the Fed is now frozen, with almost no chance of rate cuts in 2026. In fact, as the chart below shows, there is now a higher probability of a rate hike than a cut.
Probability of a Rate Hike Higher Than a Cut (as of March 2026)
Part II. Private Credit and Private Equity
“There is never just one cockroach.” —Jamie Dimon, JPMorgan
Rising interest rates and a frozen Fed are the perfect segue into a more dangerous market condition: the private credit and private equity sector. These industries experienced explosive growth coming out of the 2008 financial crisis, stepping in where banks pulled back from lending to small businesses. They have been one of the great American financial success stories of the last fifteen years. Now they are facing their first real test.
Let me be clear at the outset: Lansing Street Advisors would not exist without private equity. A good portion of our clients built their wealth by selling companies to private equity funds. Private credit and equity have delivered massive liquidity to small business owners across the country while generating strong returns for fund shareholders. But like any sector, they will experience bull and bear markets. This is their first full-blown sector bear market—and the question is how far the damage will spread.
I am going to do my best to keep this at an elevated level and not lose readers in the weeds. Two definitions:
Private credit is debt financing provided directly by non-bank lenders to companies through privately negotiated loans. Think of it as non-bank loans.
Private equity is where funds acquire or take stakes in private companies, improve their operations, and sell them for a profit. Think of it as funds taking equity stakes in small businesses.
Right now, the crisis is concentrated in private lending, but the risk of it spreading to private equity is part of the broader apprehension. According to Pitchbook, private credit has tripled since 2015 to $1.3 trillion. The Financial Times puts total private loans at $2 trillion by the end of 2025.
Financial Times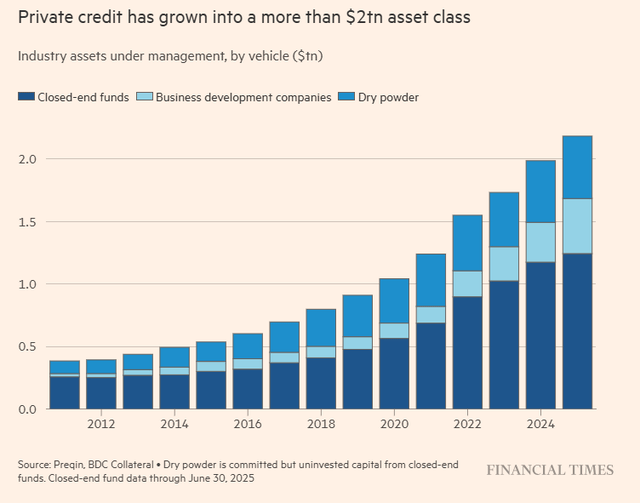
In 2025, two large defaults—Tricolor Holdings and FirstBrands Group—ignited fear across the sector. Both companies sought bankruptcy protection amid accusations of fraudulent bookkeeping. These cases raised serious red flags about the level of underwriting and due diligence in the private lending industry. As Jamie Dimon has said: “There is never just one cockroach.”
Institutional investors—pension funds, endowments, hedge funds, and insurance companies—own an estimated 70% of private loans, with the remaining 30% held by high-net-worth individuals.
Perplexity.ai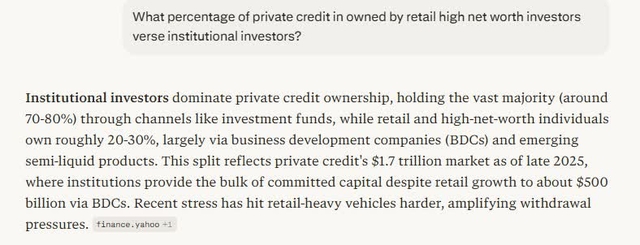
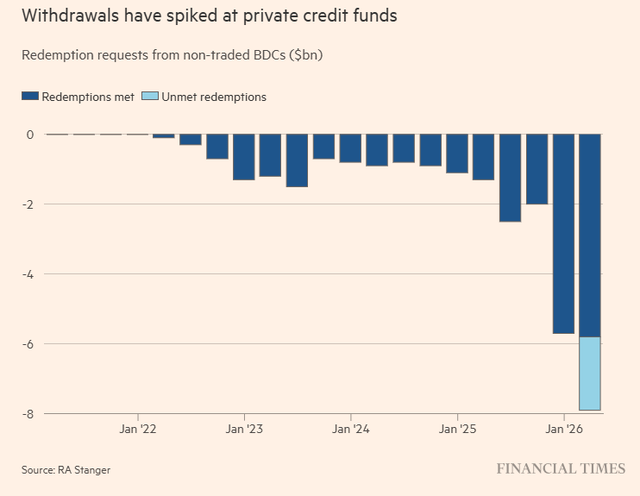
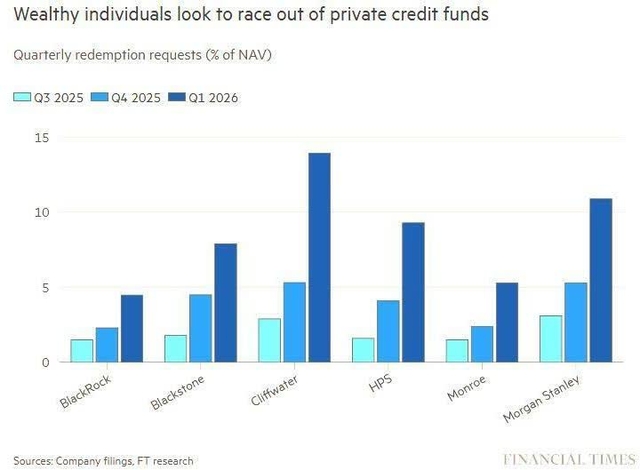
Here is the next key point to understand: private credit is “semi-liquid,” typically capping quarterly withdrawals at 5%. You cannot press a key on your computer and sell your holdings. If withdrawal requests exceed the 5% cap, investors get prorated and must resubmit the following quarter. As the charts below show, withdrawal requests have increased—sparking worries about a classic “run on the bank.”
Speaking of banks: the private lending business has been so lucrative that traditional banks have made roughly $300 billion in loans to private credit companies. Yes, banks lending to companies that lend to companies. The good news is that U.S. bank balance sheets are in solid shape and $300 billion in exposure is manageable—but this daisy chain reinforces the broader credit-crisis narrative.
On top of banks, insurance companies have approximately 25% of their investment portfolios in private lending. Pensions and endowments hold up to 30% in illiquid private equity and debt. Trillions in private funds, public bank exposure, life insurance exposure, institutional money exposure.
This is why the alarming phrase “credit crisis” is back in the headlines. We have not had a credit crisis in the United States since 2008. A credit crisis freezes lending and liquidity across the economy as defaults and loss of confidence feed on each other.
This leads to the big question: what is the current default rate? Fitch reports 9.2% for 2025—high enough to leave investors worried about being the last one out the door. We have wood to chop before this is over.
Perplexity.ai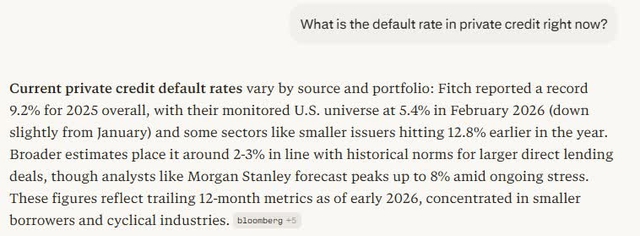
Exacerbating the problem are three structural factors:
Illiquidity. Publicly traded private funds are semi-liquid with quarterly withdrawal caps. Non-publicly traded funds have no set liquidity dates whatsoever.
Opaqueness. Private managers lack the disclosure requirements of public companies. “Mark-to-market” pricing on loan values and company valuations is self-reported. When you grade your own homework, investors get nervous.
Complexity. Here are just some of the strategies being executed by private equity firms: secondaries, continuation funds, NAV lending, preferred equity, strip sales, sale of GP stakes, and PIK loans. Insurance companies with large private investments run offshore reinsurance affiliates domiciled in Bermuda or the Cayman Islands, adding layers of regulatory complexity.
The final blow to private lending in late 2025 was the repricing of the technology sector—especially what some are calling the “SAAS apocalypse,” where AI tools began disrupting traditional software-as-a-service subscription models that were once considered toll-booth businesses with bulletproof recurring revenue.
Private credit lenders have 25–30% exposure to software companies, and AI’s potential impact on this sub- sector has made investors skeptical that anyone can reliably model future cash flows or valuations. More on this in Part III.
If the private world goes “worst case”—are we facing a 2008 situation?
I think not.
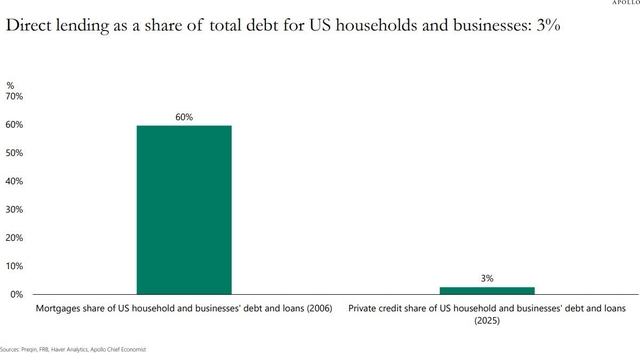
As Torsten Slok at Apollo has pointed out, the direct lending market is roughly $2 trillion—representing about 3% of total debt outstanding for U.S. households and businesses. By comparison, mortgages accounted for approximately 60% of total household and corporate debt at the peak of the housing bubble in 2006. Three percent versus sixty percent. The scale is simply not comparable.
Perplexity.ai
Private equity and credit filled a void of liquidity after the 2008 crisis. Now they are facing their first sector-level credit crunch. This will create winners and losers, but America is a dynamic marketplace—when these loans take bigger markdowns, opportunistic investors will line up to buy them at a discount. That’s how markets work.
The questions remain: how far will this affect the real economy, and will it spread beyond the private sector?
Right now, loan growth at banks remains strong, credit spreads are still tight, and there are no signs of a systemic crisis materializing. But we are in the early innings of a private lending bear market, and prudence is recommended.
Part III. The Revaluation of the Technology Sector
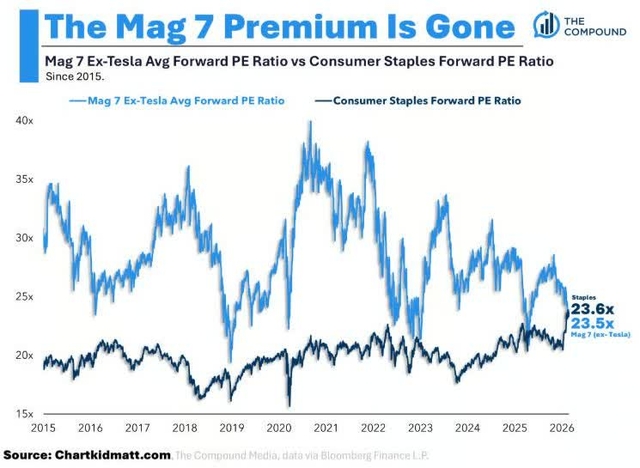
Here is a statistic that would have seemed impossible two years ago: technology stocks’ forward P/E multiples now equal the defensive consumer staples sector. In 2021, the Magnificent 7 traded at roughly 40 times earnings versus 20 times for staples. Today, that gap has closed entirely.
Technology sub-sectors are in bear markets—not corrections. The distinction matters.
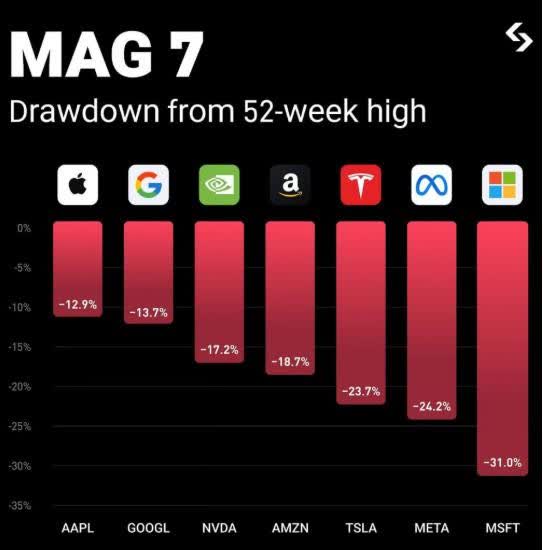
Software (IGV): down 33%. Cybersecurity (CIBR): down 20%. SaaS (XSW): down 33%. Magnificent 7 (MAGS): down 17.5%. A number of well-known retail trading favorites in these sub-sectors have been cut in half.
This all started in October 2025 with the beginning of the SaaS and crypto repricing, when AI tools demonstrated their potential as a genuine threat to the software-as-a-service subscription model. At the same time, the market grew skeptical of hyper-scalers’ massive AI spending without evidence of immediate revenue growth.
AI remains a “known unknown.” The market does not yet know who the winners and losers will be. But rather than wait around to find out, investors have chosen to de-risk first and ask questions later. That de-risking has played out as a broad technology trading slump—and it feeds directly into the private credit problem discussed in Part II, where lenders have heavy exposure to the very software companies being repriced.
Conclusion
The S&P 500 has compounded at a mid-teens annual rate for the 17 years from the trough of March 2009 through the close of 2025. In that period, the world witnessed roughly 200 conflicts and 10 to 15 major wars.
Perplexity.ai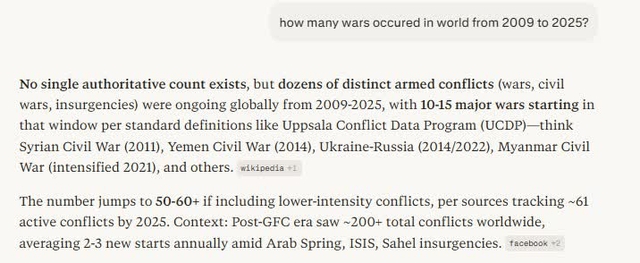
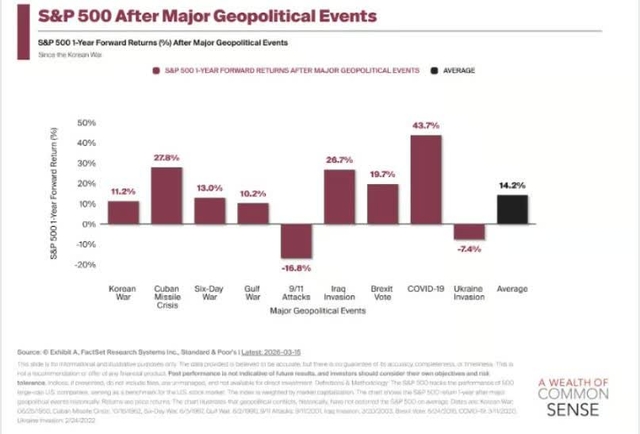
As the chart below shows, the S&P 500 has delivered a positive one-year return following virtually every major geopolitical event in modern history.
Right now, I rank the Iran war as #3 on the 2026 risk scale—behind the private equity/credit bear market at #2 and the “known unknown” of the AI buildout at #1. We expect volatility to remain elevated through 2026 due to midterm elections and the new Fed chair appointment.
Hendrix sang about confusion, about businessmen drinking his wine, about no one leveling on the line. That feels about right for 2026. There is genuine uncertainty in this market—more than we’ve seen in years. A war nobody predicted, a credit cycle nobody modeled, and a technology repricing nobody timed.
But confusion is not the same thing as catastrophe. And volatility is not the same thing as a bear market. Those distinctions matter—and understanding them is what separates investors from speculators.
The two riders approaching in Hendrix’s song could be anything—fear and opportunity, risk and reward, panic and patience. History tells us the investors who stay the course through periods of maximum confusion are the ones who come out ahead.
As always, stay the course. Investing is a psychology game, not an IQ game.
All Along the Watchtower
Song by The Jimi Hendrix Experience (1968)
All along the watchtower Princes kept the view
While all the women came and went Barefoot servants too
Outside in the cold distance A wildcat did growl
Two riders were approaching And the wind began to howl
Original Post
Editor’s Note: The summary bullets for this article were chosen by Seeking Alpha editors.

")

")

