We are pleased to provide you with the 2026 2ⁿd quarter investor letter for Gator Financial Partners, LLC, Gator Offshore Partners, Ltd., and Gator Qualified Partners, LLC (collectively, the “Funds”). This letter reviews our 2026 Q2 performance and shares our investment thesis on Navient Corporation (NAVI).
Review of Q2 2026
During the 2 ⁿd quarter of 2026, the Funds had strong absolute and decent relative performance. We barely underperformed the broader market, but we outperformed the Financials sector benchmark by a good margin. The Funds’ holdings in small and mid-cap Financials slightly outperformed the largest bank and insurance companies again this quarter.
Our long positions in Compass, UBS (UBS), UMB Financial (UMBF), Voya Financial (VOYA), and Société Générale (SCGLY) were the top contributors to the Funds’ performance. The largest detractors were long positions in Fiserv (FI) and Carlyle (CG) and short positions in TD Bank (TD), Citigroup (C), and KeyCorp (KEY).
2026 Q2
2026 YTD
Total ReturnSince Inception ¹
Annualized ReturnSince Inception ¹
Gator Financial Partners, LLC ²
14.82%
6.52%
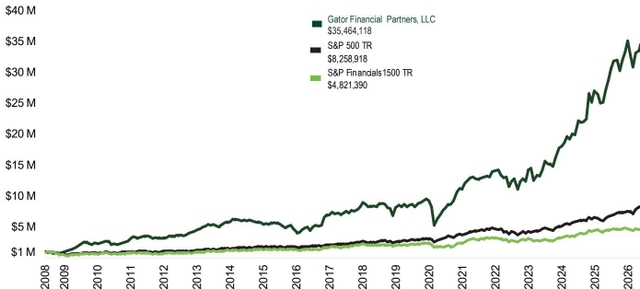
3447.10%
21.93%
S&P 500 Total Return Index ³
15.20%
10.21%
725.71%
12.44%
S&P 1500 Financials Index ³
9.36%
-0.36%
382.72%
9.14%
Gator Offshore Partners, Ltd. ²
14.58%
6.08%
424.37%
14.48%
S&P 500 Total Return Index ³
15.20%
10.21%
396.93%
13.98%
S&P 1500 Financials Index ³
9.36%
-0.36%
272.63%
11.34%
Gator Qualified Partners, LLC ²
13.98%
7.42%
25.59%
25.59%
S&P 500 Total Return Index ³
15.20%
10.21%
22.32%
22.32%
S&P 1500 Financials Index ³
9.36%
-0.36%
5.03%
5.03%
Source: Gator Capital Management & BloombergAll data is as of June 30, 2026.
The second quarter rebounded from the weak first quarter. We had strong results in April and June, driven by a rebound in several of the poor performers from Q1, such as Compass and UBS. We thought Q1 earnings season was strong for bank credit quality. Small and mid-cap banks continued to have strong performance through Q2.
Investment Thesis on Navient Corporation (“NAVI”)
Navient trades at roughly 40% of tangible book value as investors continue to view it as a runoff portfolio of legacy student loans, in other words, a melting ice cube. We believe that Navient is becoming a growth lender again, and investor perception will shift in time. The private student lending market is entering its first meaningful expansion in more than fifteen years, an activist investor has completed a major restructuring of the company, and early evidence suggests Navient’s loan portfolio may be returning to growth for the first time in years.
Background on Student Lending
To understand the opportunity in Navient’s stock, we believe it is important to understand some of the dynamics and history of the student lending industry. Since there are only three publicly traded companies focused on the student lending industry and their combined market cap is only $10 billion, the vast majority of investors are not knowledgeable on the subject.
During the 1980s and 1990s, most student loans were made by banks and consumer finance companies and received a guarantee from the federal government for 97% of the principal under the Federal Family Education Loan Program (FFELP). In 1994, the federal government started the William D. Ford Federal Direct Loan Program, which made loans directly to students and cut the private lenders out of the process. Between 1994 and 2010, the Direct Loan Program had market share ranging between 20% and 33%. During the 2000s, there was a perception among several Congressmen and Senators that the banks participating in the FFELP program were receiving the excess benefits of that program and the federal government should get the profits offered by the guarantee that it was paying for.
In 2010, the federal government effectively nationalized student lending by ending FFELP. Private lenders could still make student loans when students and/or their parents needed funding above the limits of the Federal Direct Loan Program. This drastically altered the businesses of the student lenders. Currently, the Federal Direct Loan Program makes about 90% of all student loans. Private student lenders, like Sallie Mae (SLM) and Navient, make the other 10% of student loans.
Sallie Mae and Navient’s 2014 Spin-Off
In response to the 2010 shift in the student loan industry, in 2014, Sallie Mae separated into two publicly traded companies, Sallie Mae and Navient. The “new” Sallie Mae retained the consumer banking and private student loan origination business, while Navient inherited the servicing platform, collections operations, and a large portfolio of legacy student loans, particularly FFELP loans. Navient would have substantial recurring cash flows from its existing loan portfolio but limited opportunities for organic growth. While the “new” Sallie Mae would have faster growth from its large origination platform but a small existing portfolio of loans.
After the spin-off, Navient’s management responded by aggressively returning capital to shareholders. Over the past decade, Navient has returned billions of dollars to shareholders through share repurchases, shrinking its share count by almost 80%. The company also diversified beyond servicing legacy student loans through acquisitions and internal investments. In 2017, Navient acquired Earnest, a technology-driven lender focused on student loan refinancing and private student loans. Earnest gave Navient more student loan origination capabilities.
Navient also used its loan servicing platform to expand into Business Process Outsourcing ((“BPO”)), providing technology-enabled customer care, payment processing, healthcare revenue cycle management, government services, and collections for third-party clients. Although the BPO business generated stable fee income and diversified earnings away from education finance, it lacked meaningful strategic overlap with the core lending franchise.
Because Navient was prohibited from originating new in-school private student loans until 2019 due to the spin-off with Sallie Mae, its lending business was dependent on refinancing existing student debt. Because Navient’s FFELP loan portfolio has been declining and it struggles to generate enough refinance loans to show growth in its private student loan portfolio, investors view the company as a company whose earnings steadily decline over time. They have placed low earnings multiples (between 3x and 8x) on Navient’s earnings. However, on the bright side, Navient has been able to repurchase stock at these low earnings multiples and manufacture growth in earnings per share.
Why the Current Opportunity Exists in Navient’s Stock
Navient is widely perceived as a shrinking student loan servicer managing a legacy portfolio in decline. We believe that view soon may change. After more than a decade of balance sheet simplification, aggressive capital allocation, and corporate restructuring, we believe Navient is positioned to benefit from the first meaningful expansion in the private student lending market in over fifteen years. At roughly 40% of tangible book value, investors appear to value the company as though its future is one of perpetual decline.
For much of the past five years, Navient’s core refinancing businesses have faced challenging industry conditions. Low interest rates and the federal payment moratorium on student loans made refinancing less compelling to borrowers. Then, the potential for student loan forgiveness during the Biden Administration made refinancing government student loans even less attractive. At the same time, Navient’s in-school private lending did not help to improve its loan growth because the company has had trouble getting added to approved lender lists in financial aid offices.
We believe another issue with Navient’s stock price is investors’ perception of the credit quality of the company’s loan portfolio. We admit the current credit quality metrics that Navient has reported are mixed. The absolute level of delinquencies is high, but the recent data has shown improvement. The company has publicly expressed that current credit quality is not where they expect it to be in the medium term. One problem has been the sub-par vintages of 2023 and 2024 loans, meanwhile Navient’s 2025 vintage of loans appears to be performing better.
Another gap in investors’ perception exists because of Navient’s confusing accounting. Navient often uses derivatives to hedge the embedded options in its FFELP loan portfolio. Also, because the FFELP loan portfolio is so low risk, it allows for massive leverage. This makes Navient’s balance sheet appear top-heavy.
A final issue affecting the company’s stock price is the company is only marginally profitable with the size of its current loan portfolio. We expect as Navient grows its loan portfolio, it will display significant operating leverage and improve its profitability.
Huge Industry Change
A fundamental shift in U.S. higher education financing has materially improved the long-term growth outlook for private student lenders. With the passage of the “One Big Beautiful Bill Act” in the summer of 2025, Congress eliminated the federal Grad PLUS loan program. As a result, the federal government will no longer originate graduate student loans through that program, leaving private lenders to fill much of the resulting financing gap. We estimate that this change will increase the addressable market for private student lenders by approximately 80%, creating a meaningful long-term growth opportunity for companies such as Navient.
We believe this change will help Navient get its foot in the door in more college financial aid offices. The end of the Grad PLUS loan program has caused college financial aid officers to scramble to fill the funding gap for students. We believe they have been more open to conversations with student lenders, like Navient, who have not previously been on their preferred lender lists.
In our view, investors are discounting the benefits of this industry change because it will take two to three years to show up in earnings. In late 2025, Sallie Mae told investors that 2026 would be an investment year as they geared up for the opportunity from the end of the Grad PLUS loan program. Sallie Mae said it would ramp up spending to prepare for the opportunity, but loan volumes would take three years to build. As investors often do, they are asking how do I get paid right now. They don’t want to own a stock when the payoff is in three years. We see a huge growth opportunity that is not discounted in the student lender stocks.
A New Steward Has Spent 4 Years Changing the Business
In 2022, an activist investor, Edward Bramson of Sherborne Investors, built a 29 million share or 19% ownership position in Navient. Although Bramson has not added to his holdings since 2022, his percentage ownership has increased to 31% as Navient has consistently repurchased shares. He has a long history as a successful activist investor. He usually focuses on one activist investment at a time. Often, he will take an executive position at the company, which took place at Navient when Bramson assumed the CEO role in June of this year. In 5 of his last 7 activist investments, he has doubled his investors’ money. With Navient, the stock must double to get back to his cost basis in the $16-17 range.
At Bramson’s suggestion, Navient’s management sold the BPO unit for cash. Navient also restructured its workforce by outsourcing its loan servicing operations to a third party. This was important because it shifted Navient’s expense base to a variable cost structure. With the decline in lending balances, this has protected profitability at the company.
We see the past four years of work put in by the activist investor, but the stock doesn’t reflect any of the positive changes. We do not have to wait for a catalyst. Our catalyst is already in place, he owns 31% of the stock, and he is the CEO.
An Overlooked Growth Datapoint
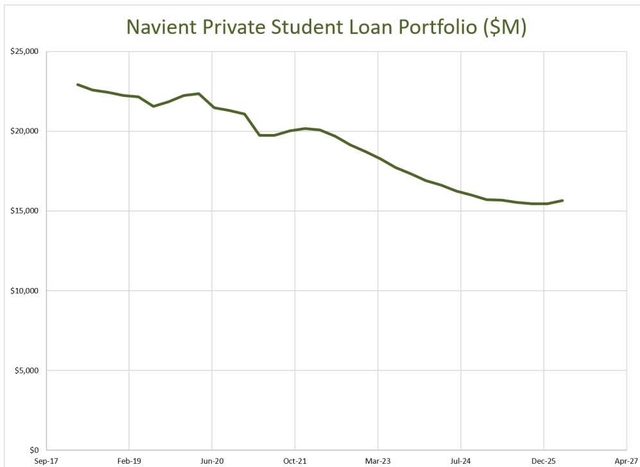
While investors remain focused on the declining legacy FFELP portfolio, we believe they are overlooking a much more important development: the re-emergence of growth in private student lending. In the 1 st quarter of 2026, Navient grew its student loan portfolio for the first time since the 4 th quarter of 2021. We believe this is the early sign of a turn in the growth of this portfolio for 3 reasons: 1) the moratorium on student loan payments has ended so prospective customers are more likely to seek out and refinance their existing loans, 2) the volume of indicative refinance offers Navient has made has increased dramatically in the recent quarters, and 3) the end of Grad PLUS Loans this Fall provides Navient a huge opportunity to get onto preferred lender lists at on-campus financial aid offices.
Navient’s lending platform, Earnest, has expanded beyond refinancing to include in-school loan originations, allowing the company to establish relationships with borrowers at the beginning of their educational journeys rather than only after graduation. More importantly, recent legislative changes are reducing the federal government’s role in graduate student lending, creating a meaningful expansion in the addressable market for private lenders. For more than a decade, private lenders originated only about 10% of student loans while the federal government dominated the market. We believe that mix could shift materially over the coming years, creating one of the strongest growth opportunities the private student lending industry has experienced in decades.
The first quarter may already be signaling this inflection, with growth returning to Navient’s private lending business.
Valuation
Today, Navient trades at approximately 40% of tangible book value. The low level of valuation tells us that 1) investors are worried about the existing credit quality of Navient’s loan portfolio 2) they don’t have a clear understanding of the profitability potential of Navient’s business, and 3) they don’t believe in the potential future growth of Navient. As long as Navient’s management believes they can fund future loan growth through internally generated capital and the shares remain so deeply discounted, we agree that they should continue repurchasing shares.
The valuation also creates an unusual alignment with Sherborne Investors. Based on public disclosures, Sherborne’s average cost is estimated to be approximately $16–17 per share, well above the current share price. Bramson has demonstrated throughout his career that he remains engaged until value is realized. If Sherborne simply succeeds in recovering its investment, shareholders purchasing shares today could potentially realize a return of approximately 100%.
Potential risks
Navient could be a value trap. Navient’s management appears to be unwavering in their commitment to growing the loan portfolio. If they are not able to grow the loan portfolio, they have not signaled that they’d be willing to run off the loan portfolio and use the proceeds to return capital to shareholders. They may not create any value for shareholders.
It is not clear that Navient’s refinance lending business has any franchise value. If Navient’s management were to try to monetize the business, we don’t know of any potential acquirers who want Navient’s lending business. The potential acquirers may be financial buyers who would require a discount to tangible book value to manage the run-off of the loan portfolio.
Student lending always has political risk. Fortunately for Navient, the most recent turn of political risk was a huge positive when in the summer of 2025, the Big Beautiful Bill ended the Grad PLUS Loan Program. The largest political risk going forward is if Congress got rid of the fact that student loans are not dischargeable in bankruptcy. If this changed, it would drastically affect Navient’s loan quality. Luckily, there is no current momentum to make this change.
Conclusion
Successful investments often arise when investor perception lags business reality. We believe Navient represents precisely that opportunity. The market continues to price the company as though it is merely managing the decline of a legacy loan portfolio with mixed credit metrics. In our view, the combination of an expanding addressable market, a focused management team with substantial skin in the game, disciplined capital allocation, and an attractive valuation creates the potential for a significant re-rating and earnings growth over the next several years.
Portfolio Analysis
Largest Positions
Below are the Funds’ five largest common equity long positions. All data is as of June 30, 2026.
Long
Société GénéraleBNP Paribas (BNPQY)Compass Inc. (COMP)First Citizens BancShares (FCNCA)UMB Financial
Sub-sector Weightings
Below is a table showing the Funds’ positioning within the Financials sector as of June 30, 2026.
Long
Short
Net
Alt Asset Managers
3.11%
-0.48%
2.63%
Capital Markets
16.39%
-0.70%
15.70%
Banks (large)
22.55%
-13.21%
9.34%
Banks (MID)
25.41%
-11.37%
14.05%
Banks (small)
19.45%
0.00%
19.45%
P&C Insurance
1.88%
-5.50%
-3.62%
Life Insurance
11.00%
-1.39%
9.61%
Non-bank Lenders
9.96%
0.00%
9.96%
Processors
8.82%
0.00%
8.82%
Real Estate
8.97%
-1.07%
7.91%
Exchanges
0.00%
0.00%
0.00%
Index Hedges
0.00%
-44.51%
-44.51%
Non-Financials
0.00%
0.00%
0.00%
Total
127.55%
-78.21%
49.34%
The Funds’ gross exposure is 205.76%, and its net exposure is 49.34%. From this table, we exclude fixed-income instruments such as preferred stock. Preferred stock positions account for an additional 7.55% of the portfolio.
Conclusion
Thank you for entrusting us with a portion of your wealth. We are grateful to you, our investors, who believe in and trust our strategy. On a personal level, Derek Pilecki, the Fund’s Portfolio Manager, continues to invest more than 80% of his liquid net worth in the Fund.
As always, we welcome the opportunity to speak with you and discuss the Fund.
Sincerely,
Gator Capital Management, LLC
References
Gator Financial Partners, LLC’s inception date was July 1, 2008. Gator Offshore Partners, Ltd. and Gator Qualified Partners, LLC have inception dates of April 1, 2014 and July 1, 2025, respectively.
Performance presented assumes reinvestment of dividends, is net of fees, brokerage, and other commissions, and other expenses an investor in the Fund would have paid. Past performance is not indicative of future results.
Performance presented assumes reinvestment of dividends. No fees or other expenses have been deducted.
‘Financials sector’ is defined as companies included in the Global Industry Classification Standard (“GICS”) sectors 40 and 60, which contain financial and real estate companies.
Gator Capital Management, LLC prepared this letter. Ultimus LeverPoint Fund Solutions, LLC, our administrator, is responsible for the distribution of this information and not its content.
General Disclaimer
By accepting this investment letter, you agree that you will not divulge any information contained herein to any other party. This letter and its contents are confidential and proprietary information of the Fund, and any reproduction of this information, in whole or in part, without the prior written consent of the Fund is prohibited.
The information contained in this letter reflects the opinions and projections of Gator Capital Management, LLC (the “General Partner”) and its affiliates as of the date of publication, which are subject to change without notice at any time subsequent to the date of issue. All information provided is for informational purposes only and should not be deemed as investment advice or a recommendation to purchase or sell any specific security.
All performance results are based on the net asset value of the Fund. Net performance results are presented net of management fees, brokerage commissions, administrative expenses, and accrued performance allocation, as indicated, and include the reinvestment of all dividends, interest, and capital gains. The performance results represent Fund-level returns and are not an estimate of any specific investor’s actual performance, which may be materially different from such performance depending on numerous factors.
The market indices appearing in this letter have been selected for the purpose of comparing the performance of an investment in the Fund with certain well-known equity benchmarks. The statistical data regarding the indices has been obtained from Bloomberg and the returns are calculated assuming all dividends are reinvested. The indices are not subject to any of the fees or expenses to which the funds are subject and may involve significantly less risk than the Fund. The Fund is not restricted to investing in those securities which comprise these indices, its performance may or may not correlate to these indices, and it should not be considered a proxy for these indices. The S&P 500 Total Return Index is a market cap weighted index of 500 widely held stocks often used as a proxy for the overall U.S. equity market. The S&P 1500 Financials Index is a market cap weighted index of financial stocks within the S&P 1500 Super Composite Index we used as a proxy for the Financials sector of the U.S. equity market. An investment cannot be made directly in either index. The Fund consists of securities which vary significantly from those in the benchmark indices listed above. Accordingly, comparing results shown to those of such indices may be of limited use.
Statements herein that reflect projections or expectations of future financial or economic performance of the Fund are forward-looking statements. Such “forward-looking” statements are based on various assumptions, which assumptions may not prove to be correct. Accordingly, there can be no assurance that such assumptions and statements will accurately predict future events or the Fund’s actual performance. No representation or warranty can be given that the estimates, opinions, or assumptions made herein will prove to be accurate. Any projections and forward-looking statements included herein should be considered speculative and are qualified in their entirety by the information and risks disclosed in the Fund’s Private Placement Memorandum. Actual results for any period may or may not approximate such forward-looking statements. You are advised to consult with your own independent tax and business advisors concerning the validity and reasonableness of any factual, accounting and tax assumptions. No representations or warranties whatsoever are made by the Fund, the General Partner, or any other person or entity as to the future profitability of the Fund or the results of making an investment in the Fund. Past performance is not a guarantee of future results.
The funds described herein are unregistered private investment funds commonly called “hedge funds” (each, a “Private Fund”). Private Funds, depending upon their investment objectives and strategies, may invest and trade in a variety of different markets, strategies and instruments (including securities, non-securities and derivatives) and are NOT subject to the same regulatory requirements as mutual funds, including requirements to provide certain periodic and standardized pricing and valuation information to investors. There are substantial risks in investing in a Private Fund (which also are applicable to the underlying Private Funds, if any, in which a Private Fund may invest). Prospective investors should note that:
● A Private Fund represents a speculative investment and involves a high degree of risk. Investors must have the financial ability, sophistication/experience, and willingness to bear the risks of an investment in a Private Fund. An investor could lose all or a substantial portion of his/her/its investment.
● An investment in a Private Fund is not suitable for all investors and should be discretionary capital set aside strictly for speculative purposes. Only qualified eligible investors may invest in a Private Fund.
● A Private Fund’s prospectus or offering documents are not reviewed or approved by federal or state regulators and its privately placed interests are not federally, or state registered.
● An investment in a Private Fund may be illiquid and there are significant restrictions on transferring or redeeming interests in a Private Fund. There is no recognized secondary market for an investor’s interest in a Private Fund and none is expected to develop. Substantial redemptions within a limited period of time could adversely affect the Private Fund.
● Certain portfolio assets of a Private Fund may be illiquid and without a readily ascertainable market value. The manager’s/advisor’s involvement in the valuation process creates a potential conflict of interest. Instances of mispriced portfolios, due to fraud or negligence, have occurred in the industry.
● A Private Fund may have little or no operating history or performance and may use performance information which may not reflect actual trading of the Private Fund and should be reviewed carefully. Investors should not place undue reliance on hypothetical, pro forma or predecessor performance.
● A Private Fund may trade in commodity interests, derivatives, and futures, both for hedging and speculative purposes, and may execute a substantial portion of trades on foreign exchanges, all of which could result in a substantial risk of loss. Commodities, derivatives, and futures prices may be highly volatile, may be difficult to accurately predict, carry specialized risks and can increase the risk of loss.
● A Private Fund’s manager/advisor has total trading authority over a Private Fund. The death or disability of a key person, or their departure, may have a material adverse effect on a Private Fund.
● A Private Fund may use a single manager/advisor or employ a single strategy, which could mean a lack of diversification and higher risk. Alternatively, a Private Fund and its managers/advisors may rely on the trading expertise and experience of third-party managers or advisors, the identity of which may not be disclosed to investors, which may trade in a variety of different instruments and markets.
● A Private Fund may involve a complex tax structure, which should be reviewed carefully, and may involve structures or strategies that may cause delays in important financial and tax information being sent to investors.
● A Private Fund’s fees and expenses, which may be substantial regardless of any positive return, will offset such Private Fund’s trading profits. If a Private Fund’s investments are not successful or are not sufficiently successful, these payments and expenses may, over a period of time, significantly reduce or deplete the net asset value of the Private Fund.
● A Private Fund and its managers/advisors and their affiliates may be subject to various potential and actual conflicts of interest.
● A Private Fund may employ investment techniques or measures aimed to reduce the risk of loss which may not be successful or fully successful.
● A Private Fund may employ leverage, including involving derivatives. Leverage presents specialized risks. The more leverage used, the more likely a substantial change in value may occur, either up or down.
The above summary is not a complete list of the risks, tax considerations and other important disclosures involved in investing in a Private Fund and is subject to the more complete disclosures in such Private Fund’s offering documents, which must be reviewed carefully prior to making an investment.
Gator Financial Partners, LLC Monthly Performance, net of Fees
Year
Jan
Feb
Mar
Apr
May
Jun
Jul
Aug
Sep
Oct
Nov
Dec
YTD
S&P Financials
2026
5.48%
(6.28%)
(6.15%)
7.17%
1.21%
5.86%
6.52%
(0.36%)
2025
7.03%
(2.05%)
(5.15%)
0.42%
7.87%
5.70%
6.62%
4.05%
0.32%
(5.25%)
5.69%
4.00%
31.94%
14.34%
2024
1.51%
3.54%
5.34%
(2.36%)
4.32%
(0.54%)
11.56%
(1.62%)
0.97%
1.63%
18.19%
(4.97%)
41.88%
29.78%
2023
15.60%
1.55%
(13.35%)
7.00%
(1.06%)
6.74%
10.35%
(2.47%)
(0.17%)
(2.52%)
9.25%
9.63%
44.18%
11.66%
2022
1.07%
0.68%
(5.70%)
(3.99%)
1.45%
(12.06%)
8.13%
3.44%
(13.40%)
10.84%
3.93%
(4.04%)
(11.99%)
(10.15%)
2021
0.00%
7.09%
3.32%
3.20%
1.16%
(1.95%)
(0.01%)
1.50%
0.78%
1.35%
(0.94%)
6.52%
23.86%
34.55%
2020
(2.26%)
(11.02%)
(36.23%)
22.38%
7.75%
10.71%
5.46%
7.01%
0.29%
6.24%
15.61%
5.17%
18.39%
(1.91%)
2019
17.76%
4.44%
(2.60%)
4.25%
(4.74%)
4.58%
1.05%
(4.86%)
7.60%
0.98%
2.87%
3.32%
38.10%
31.22%
2018
8.59%
(2.36%)
(4.57%)
1.20%
0.44%
(0.12%)
4.06%
0.22%
(1.31%)
(7.37%)
(0.29%)
(14.01%)
(16.02%)
(13.03%)
2017
1.19%
5.58%
(3.54%)
1.09%
(3.75%)
3.02%
4.78%
(3.21%)
4.67%
(1.12%)
3.50%
5.14%
17.98%
20.89%
2016
(12.35%)
2.02%
8.77%
4.68%
3.00%
(9.79%)
12.80%
4.95%
(0.77%)
1.72%
23.95%
5.67%
48.08%
24.28%
2015
(6.78%)
3.56%
(2.34%)
3.67%
0.74%
(0.90%)
(3.78%)
(4.55%)
(5.96%)
4.60%
2.49%
(9.85%)
(18.55%)
(0.72%)
2014
0.27%
8.12%
(0.48%)
(2.69%)
(0.49%)
0.88%
(2.27%)
1.44%
(1.87%)
(2.89%)
(0.04%)
(0.52%)
(0.97%)
14.89%
2013
8.26%
3.97%
4.11%
3.80%
5.89%
(3.78%)
2.70%
(3.51%)
(0.71%)
5.06%
4.73%
2.68%
37.76%
34.20%
2012
4.55%
1.65%
7.51%
(1.37%)
(0.67%)
3.99%
1.94%
(1.57%)
2.40%
7.61%
1.72%
3.01%
34.87%
26.90%
2011
14.03%
9.26%
(4.00%)
1.20%
6.43%
1.32%
0.36%
(5.00%)
(5.34%)
2.76%
(0.41%)
(4.34%)
15.34%
(15.01%)
2010
(2.97%)
6.01%
4.55%
5.77%
(3.00%)
(17.98%)
3.93%
(6.65%)
7.03%
7.73%
5.61%
5.13%
12.39%
13.31%
2009
22.60%
7.00%
19.23%
11.00%
17.19%
20.93%
7.90%
15.28%
(0.50%)
(12.63%)
(0.87%)
8.65%
186.31%
15.46%
2008
(1.89%)
(7.24%)
(21.90%)
16.63%
(7.93%)
11.02%
(15.26%)
(33.48%)
Performance and Risk Analysis*
Gator
S&P 500 TR
S&P 1500 Financials TR
Top 5 Long Positions
% of NAV*
Net Performance
Société Générale S.A.
9.18%
Annual Compound Return
21.93%
12.44%
9.14%
BNP Paribas
7.48%
Cumulative Return
3,447.10%
725.71%
382.72%
Compass Inc.
6.89%
% of Profitable Percentage
62.96%
68.06%
57.41%
First Citizens Bancshares
6.08%
UMB Financial Corp.
5.01%
Risk Analysis
*Top 5 positions represent delta adjusted position values.
Annualized Volatility
25.54%
15.59%
21.70%
Sharpe Ratio (RFR)
0.73
0.67
0.34
Sortino Ratio (RFR)
1.29
1.16
0.59
Downside Deviation
15.50%
10.17%
14.97%
*Statistics reflect the performance of Gator Financial Partners, LLC since inception.
OVERVIEW
Gator Financial Partners, LLC, Gator Financial Partners Offshore, Ltd., and Gator Qualified Partners, LLC (the “Funds”) are long/short equity hedge funds focused on the Financials sector. The portfolios are built by performing intensive bottom-up fundamental research on both long and short positions. The Funds are concentrated on the portfolio manager’s highest conviction ideas.The Funds favor small and mid-cap companies and companies with less research coverage from the sell-side. The sector requires specialized knowledge to correctly analyze the companies. Therefore, the portfolio manager believes there are regular opportunities for sector specialists doing fundamental research.The Fund’s goal is to maximize total return while accepting short-term periods of volatility due to the portfolio’s concentration.Growth of $1,000,000 ¹Assets Under Management
Funds AUM $288.7 M
Strategy AUM $390.5 M
Firm AUM $407.9 M
“Strategy AUM” is defined as AUM (both in pooled vehicles and in SMAs) that invest predominantly in securities in the Financials sector. “Firm AUM” is defined as all AUM.¹ Fund figures include reinvestment of income. Indices are not available for direct investment.
About Gator
Gator Capital Management, LLC was founded in 2008 by Derek Pilecki and is located in Tampa, Florida. Gator Capital Management is registered with the SEC as a Registered Investment Advisor. Registration of an investment advisor does not imply any level of skill or training.Gator manages Financials sector long/short portfolios for private partnerships, mutual funds, and separately managed accounts.
Investment Terms
Gator Financial Partners, LLC
Gator Financial Partners Offshore, Ltd.
Gator Qualified Partners, LLC
Fund Structure
3(c)(1) fund U.S. on-shore flagship
Cayman-based offshore feeder to flagship fund
3(c)(7) fund for Qualified Purchasers
Management Fee
1%
1%
1%
Incentive Fee
20%
20%
20%
Other Expenses
0.17%
0.24%
0.20% (Expense Cap)
Primer Brokers
Interactive Brokers (IBKR) & Jefferies (JEF)
Interactive Brokers & Jefferies
Interactive Brokers
Legal
Kilpatrick Townsend
Kilpatrick Townsend
Kilpatrick Townsend
Auditor
Kaufman Rossin & Co.
Kaufman Rossin & Co.
KPMG
Third-Party Fund Administrator
Ultimus Leverpoint Private Fund Solutions
Ultimus Leverpoint Private Fund Solutions
Ultimus Leverpoint Private Fund Solutions
Minimum Investment
$250,000
$250,000
$500,000
Lock-ups
No
No
No
Liquidity
Monthly
Monthly
Monthly
Redemption Notice
10 Business Days
10 Business Days
10 Business Days
Transparency
Portfolio Positions Released Quarterly
Portfolio Positions Released Quarterly
Portfolio Positions Released Quarterly
Gator Financial Partners Offshore, Ltd. Monthly Performance, net of Fees
Year
Jan
Feb
Mar
Apr
May
Jun
Jul
Aug
Sep
Oct
Nov
Dec
YTD
S&PFinancials
2026
5.46%
(6.35%)
(6.27%)
7.13%
1.16%
5.74%
6.08%
(0.36%)
2025
7.01%
(2.16%)
(5.28%)
0.38%
7.84%
5.60%
6.59%
3.99%
0.21%
(5.27%)
5.63%
3.89%
30.90%
14.34%
2024
1.47%
3.33%
5.23%
(2.39%)
4.17%
(0.66%)
11.50%
(1.74%)
0.87%
1.61%
18.06%
(5.05%)
40.30%
29.78%
2023
15.80%
1.37%
(13.70%)
6.97%
(1.33%)
6.88%
10.42%
(2.68%)
(0.23%)
(2.53%)
9.00%
9.41%
42.42%
11.66%
2022
1.12%
0.63%
(5.90%)
(4.04%)
1.25%
(12.12%)
8.01%
3.23%
(13.49%)
10.79%
3.75%
(4.16%)
(13.12%)
(10.21%)
2021
(0.30%)
6.68%
3.01%
1.86%
0.95%
(2.13%)
0.92%
1.22%
0.59%
1.29%
(1.05%)
7.72%
22.30%
34.55%
2020
(2.52%)
(11.34%)
(36.53%)
21.64%
7.19%
10.24%
4.99%
6.46%
(0.19%)
5.88%
16.20%
8.62%
17.54%
(1.91%)
2019
17.62%
4.17%
(2.55%)
4.32%
(5.21%)
4.86%
0.98%
(5.28%)
9.61%
0.80%
2.65%
3.14%
38.53%
31.22%
2018
8.57%
(2.48%)
(4.61%)
1.15%
0.35%
(0.17%)
4.00%
0.12%
(1.35%)
(7.59%)
(0.43%)
(14.08%)
(16.89%)
(13.03%)
2017
1.16%
5.51%
(3.60%)
1.02%
(3.81%)
2.97%
4.71%
(3.30%)
4.62%
(1.17%)
3.58%
5.01%
17.25%
20.89%
2016
(13.03%)
1.79%
9.46%
4.36%
2.83%
(9.31%)
13.57%
4.80%
(0.84%)
1.68%
25.56%
5.55%
49.97%
24.28%
2015
(6.15%)
3.56%
(1.93%)
3.67%
0.68%
(0.40%)
(4.33%)
(4.00%)
(6.15%)
4.01%
2.40%
(9.43%)
(16.89%)
(0.72%)
2014
(2.56%)
(0.46%)
0.94%
(2.56%)
1.66%
(2.65%)
(3.35%)
(0.18%)
(0.40%)
(9.28%)
11.80%
Gator Qualified Partners, LLC Monthly Performance, net of Fees
Year
Jan
Feb
Mar
Apr
May
Jun
Jul
Aug
Sep
Oct
Nov
Dec
YTD
S&PFinancials
2026
5.52%
(5.82%)
(5.16%)
6.76%
0.91%
5.80%
7.42%
(0.36%)
2025
5.58%
3.99%
0.37%
(5.29%)
5.20%
6.49%
16.92%
5.41%
DISCLAIMER
This document is provided for informational purposes only, is confidential, and may not be reproduced or circulated without the prior written consent of Gator Capital Management, LLC. It does not constitute an offer to sell or a solicitation of an offer to buy any interest in Gator Financial Partners, LLC, Gator Financial Partners Offshore, Ltd., or Gator Qualified Partners, LLC (the “Funds”). Any such offer will be made only to Accredited Investors or Qualified Purchasers by means of a Confidential Private Placement Memorandum (PPM). Past performance is not a guarantee of future results.An investment in the Funds is speculative and involves a high degree of risk, including the possible loss of principal; there is no assurance that investment objectives will be achieved or that any investor will receive a return of capital. Investors in Gator Financial Partners, LLC and Gator Financial Partners Offshore, Ltd. (each a 3(c)(1) fund) must qualify as “Accredited Investors, ” and investors in Gator Qualified Partners, LLC (a 3(c)(7) fund) must qualify as “Qualified Purchasers, ” as defined by the U.S. Securities and Exchange Commission.Interests in the Funds are subject to substantial restrictions on withdrawal, redemption, and transfer, and no secondary market exists or is expected to develop. Investors must be prepared to bear the economic risk of an investment for an indefinite period. The Funds’ fees and expenses may be substantial and may offset any profits. Prospective investors should consult their legal, tax, and financial advisors regarding eligibility and suitability prior to investing.Comparisons to indices are for illustrative purposes only. The S&P 500 Total Return Index and S&P 1500 Financials Total Return Index are unmanaged, market-cap-weighted indices representing the broad U.S. equity and financials markets, respectively. Indices are not subject to fees or expenses, and an investment cannot be made directly in them. The Fund’s portfolio differs significantly from these benchmarks in terms of holdings, risk profile, and concentration; therefore, these indices should not be considered a proxy for Fund performance.
Gator Capital Management logo featuring a stylized alligator head silhouette next to the text ‘GATOR CAPITAL MANAGEMENT’.Gator Capital Management, LLC 2502 N. Rocky Point Dr., Suite 665 Tampa, FL 33607(813) 282-7870 investorrelations@gatorcapital. com
Original Post
Editor’s Note: The summary bullets for this article were chosen by Seeking Alpha editors.