

 Q2 2024 Earnings Call Transcript")

")
In this article, we catch up on Q1 results of the Business Development Company Fidus Investment (NASDAQ:FDUS). FDUS trades at a total dividend yield of 11.9% and a 102% valuation. FDUS invests in the lower middle-market segment and is overweight the Technology sector.
Our key takeaway is that FDUS offers one of the best opportunities in the BDC market, particularly for investors who want to diversify away from the upper middle-market popular names like ARCC, OCSL, OBDC and others. The company continues to deliver very strong results but trades at an unusually low valuation for its performance.
Fidus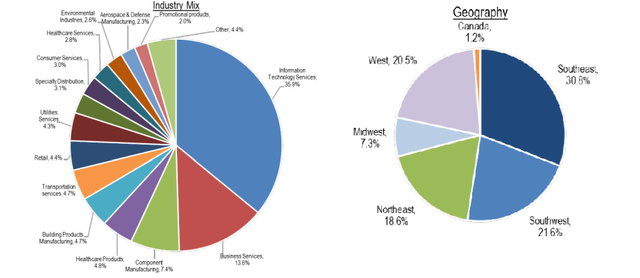
Quarter Update
Q1 adjusted net income fell to $0.59 – a second consecutive drop.
Systematic Income BDC Tool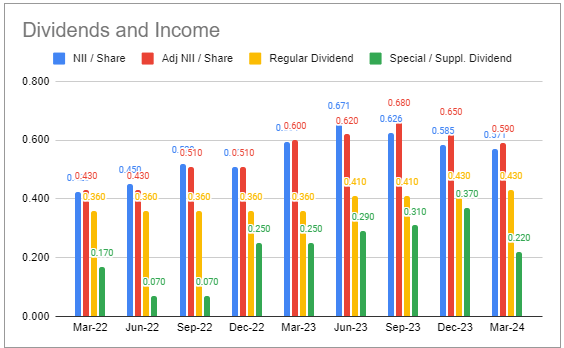
Interest income (blue bars) fell for the first time in a couple of years while fee income (green bars) fell below the typically seasonally-high December quarter. Apart from the fall in total investment income, another cause for the drop in net income was the 6% growth in the share count over the quarter. This second factor is a temporary drag on net income.
Systematic Income BDC Tool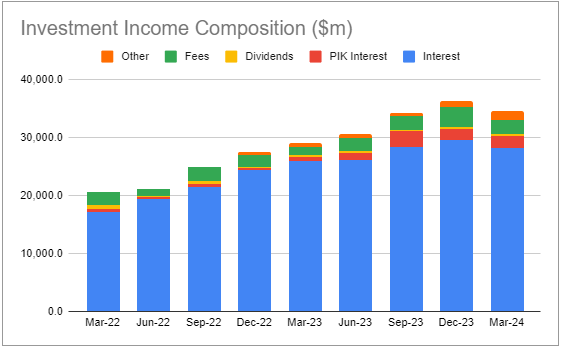
The company declared the same base dividend of $0.43 as in the previous quarter as well as a lower supplemental dividend of $0.16.
As many FDUS investors know, the company has an explicit dividend policy. The base dividend targets the floor the company expects to generate in net income while the supplemental covers the gap between net income and the base dividend. This makes its coverage 100% and means that the total dividend can be fairly volatile quarter-to-quarter. This relatively generous dividend policy also means that, despite a drop in dividend from last quarter, its dividend yield of NAV of 12.2% is more than 1% above the sector median and 0.7% above the average.
The NAV fell by a penny but has remained fairly stable over the last 18 months. Because the company does not retain any income, the trajectory of its NAV is likely to be less positive than that of the broader sector, all else equal. This is why comparing NAVs (rather than total NAV returns) is going to provide a misleading picture of FDUS health.
Systematic Income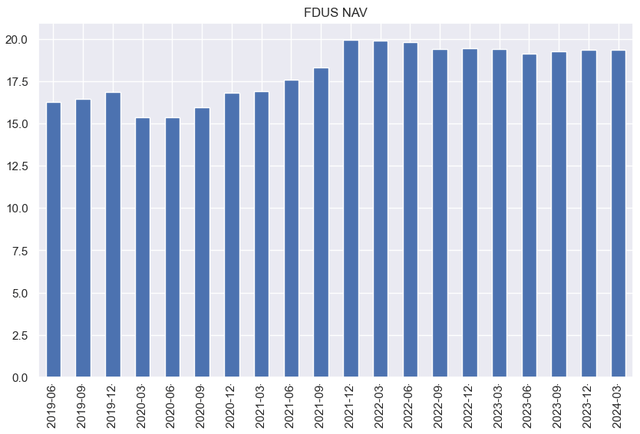
Income Dynamics
Net investments jumped during the quarter with first-lien investments accounting for 70% of the total. More than half of the investments were in 7 new portfolio companies, primarily through M&A transactions.
Systematic Income BDC Tool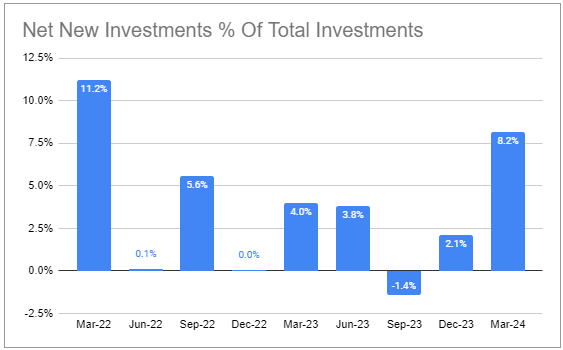
Leverage fell further, primarily due to additional equity issuance. The company’s very low level of leverage provides a risk mitigant to its relatively low first-lien portfolio.
Systematic Income BDC Tool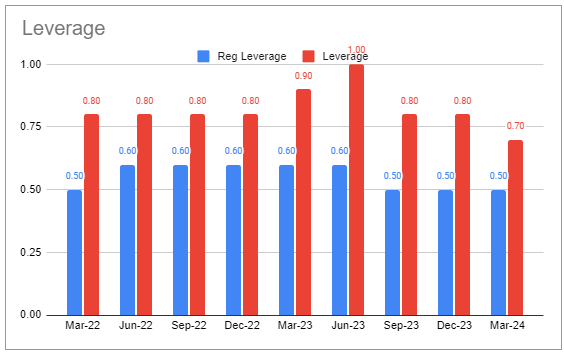
Portfolio yield has fallen off slightly. This is due in part to a tightening in spreads in credit markets, something that we hear across the board from different management teams. The company said that spreads are now tighter by 0.5-1% for lower middle-market and more than that for middle-market loans and above than a year ago. Originations came in at a weighted-average yield of around 12.9%, while repayments were closer to 13.7%, creating a headwind for portfolio income. New investments have been weighed more towards first-lien loans than the overall portfolio average, creating another income headwind. Management expect portfolio yield to be stable to lower over the medium term.
Systematic Income BDC Tool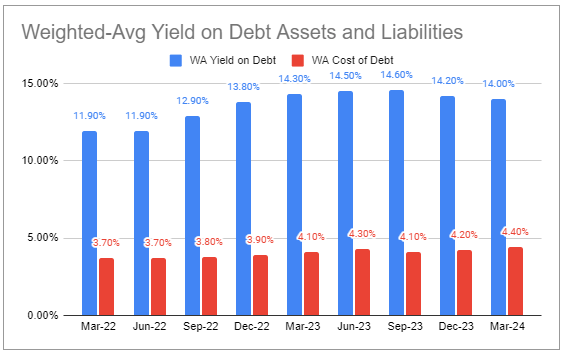
FDUS features the lowest level of interest expense in our coverage due to it having very little floating-rate debt. This is in contrast to an average BDC which has about half its financing coming from a floating-rate credit facility. Credit facilities are relatively expensive ways to raise cash – with a cost of around 7-8% – versus existing debt, much of which was put on over the previous several years when rates were much lower. This dynamic means FDUS is able to generate an above-average level of net income at a below-average level of leverage – a highly efficient situation. The first bond refinancing will be in 2026.
Portfolio Quality
There was no change in the company’s non-accruals. Management said that the two non-accrual investments continue to improve but remain higher-risk situations. Overall, non-accruals on fair-value are below the sector average however non-accruals at cost are in line with the sector average.
Systematic Income BDC Tool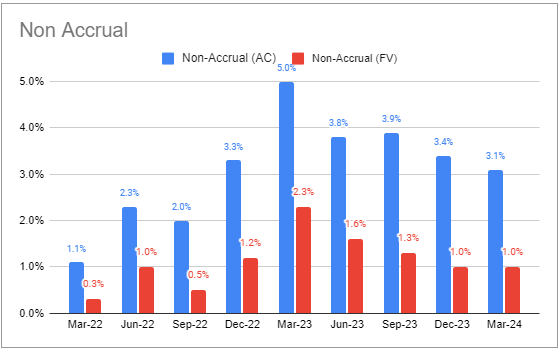
PIK ticked higher but remains below the sector average.
Systematic Income BDC Tool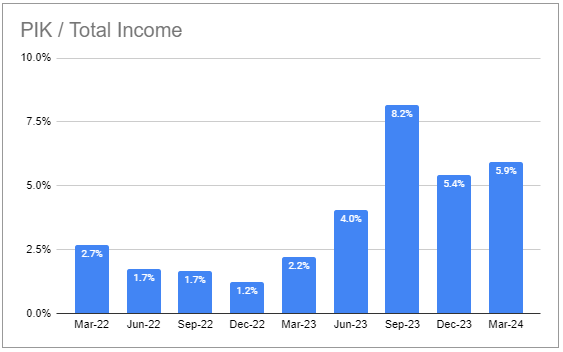
There was a small net realized gain, primarily from the sale of one equity investment.
Systematic Income BDC Tool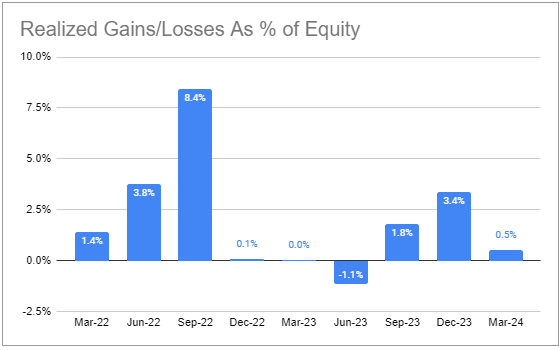
The first-lien allocation of the portfolio has been rising as equity investments have been sold down. The company has also been tilting towards first-lien investments in new lending. That said, its first-lien allocation is on the low side in the sector.
Systematic Income BDC Tool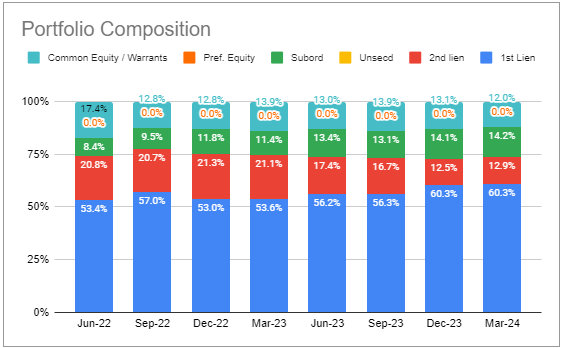
Management mentioned that its loan-to-value of the portfolio was just under 40% – which looks to be on the low side in the sector – another positive.
Return And Valuation Profile
Despite being somewhat under the radar, FDUS remains one of the strongest-performing BDCs.
Systematic Income BDC Tool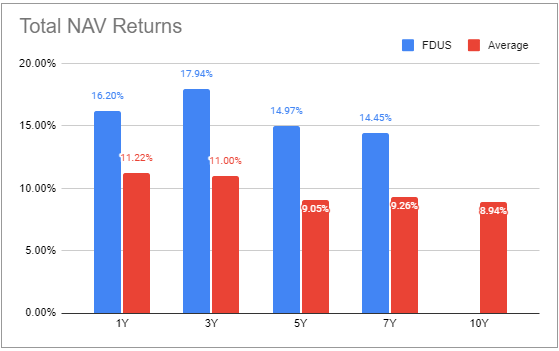
FDUS has consistently outperformed the sector on a twelve-month trailing basis (yellow line staying above zero).
Systematic Income BDC Tool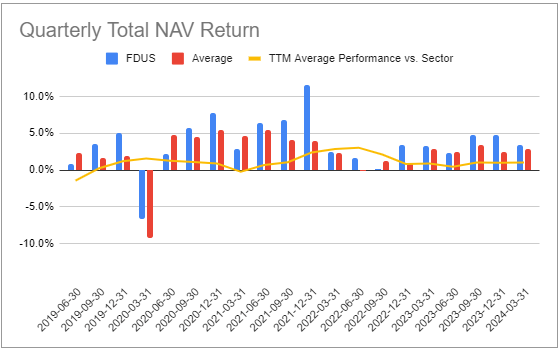
The company’s valuation has tended to be fairly modest – rarely exceeding 110% despite its strong and consistent track record.
Systematic Income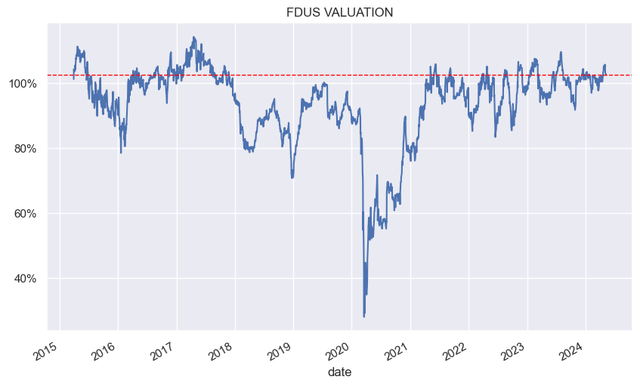
After surging to a sizable premium relative to its sector in 2023 it is currently trading at a valuation below the sector average – an odd contrast to its outperformance.
Systematic Income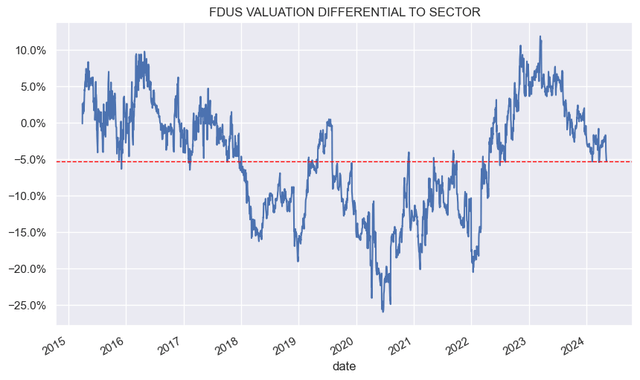
Although FDUS is not the highest performer in our coverage in absolute terms, it is as a function of its valuation – something which matters much more for investors.
Systematic Income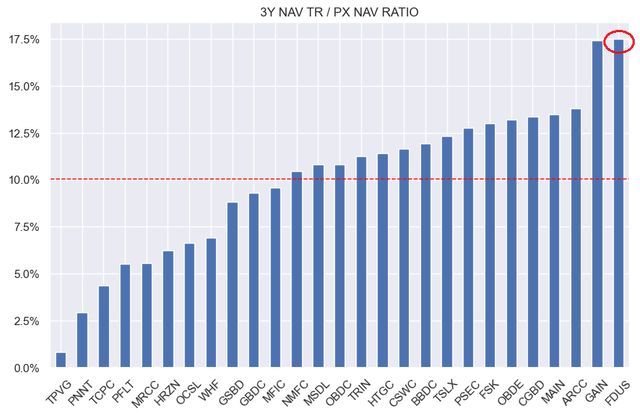
FDUS shares our highest BDC allocation across our Income Portfolios. We have now moved it back to a Buy rating from Hold in our High Income Portfolio.


