


Volatility Without Deterioration
The goal of this letter is to provide transparency into our market views and portfolio positioning for our investors. In an environment dominated by headlines and short-term narratives, long-form communication allows us to better contextualize both macro developments and company-specific fundamentals.
To start we’ll state that we’re not taking the Middle East conflict lightly. The majority of the G10 central banks were expected to cut interest rates this year but higher oil prices will boost inflation and those rate cuts have been put on pause. Renewed inflation and therefore higher interest rates can have extreme impacts on stocks, which was seen in full force in 2022. The market was pricing in 2 rate cuts for the Fed this year, but with Iran and the price of oil, the market is now pricing in zero rate cuts. We view this as the main reason behind the broad sell-off in the stock market. There are left tail risks if this war escalates and broadens geographically, compounding the oil shock and supply chain disruption.
As an investor, you have to ask yourself what is your edge in a market like this? Our edge in this environment is not macro forecasting – it is depth of understanding. We run a concentrated portfolio, allowing us to underwrite each business with a level of detail that gives us confidence in forward earnings power, regardless of short-term macro volatility.
Each of our largest investments is set to have their best financial performance in their history in 2026. 1
Iran, Oil, & Inflation – Middle East Conflict
The stock market is currently in the shakeout phase. This is similar to the liberation day tariff debacle or the start of the Russia Ukraine war. At the time no one knew what the overall impact would be. Both from degree and length of time. Each time there is an “event” like this, the investor’s reaction is to sell stocks, which means the stock market’s reaction is to broadly decline.
Our reaction to the tariff announcement and Ukraine war was to analyze each of our investments and assess if there would be an impact specific to each company.
The same can be said for Iran. There are a few small Canadian companies that have direct exposure to the Middle East. We have avoided those. The knock-on effects for some companies will be higher input prices, compressed margins, lower demand, delayed supply chains, and overall, more uncertainty for business performance going forward. This is a wide spectrum with certain industries and certain companies impacted to a much higher degree than others. But again, we’re in the shakeout phase where the entire market sells off first and then becomes more discerning as the rhetoric cools.
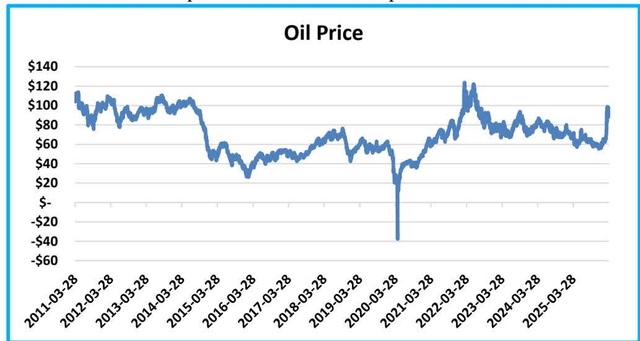
Below is a chart of the price of oil since 2 011 to provide context. 2
The question of duration is an interesting one. If you go back and look at the media headlines in February 2022, the dominant media and expert narrative was that the Ukraine war would be very short. That Kyiv could fall within days. Obviously that war is still ongoing.
What is interesting from an investing perspective is the reaction in commodities and stocks at the onset of that war (*not ignoring the global monetary tightening during this time).
Nickel spiked 95% – back to trend 4 months later and 23% lower than the start of the war 5 months later.
Wheat spiked 79% – back to trend 3 months later and 10% lower than before the start of the war 6 months later.
Potash spiked 53% – back to trend 6 months later and down 61% from before the war started a year later.
Natural Gas spiked over 200% – back to trend a month later.
Oil spiked from $92 to $123 – back to $92 a few months later and at $72 by year end.
Chart 1: The World Is Much Less Dependent On Oil
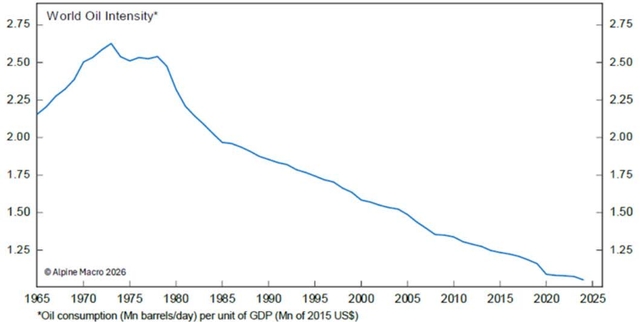
Source: Alpine Macro, British Petroleum, World Bank
Energy intensity has declined meaningfully as less energy is required per unit of GDP. Oil shocks like this one still matter, but using analogies from the 1970s doesn’t work. The unknown right now is obviously the magnitude and duration. Does it last another week or another year(s)? Does oil settle at $70, $100, $150?
Meanwhile, gasoline prices remain a significant part of middle-class consumer spending, and crude prices have an important impact on overall inflation and, by extension, monetary policy. By and large, high and rising oil and/or natural gas prices act like a tax hike for consumers, depressing their spending but propping up inflation (consumer spending accounts for 70% of GDP).
That being said, raising interest rates doesn’t solve supply issues and is more useful for curbing demand. Near term inflation expectations have risen based on the price of oil. Longer term inflation expectations, which are more tied to wages, services, and consumption still remain subdued. Expect any interest rate cuts to be tabled until the price of oil stabilizes.
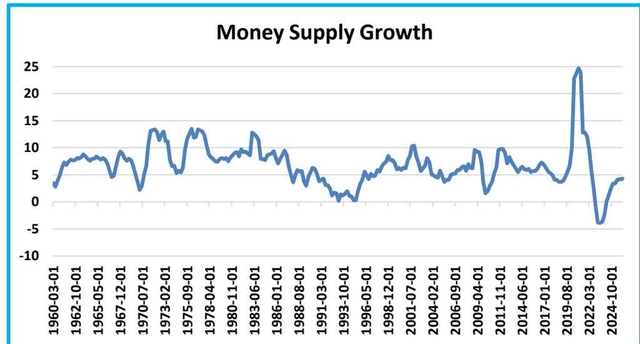
We are not trying to understate the seriousness of the situation, but what is different this time is the M2 money supply. COVID-era fiscal and monetary expansion drove unprecedented money supply growth with year over year dollar growth reaching 25%. The average money supply growth since 1960 has been 6.8%/year and we’re currently at 4.3%.
Positives Currently in the Economy
Okay, let’s move on from the war. There are some tailwinds supporting the economy here.
- The US expects Americans to receive 17% higher tax refunds this year due to new deductions in the “One Big Beautiful Bill” (OBBBA).
- 2026 capital expenditure is set to increase significantly as OBBBA now allows for 100% bonus depreciation (full expensing).
- Immediate expensing → lower after-tax cost (~21%)
- Higher IRRs → front-loaded tax shield
- Accelerated reinvestment → compounding effect
- This allows companies to write off investments in the year they are incurred, reducing after-tax cost of new machinery, fleets, equipment by roughly 21% (they get the tax shield immediately versus over 10-20 years)
- This rule encourages companies to boost investment
- By being able to expense all investment in year 1, IRRs from investment go up because cash tax savings come up front
- We haven’t heard or read anyone explain it this way, but this is why all the large cap tech companies like
- This rule encourages companies to boost investment
Amazon (AMZN), Microsoft (MSFT), Alphabet (GOOGL) have stated that their capex budgets are equal to the projected net income.
-
- If they spend $100B in capex in 2026, they save ~$20B in taxes in year 1 instead, instead of ~$1B over 20 years. The compounding nature of this is important because now they have an additional $20B for investment next year they wouldn’t have otherwise, and it makes the IRR of the $100B investment much higher.
- This math applies to all AI, Semiconductor, Energy, LNG, Industrial companies making investments in 2026
- AI data center spending is projected to increase over 100% to +$650B
- The tax benefits are estimated to increase company free cashflow by 9%
- Using the S&P 500 as a gauge, stock market earnings are set to grow ~14% in 2026, close to double the normal rate
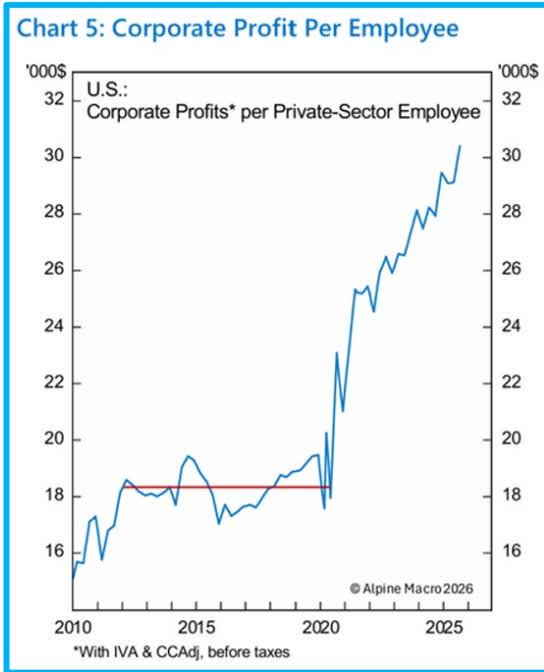
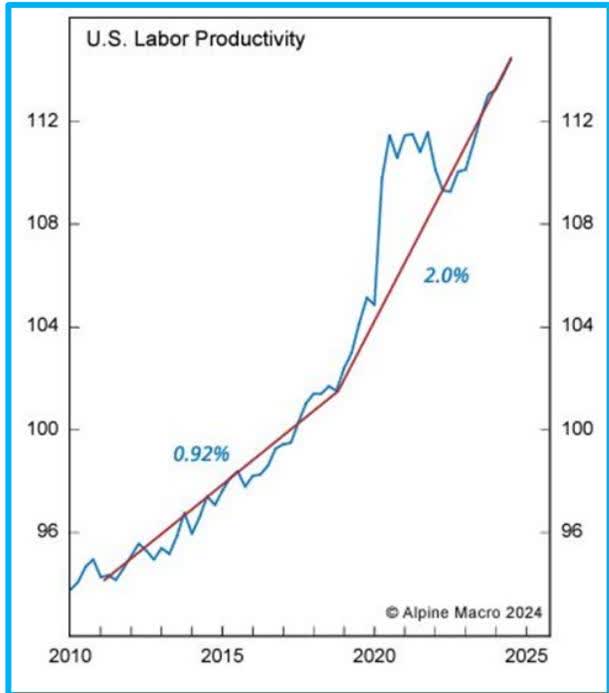
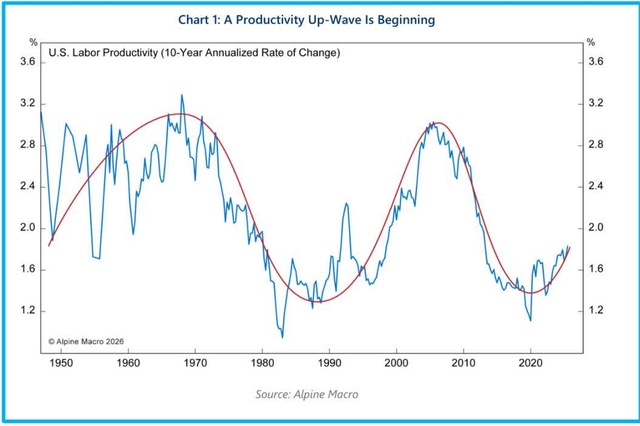
Productivity
Every 1% labour cost saving translates to a 2% increase in earnings for S&P 500 companies, but the same 1% labour cost saving translates to more than 6% increase in earnings for small cap stocks.
- A tech-driven productivity boom is unfolding.
- ChatGPT business users saved 40-60 minutes daily on average, with power users reporting productivity gains of over 10 hours per week
This asymmetry is critical: productivity gains disproportionately benefit smaller companies, where cost structures are more sensitive to incremental efficiency.
Perspective
One of the frustrating parts of investing is owning a stock where you know the company is doing really well, growth is good, earnings are strong, it isn’t expensive, and the company continues to execute, but the stock itself declines. A stock can sell-off for many reasons unrelated to its business performance. For example, investors want to own more gold stocks or more oil stocks, well that capital has to come from somewhere, or the market is correcting and certain investors are getting margin called, forcing them to sell stock to raise capital. Even in institutions, a portfolio manager might be comfortable with what they own, but their boss or a systematic risk strategy tells them to “de-risk” forcing them to raise cash, meaning they need to sell portions of their positions across their portfolio (examples of mechanical selling can be seen in risk-parity funds, volatility targeting funds, etc.). It could be something even more exogenous like how private credit funds are limiting withdrawals of funds and investors need to get liquidity from somewhere and their public company stocks are their liquid choice. The point being, investors need to do their best to discern between stock weakness and business performance weakness.
We recently had a conversation with one of our new investors and they framed our fund and investing strategy as a private equity mentality in public markets. Their point being, if someone was meeting with a private equity manager who had 10 investments in their fund, the questions wouldn’t necessarily be focused on their outlook on interest rates, impacts of Iran, or tariffs. The questions would be focused on the 10 underlying companies and how they were doing. Are the companies growing, increasing margins, taking market share, etc.? This is how we view investing and long-term performance. Are the companies you are invested in generating high return on capital, did you buy them at cheap or fair valuations, do they have solid balance sheets?
At this point, we could go off on a tangent on how much of private equity’s success is centered on volatility laundering. Private equity is seen as being more “safe” than public equities mostly because the asset prices aren’t priced daily and so the investor doesn’t feel the volatility. In practice, these investments aren’t less risky, actually the opposite, they are the same types of businesses, on average carry significantly more debt, and they take away investor liquidity. More debt and no liquidity shouldn’t equal less risk. This is a good example of why using volatility as the basis for risk is flawed.
If you ran your own business, it could be a law office, a farm, or a plumbing company, and each day at 9:30AM someone calls and offers to purchase your business. You know how much your business is worth. On days where the person on the other end of the line quotes a low price, you ignore them and hang up. You continue to run your business. You find that the person on the other end of the daily calls can be erratic, their offers can fluctuate considerably even though you know your business is performing the same. The more erratic the calls the more risky the market would say your business is. One day you read in the paper there is a massive conflict in the Middle East, the daily caller tries to lowball you that day. You, however, can wait and use the caller’s volatility for your benefit. One day they call and offer a price well above what you think the business is worth, you now use this volatility to your advantage and sell above intrinsic value.
In our last newsletter, we used specific examples to highlight how a company’s stock price can decline even as the business performs well, but if the company continues to perform that value will be recognized. We’ll highlight a few examples again.
For example in 2022:
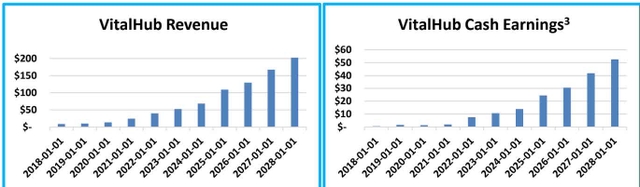
- VitalHub (VHIBF) sold off – 3 6% , as their revenue increased 62% & cash earnings increased 129% 3
- Propel (PRLLF) sold off -55% , as their revenue increased 76% & cash earnings increased 89% 3
- MDA (MDALF) sold off -50% , as their revenue increased 35% & cash earnings increased 95% 3
- Kraken (KRKNF) sold off -41% , as their revenue increased 60% & cash earnings increased 170% 3
We were adamant that these stocks and others had gotten way too cheap, and the forthcoming rebound would eventually discriminate between the winners and losers and therefore these stocks would realize their true value.
Over the next 24 months:
- VitalHub would increase in value by 325%
- Propel would increase in value by 394%
- MDA would increase in value by 367%
- Kraken would increase in value by 366%
Our Fund, the Capital Ideas Fund, would increase in value by 141% over this same time frame.
Company Specific Comments
We need to start with a review of GoEasy (EHMEF), Propel and Constellation Software (CNSWF).
GoEasy (GSY)
We sold our entire position in GoEasy in December 2025 at $123-124/share. This was after selling a majority of the position in August around $200-205/share then adding it back in November-December at $122-165/share.
The danger about being vocal and open about what you own can be that you come to defend your positions, and you are less likely to change your opinion. You can become married to investments and dismiss opposing views. We first started investing in GoEasy at $27/share in 2017. Over the years the company executed well, even against heavy criticism at times. This past September there was a negative report published on GoEasy, that initially appeared like others that had been published in the past, and in our opinion lacked hard evidence, but we were wrong. That report made us dig in deeper and with the help of AI, we found legal filings against GoEasy’s subsidiary Lendcare. They had violated consumer protection laws in Alberta and were ordered to cease engaging in direct sales practices. These findings made us sell our position the next day.
Propel (PRL)
We reduced our weighting in Propel from an 8% weighting at the end of October 2025 to 1.0% weighting in January. We significantly reduced this position based on how it would react in relation to GoEasy, but also due to how the US government shutdown would impact its business.
Propel reported Q4 earnings on March 3, 2026, the stock declined ~12%. Most of the weakness in their quarter was due to the government shutdown plus them ramping lending in December 2025. With new loans they have to take loan loss provisions on day 1 but the loan revenue occurs over the life of the loan, so accelerating your loan growth makes the company appear less profitable in the short term.
Propel only has 2% exposure to the Canadian market but the stock still has trades in a similar manner to GoEasy. If Q4 2025 did mark the bottom for provisions and performance should improve from here, then the stock is cheap and should do well from these levels. We are going to wait for confirmation before adding back to this investment.
Constellation (CSU)
As previously discussed, we sold our Constellation investment in 2025 at $3,250-$3,760/share. We made this decision due to three factors.
- Mark Leonard stepped down from his position as CEO (this past Friday it was announced he stepped down from the board as well).
- Constellation is now more difficult to model and therefore value. Historically, they acquired companies at ~0.8x sales, they would take those businesses’ cashflows and buy more companies at ~0.8x sales. They proved to the market that they could scale this investment engine which allowed CSU’s stock to trade at 4-6x sales. Obviously buying companies at 0.8x sales and being valued yourself at 4-6x sales gives each dollar deployed on acquisitions a massive multiplier effect. However now, they are expanding their capital deployment to include minority investments in public companies. They may make money on these investments, but they don’t receive the cashflows and don’t get the capital to feed the engine like they do when they control a business.
- Constellation owns over 1,500 different vertical market software companies. This makes them diversified across industries, geographies, and customers. However, with so many companies it is hard to assess the impact of AI on each business. We still believe AI is a net benefit to many software companies that “own” the client and are knowledgeable and close to their client’s workflows. But without being able to parse the 1,500 companies you have to assume some of those companies will be negatively impacted. Is it 5%, 10%, 20%? We can’t answer that question, and if we can’t answer that question, we can’t realistically model the business, put a value on it, and have the conviction to invest.
By selling CSU & GSY in 2025, we are now sitting on ~10% cash, allowing us to be strategic here and patient for deals.
We detail developments and outlook for some of our largest investments below. These companies have idiosyncratic elements to them. A proprietary piece of technology that the market doesn’t fully understand yet, a strategy or business model that is hard to see from initial reviews of the financials, or companies undergoing strategic processes that should unlock significant value. What they all have in common is increasing revenues and earnings, plus are on pace for record years in 2026.
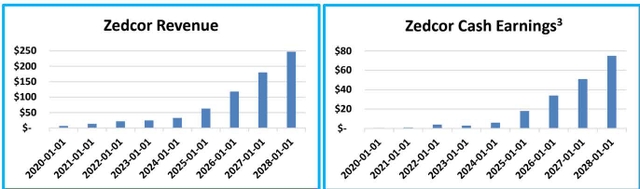
Zedcor (ZDCXF) (ZDC)
Zedcor is a great example of the human emotion tied to investing. Last week the stock was down ~10% one day and we had many people reach out asking what was wrong with the company. For sure bad news would lead the stock to go lower, but there hasn’t been any news at all. We’ve been monitoring their hiring trends and visiting locations and there is no sign of weakness. A majority of stocks have declined recently, as discussed above, but emotionally investors jump to the conclusion that something is wrong with the business based on the stock price.
Zedcor raised $30M at $6.00/share in February. This is enough capital to build ~100 towers so reading between the lines, we expect they have a large order coming from someone like Amazon or Kroger (KR), who they have been working on for a while, and needed the extra capacity. We are still very bullish on Zedcor as they still have a long runway for growth. They are currently doubling their salesforce this year and have the opportunity to 4x the number of regional hubs they have. A common pushback we hear is that the stock is expensive, but if you model out the financials instead of looking up the PE on Bloomberg or Yahoo Finance, you’ll see it is on 10x 2027 cash earnings while growing revenues +90% and earnings +100%. 2 We’re planning a trip down to Houston soon to see the expanded manufacturing facility.
The idiosyncratic element to Zedcor is that they depreciate towers much faster than they actually need maintenance capex, which is good for the business because it reduces taxes paid and leaves more cash for investment but makes it harder to calculate ROE. Adjusting for real asset value, Zedcor’s ROE is actually around 28-30% 2 , which makes sense based on the unit economics of an individual tower and factoring in utilization rates.
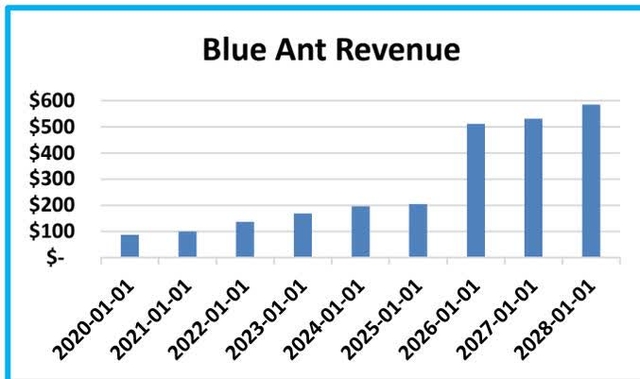
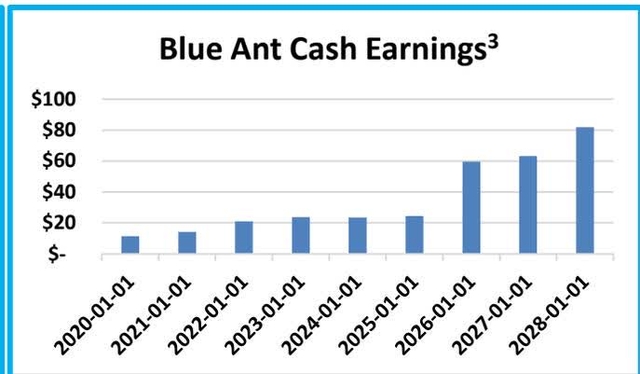
Blue Ant (BAMIF) (BAMI)
For those of you interested to learn more about Blue Ant, their investor presentation is a good primer, but we would also suggest looking through their content catalogue to understand the diversity and breadth of programming. Their content is sold in over 100 countries on over 300 platforms with over a billion global views per month.
An investor willing to do the work has an edge when it comes to Blue Ant because the stock is new to the market and hasn’t gone through the price discovery process yet. The company’s financial estimates don’t show up on Bloomberg, Factset, Yahoo Finance, etc. The company came public in an unusual way, and it will most likely take a couple quarters of reporting results before investors realize the earnings ability of the company. At the same time, some of the shareholders of past acquisitions shares are now able to be sold.
Before coming public, Blue Ant grew revenue 18% per year from 2020 to 2025 with 18% return on capital. The global streaming market is projected to grow over 20% per year for the next several years. Blue Ant received an additional $34.7M cash payout in March as part of the RTO process and is now sitting with a Net Cash balance sheet. Factoring in their recently closed acquisitions, but not projecting more M&A, the stock is currently trading on 2.5x earnings. The stock is currently trading at $5.65/share and we think it is worth ~$20/share with upside from there as they are sitting on cash and expect to acquire additional libraries of content.
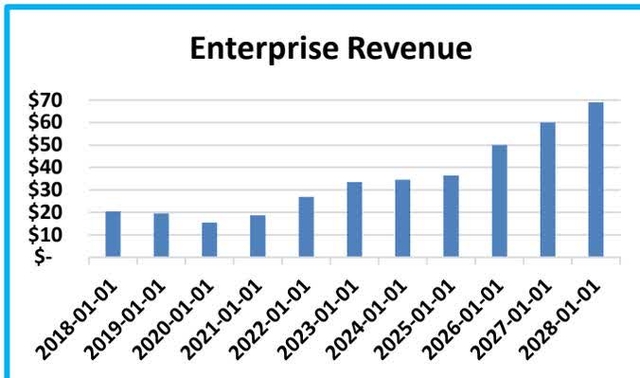
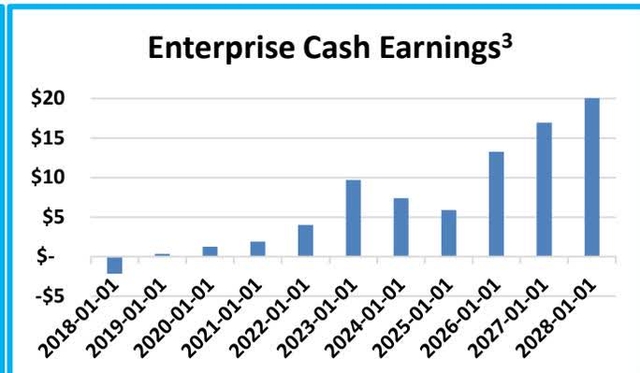
Enterprise (ETGDF) (E)
Enterprise was facing 3 headwinds in 2025 that have turned into tailwinds in 2026.
- • The LNG Canada was delayed in 2025, and it took a while to reach full utilization, which only happened in March 2026.
- • The price of natural gas in Canada was weak in 2025 (even went negative) but has since rebounded.
- • One of their largest clients was undergoing a large asset sale and stopped activity during due diligence but that client has since returned to the market in full form in 2026.
2024-2025 was a time of growth capex investment for Enterprise and now they will see those investments pay off and cashflow should inflect higher. They now have the assets in place to do $55-$60M in yearly revenue. That being said, they’re adding more turbines based on client demand and will finish the year with a higher revenue potential. The timing of Enterprise’s capex investments is well timed as 2025-2026 is just the start of the inflection higher for Canada’s natural gas market.
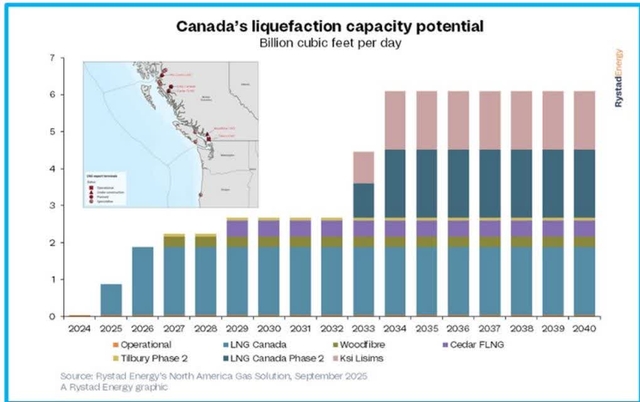
Canada’s liquefaction capacity potential chart and map. The chart shows capacity in Billion cubic feet per day from 2024 to 2040, with a map of Canada highlighting liquefaction sites.
VitalHub (VHD)
VitalHub is our only software investment at the moment. There’s more nuance in the software landscape than just AI as an existential risk. Not all software companies are created equally, but they are all being treated the same right now. This dislocation creates an opportunity. The amount of support, integration, management of the modules/solutions and relationships is the moat. Some software has a lot of this, and some doesn’t. The hard part of software was never writing the code. It was figuring out what the problem was and what the workflow needs to be and having access to the data needed to solve it.
Government healthcare funding for digital tools, like the ones VitalHub offers, is growing in order to drive efficiency given the rising demand and lack of capacity in hospitals and doctors offices. Doctors and nurses aren’t vibe coding products. Hospitals aren’t willing to take this risk. The “price” of a product in the RFP process isn’t the number one priority. Cyber security, workflow efficacy, and reliability are priorities that are much more important in this highly regulated industry. We can look at each of VitalHub’s products and see how defensible and how well they are doing in the market.
VitalHub completed most of their recent M&A integration in H2/25. EBITDA should grow ~35% in 2026 with close to 100% free cash flow conversion. We would urge investors to listen to the replay of the conference call. Specifically, management speaks to the rule of 40 and how growth in ARR plus profit margins get them above 40%. They also speak to how private equity is pulling back on competing on acquisitions and M&A activity is ramping up post integration efforts. VHI has $120M in cash on hand and will add another ~$35M from cashflow in 2026.
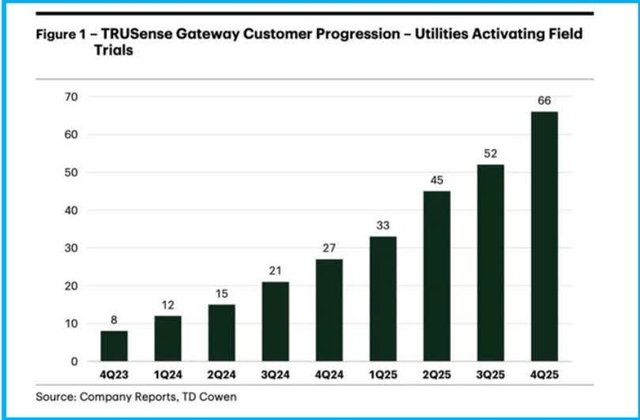
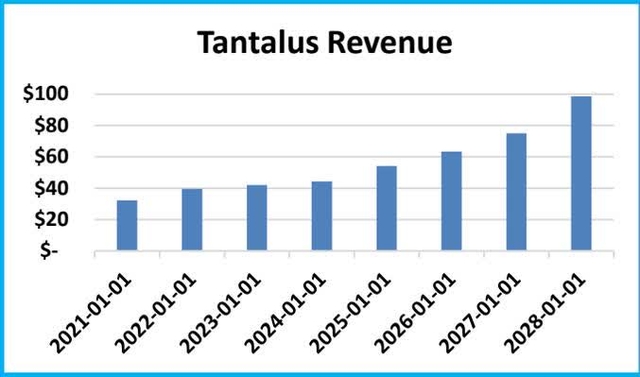
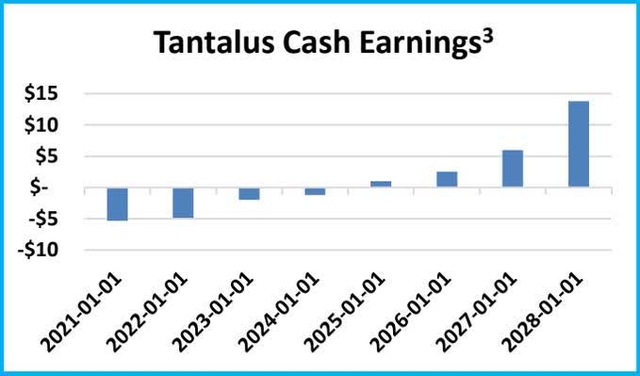
Tantalus (TLSSF) (GRID)
Tantalus is bringing intelligence to the electrical grid with data and analytics where there wasn’t before. They are a provider of smart grid solutions to public power and electric cooperative utilities. The company’s hardware devices, software applications, and related services automate, monitor, and control power flow, consumption, and quality to improve grid reliability.
Before coming public Tantalus had 18 consecutive quarters of profitability. They went public in 2021 in order to raise the capital needed to invest in the TruSense Gateway. They invested over $10M into the product and expensed it all, making the company look like they were losing money up front but are now scaling the final product and profits are inflecting higher. The chart below illustrates their commercialization progress. Utilities typically trial the TruSense Gateway for 12-18 months before committing to a purchase order. Tantalus hasn’t had a single trial user not convert to orders and revenue growth is now ramping as more and more users convert.
These utilities need to optimize power distribution. Tantalus’s product enables the utility to communicate with and analyze data between the substation, the meter, smart home appliances, or energy sources. Based on the data the utility can accurately load forecast, manage load/throttle load, and have much more granular insight into each specific house.
Outlook Summary
This is a very interesting and dynamic market. Overall, we are very optimistic about the companies we own, and a few should have some very good outcomes with significant upside over the coming months. That being said we have reduced exposure to certain companies and industries.
The uncertainty in the market is near highs and we’re digging into companies each day to make sure we own enduring businesses that will be able to continue to grow revenues and earnings in any type of market. Stocks in general sell-off from time to time as markets panic but great businesses that continue to grow and improve margins will do well, especially if you’re not overpaying and we’re seeing very cheap opportunities right now.
We’re currently working on getting two of our investments over their respective finish lines. One is coming public and one is working through a strategic process, most likely to be acquired, and both would provide significant returns to the fund.
Small caps since 2020 have continually gotten cheaper and cheaper versus large caps, now at the cheapest levels in over 3 decades.
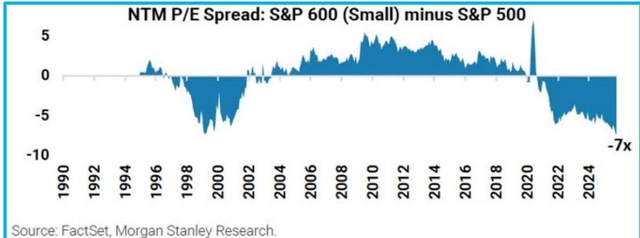
You can get growth without taking the valuation risk inherent in some of the large cap stocks right now. For small caps, there is liquidity risk and inherent volatility but the future earnings growth more than compensates in our view.
Conclusion
Due to selling Constellation and GoEasy last year, we are sitting on ~10% cash at the moment and now slowly picking up shares in these cheap growth stocks. Since we’re paying low earnings multiples for these businesses, as they continue to grow and increase their underlying earnings ability of their businesses, we have patience knowing that this will end up getting reflected in their stock price. Geopolitical events can shift sentiment, increase stock market volatility, and impact specific companies. Knowing what you own, why you own it, and its business performance trajectory allows you to look past stock price gyrations in the short term.
This market has similarities to the broad overreaction around Covid in March 2020, and April 2025 Liberation Tariffs. Yes, both would have negative implications on some companies but the broad sell-off was a shoot first and ask questions later which provided an opportunity to sift through and find the winners that were being treated the same as the losers.
We’re being selective, but this is the best opportunity set we’ve seen since at the 2022 bottom. We remain focused on the trajectory of revenue growth and earnings and see each of our largest investments having record revenues and earnings in 2026.
Feel free to reach out and connect with us.
Sincerely,
Jason & Jesse
References
- Top 7 investments, representing ~76% of investments as of March 30, 2026
- Prices per Bloomberg
- DKAM estimate, taking net earnings and adding back certain non-cash income statement items such as amortization of intangible assets
Original Post
Editor’s Note: The summary bullets for this article were chosen by Seeking Alpha editors.

 Q4 2025 Earnings Call Transcript")

