






The Case for Fundamentals
One of the benefits of regularly writing long-form newsletters about our outlook and analysis is that we get to have informed conversations with our investors. It is important to make sure that both parties are on the same page.
A common trend over the years is that a majority of the conversations will start with questions pertaining to whatever asset class is doing the best at that moment. Today that is the “AI Trade”, all stocks associated with the use and buildout of AI. Last year it would have been gold or silver. Before that, it would have been US large-cap tech stocks and bitcoin.
The chart below does a great job illustrating the historic move in momentum stocks, mainly driven by the AI trade.
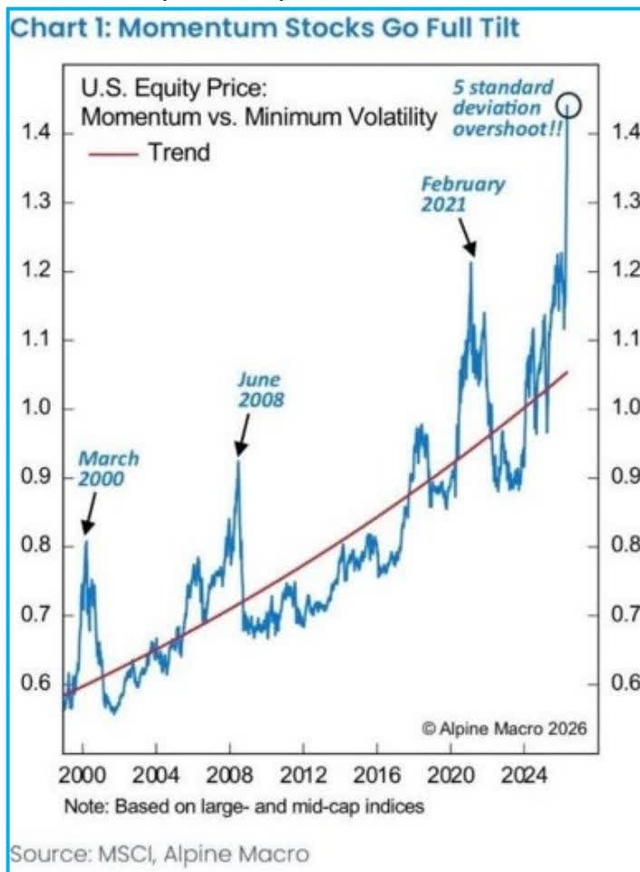
This chart illustrates how stretched certain trends can get over time. A 5 standard deviation move is an extremely rare occurrence. In order to have a 5 standard deviation overshoot, a lot of capital needs to flow into that asset class. To be fair, investors are currently making a lot of money in these AI related stocks, but the knock-on impact is that all the capital chasing this trend needs to come from somewhere else. There’s only so much money invested in the market at any one time. This leads to other sectors or asset classes getting ignored. So massive moves in one direction can create stretched valuations in the hot sector while creating offsetting discounts in other sectors.
Fundamentals
This may sound rudimentary or obvious, but investors or “the market” can shift focus. Shift to cyclicals, shift to materials, shift to commodities; one pretty much can shift focus to a “new” thing fairly regularly.
When we described how extended the current momentum stocks are, we would be remiss not to say that those companies are doing well fundamentally as well. Many of them are growing earnings at unprecedented levels, but the point to make here is that doesn’t mean the other sectors are doing poorly. Quite the opposite. AI related companies are doing well but there are great companies doing well fundamentally that just aren’t part of the hot trend. A company that continues to grow earnings is continuously increasing their intrinsic value. This means that everyday they are growing the value of the business even if their stock price doesn’t reflect it at the moment.
Many investors will articulate what their expertise is and how they exploit a niche but then chase other types of investments, usually the ones that are the hot trend. This is called style drift. For us, we know we are bottom-up, fundamentally driven investors. We invest in great companies that can compound their capital at high rates of return for a long time, we don’t “bet” on ideas or try and time where the market is shifting to next. Below we will illustrate why focusing on compounding earnings is so important.
Most of our investors have exposure to the large indexes like the TSX, S&P 500, or Nasdaq 100 through other investment vehicles. They don’t need us to give them even more exposure to the broad market. Just the opposite. They are looking for diversification and exposure to great companies they wouldn’t otherwise get.
1. Diversification
a. Most investors are over-exposed to large-cap stocks and taking significant valuation risk.
b. Our investments have no overlap with the major ETFs/Indexes plus they are growing earnings faster and cheaper at cheaper earnings multiples.
2. Risk to Return
a. The growth to valuation trade-off suggests significant upside from here like past troughs in valuation.
WHY WE FOCUS ON EARNINGS
The chart below highlights arguably the most important aspect of investing. Over the past 100 years, the correlation between stocks and corporate earnings is 0.98. Stock prices have followed the trajectory of earnings with great consistency. The blue stock price line looks like a pretty tame ride. We all know the stock market isn’t “tame” especially these days. Over this time, there was the Great Depression, World War II, multiple recessions, the dot-com crash, the 2008 financial crisis, and Covid. Taking a step back, over this time frame earnings have grown at ~6% per year and stock market returns have averaged ~6% per year.
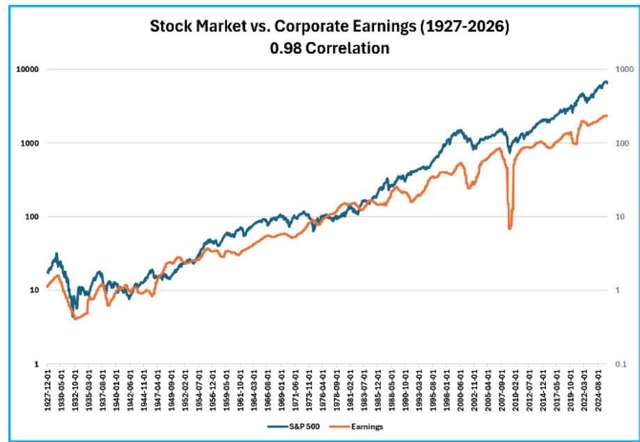
Taking this to heart, it seems simple enough. Over the long term, stocks are tied to earnings growth. But if you zoom in on any day, week, month and even year, stocks can trade on sentiment and ignore fundamentals, both on the downside in a panic and to the upside in euphoria. This has ALWAYS proved to be temporary. People can invest in “themes”, and those stocks may go up, but if the earnings don’t materialize, then the real economic value is eventually revealed.
Events like spiking gas prices, rising tariffs, rising interest rates, can lower a company’s earnings. This is where the idea of margin of safety comes into play. If you own a great company and earnings are growing but its valuation is high, then you’re taking on a lot of valuation risk and any bump along the road, like gas, tariffs, or rates, can severely impact the stock price. There is no margin of safety between operational execution and where the stock is priced. This is called being price to perfection and doesn’t leave room for error. On the other hand, having a margin of safety means the stock is growing earnings and executing well but still has upside to valuation (less downside). An illustration of this margin of safety can be seen in the table at the end of this newsletter where our Fund’s investments have higher growth than the overall market but trade at a fraction of the valuation. We get higher growth and take on less valuation risk, leaving a margin of safety.
Our top 10 investments are on pace to grow revenues 49% and earnings 52% in 20261. The number one driver of stock price return over time is earnings. So “the market” can jump around from idea to idea or bounce on headline to headline, in the short term. The long-term return is earnings growth, period. We expect our fund to provide returns to investors in-line with our investment companies’ earnings growth, over time.
Cycles and Valuation
We are currently finding great growth to value trade-off in small cap stocks. The S&P 600, which represents profitable small caps, is at its greatest negative spread versus large caps. After each of these extremes in the past, there has been a strong trend reversal.
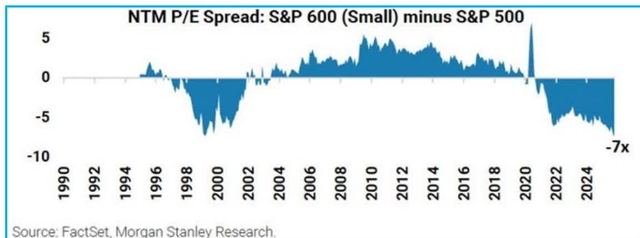
Source: FactSet, Morgan Stanley Research.
Artificial Intelligence Implications
There are two opposing arguments when it comes to AI right now. One is that AI is overhyped and won’t have as big of an impact as people think and the other is that AI is going to be so powerful and impactful that most companies and even jobs are doomed to survive.
The first group will point to a lack of real-world proof that it is happening. The other sees the world at the infancy of a massive exponential adoption cycle.
The chart below shows how CIOs are shifting their IT budgets. More of their budgets are being allocated to AI and less to system integrators, contact center software, vertical market software, etc. The stocks associated with the groups getting less of this budget have declined. This is why VitalHub (VHIBF) remains as our only software investment. VitalHub is using AI to enhance their offering but most importantly they don’t sell to clients who are investing in their own AI, but instead rely on VitalHub for those new capabilities (for both security, investment, and risk reasons).
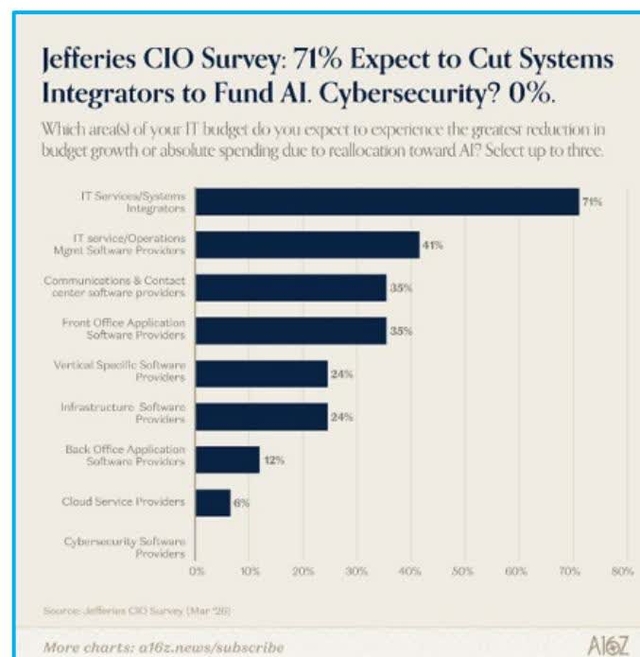
We are however now starting to get real world examples of companies developing their own vertical market software internally. The math can now make sense. Companies paying $1m per year in license fees can now create their own version for $5-10m, which isn’t a bad ROI, especially if it opens up the opportunity to better customize to your specific needs. A recent example was when Avis didn’t renew their contract with Verra Mobility because they could now replace Verra’s vertical market rental car software with in-house technology due to advances in the space. Verra’s stock plummeted on the news.
Another example is Zedcor (ZDCAF) who are actually developing their own AI software internally. We will give more details below, but the cost to develop their own software now provides an attractive ROI, plus it gives them the ability to customize the software to their particular needs which allows them to offer even more services to their customers.
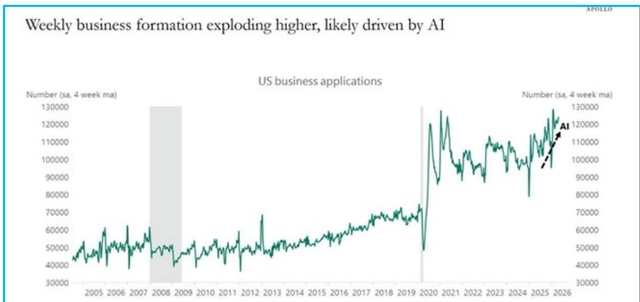
A final word on AI is that it does appear to be increasing new business formation. There are two sides to the coin. We need to have our eyes open for up-and-coming companies and potential investment opportunities, at the same time watching for new businesses that may disrupt other companies.
Specific Investments
In this section, we will go through the Q1 earnings of many of our investments, plus provide an outlook. You’ll see that these companies continue to grow and are deploying capital back into their businesses at high rates of return. We continue to judge the companies’ operational performance, judge their growth, judge their earnings, and judge their capital allocation decisions. The stock price will eventually reflect this performance.
A very recent and prime example of this is SSC Security (SECUF). We have been investors in SSC for about 3 years. The stock has never had any analyst coverage and is extremely unknown. That being said, management continued to grow the business and make decisions each day that moved the business forward. The company paid a dividend that yielded 5-6% and had been buying back stock, but the stock price hadn’t appreciated over the last 3 years. That was until the end of May when they announced they were getting acquired at a 118% premium. One, this illustrates that there is a lot of value in this segment of the market and two, the underlying value of the business will eventually be realized even if it isn’t seen in the stock price day to day.
Blue Ant (BAMI:CA)
Before coming public, Blue Ant grew earnings at a 15% CAGR over the past 5 years. The streaming sector is accelerating and expected to grow at a 24% CAGR 2024-2030. Blue Ant has produced $37M in EBITDA the last few years and their recent acquisition, Thunderbird, has been around $17M per year and they are pace for more than $7M in synergies. They have net cash on the balance sheet and the entire enterprise value of BAMI at the moment is $140M 2 , so you’re paying close to 2x EV/EBITDA for a company that is run by a management team that has previously RTO’d a company of similar size, grew its earnings at a 28% CAGR for 14 years, and then were acquired for billions. We believe the stock should trade for 7x EV/EBITDA, which would equate to ~$20/share versus the current $5.47 share price today.
The main question right now is how Blue Ant is different from other media companies and how they are succeeding in this environment. The main answer is that most media companies are regional, dependent on a specific market, and dependant on a specific technology like cable or streaming. Blue Ant has a multi-tiered and multi-focused revenue stream with a wide geographic reach. They own their own IP and have a diverse library, which allows them to take a certain asset and distribute it to dozens of countries through cable, fast TV, paid streaming, free streaming, etc. Blue Ant has a 20% IRR hurdle for M&A and they are able to attain this because they can buy a library of content from one market and immediately sell it across the globe. The strategy also makes sense for the acquisition of Magellan where they had a revenue share model for the programming, but now Blue Ant can use their own IP to fill the slots and receive full margin.
From a stock perspective, the company still hasn’t reported a full “clean” quarter after their RTO, merger with BoatRocker assets, plus acquiring Thunderbird and Magellan. Their Q3 & Q4 are their seasonally strongest quarters plus they will start to bypass all the go-public and transaction costs. For now, we think potential investors are putting the company in the “too hard” pile and want to wait to see the company’s true earnings ability. This is where we see the opportunity because looking through the noise one can see the real underlying business – the real earnings potential of the business. They report fiscal Q3 earnings on July 15th.
VitalHub Reported Q1 Earnings – Cash Earnings1 +35%
Profit margins continue to improve as they integrate the two deals done in 2025 and they should be back to previous high margins by Q3 2026. Their high margin ARR should continue to grow and add to the bottom line. They mentioned on their earnings call “Great progress on AI in the quarter. Starting to see customer uptake and productivity internally.” They have two AI products actively in the market now.
VitalHub currently has a relatively large amount of cash with no debt, and we expect some significant acquisitions in the second half of the year. They have historically compounded their cash earnings per share at more than 25% per year given high organic growth plus accretive acquisitions. The stock is currently trading like all other software stocks but given who their end customers are and earnings growing at +35% in the quarter, we believe it is only a matter of time before their earnings are given the respect they deserve.
Enterprise Reported Q1 Earnings – Cash Earnings1 +64%
It looks like by Q3 of this year the power generation side of the business should be more than 50% of the business and this why they are changing the name of the company to Evolution PowerX. Part of the investment thesis is a multiple rerating which should happen when the market appreciates the high margin, exclusive power generation side of the business.
The business is generating significant profit margins, and they continue to use the cash to invest in growing their proprietary turbine fleet which they believe will be fully utilized this year. They hired a full-time business development employee in Calgary a year and a half ago and now that sales cycle is starting to turn into contracts. They mentioned in the earnings release how three new clients are on pace to become three of their top five biggest clients. Their funnel is also full of companies looking to do their first pilot project with them and they are starting to get to a critical mass in the industry where there is enough buy-in from large players where they are getting inbound calls now.
The outlook for the business continues to improve. Natural gas prices are 30% higher now than a year ago and there are 30% more natural gas rigs in Canada than a year ago. In addition to the LNG Canada Phase 1 pipeline, there are 4 more LNG pipelines in different stages of development in Canada. Canada has a structural advantage when it comes to shipping natural gas to South Korea, Japan, China & Taiwan. It takes 10 days of travel versus 20 days from the Gulf Coast. A substantial share of global LNG has historically transited the Strait of Hormuz or other pinch points like the Panama Canal, Strait of Malacca, and Suez Canal. There are no pinch points from Canada’s West Coast. Countries around the world need to procure sustainable and uninterrupted supply. All of this is supporting a Canadian LNG Supercycle.
Zedcor Reported Q1 Earnings – Cash Earnings 1 +51%
- Canada revenue was $9.7M in the quarter +19%
- Canada cash earnings1 were $5.7M +21%
- US revenue was $9.7M +189%
- US cash earnings1 $3.6M +449%
Their Canada segment continues to grow and the US segment is expanding considerably. The financial implications of scale are significant. Zedcor has been investing in the up-front growth costs in the US and as the expenses level out, cash earnings margins should march ahead from 37% now to ~60%. This is segmented revenue and earnings and doesn’t factor in corporate costs, but much of that investment has now been made with their new facilities and new hires.
The major pushback we hear about the stock is that it looks expensive. We strongly disagree and believe most of the confusion is how people treat accounting financials versus actual operating financials. For example, the rigid accounting rules makes Zedcor depreciate their powder coated steel tower beams over a fraction of their actual useful life. Depreciation is supposed to be a proxy for maintenance capex spread out over the useful life of an asset. Zedcor reported $53K in maintenance capex in the quarter versus $3.7M in depreciation expense. The company expenses through the P&L any small expenses like electrical components and solar panel replacements. With profit margins continuing to expand and treating expenses correctly, we project the stock is trading on 8.8x 2027 EBITDA and 11x 2027 cash earnings, while growing revenue +60% and earnings +100%. If they hit their short-term target of 26 hubs, and they are at normal capacity/utilization, the company should be 3-4x more profitable than it is today.
We attended Zedcor’s investor day at the Houston headquarters on June 4 th . The main takeaways are below:
Technology
- Zedcor is developing their own internal AI monitoring software that will allow for more customization, and importantly increase the services they can offer their clients
- ZDC will own the IP of their own vertical of that software
- Zedcor is the only tower company that is tied into Direct2Dispatch, which is the software that enables Zedcor towers to stream directly into law enforcement dispatch centers and directly into police vehicles. When there is an issue, a police officer gets live footage from the scene as the incident occurs and before they arrive.
- Their cameras and software can now read license plates of cars going up to 70 mph
- AI at the edge cameras/software – decreased the number of staff needed on the backend
- Ability of a person to monitor alarms/towers has gone up 3-4x with this technology
Growth
- They are on target to open 6-8 new regions in 2026
- Their current plan is to get 26 regions in the short-term with the longer-term goal of 42 regions so they are within 6 hours of all their towers across the US
- When they open a new location (hub) it usually take 4-5 quarters to hit 100 towers deployed which gets them to profitability in that market
- The branches in the US that are more mature have more towers per branch versus Canada, and are actually more profitable than Canada. The US could actually be more profitable than Canada as it matures which is important because the Canada segment is already at +60% EBITDA margins
- Added a lot of salespeople in late October/November 2025 – these people are now getting up to speed and selling accordingly
- Large home builder just came on board and will most likely lead to a national account
▪ That client is immediately seeing a great ROI
○ Some large enterprise companies have competitor contracts coming due throughout this year – puts ZDC in great position
○ Internal forecasts have profit margins gradually increasing over the next 2-3 years
Case Study – DR Horton (DHI)
- DR Horton was seeing $1.7M in theft and with Zedcor that amount dropped to $70K. More importantly, it eliminated building delays from stolen products like windows, doors, etc.
- The towers pay for themselves, but the most exciting aspect is what comes next
- By Zedcor controlling their own monitoring software, they will be able to layer on custom analysis for clients. DR Horton mentioned they can get fined each time someone is caught not being tied down while roofing or not wearing their hard hat. The Zedcor tower will be able to monitor and alert Dr Horton’s manager when someone isn’t following the safety protocol plus running daily summaries across multiple project sites. This takes the client offering to the next level, from strictly offering security to actually providing operational insights from everything the cameras are capturing.
- This can be applied to specific needs and use cases for grocery stores, pipelines, retail parking lots, outdoor events, mines, etc.
MDA Space (MDA) Reported Q1 Earnings – Cash Earnings 1 +68%
MDA reaffirmed their 2026 outlook which implies 12% organic growth & 18% earnings growth. We met with management a couple weeks ago and their $40B pipeline is for work they potentially foresee over the next 5 years. They are becoming a real “Prime” for space projects and they have invested $300M in a new manufacturing building which has the capacity to produce 400 satellites per year.
Cipher Reported Q1 Earnings – Cash Earnings 1 +94%
Cipher is now Net Cash ($6.4M) after paying back all of the debt used to fund the Natroba acquisition. The business is now at a point where they have integrated the acquisition and reduced SG&A costs by 42% (reason for the large jump in earnings).
They are now focusing a significant amount of time working on potential acquisitions plus launching a DTC sales model for Natroba in the US, in-licensing complimentary products, out-licensing Natroba globally, and pursuing the launch of Natroba in Canada.
Hammond Power (HMDPF) Reported Q1 Earnings – Cash Earnings1 +30%
Revenue $265M +32%
Gross Profit $80m +26%
Backlog +95%
Adj. EBITDA $41M +33%
EBITDA Margin 16%
Cash Earnings $27M +30%
Hammond sells transformers and growth is being driven by custom products for data centers in the US. In June they closed on the AEG acquisition which will increase Hammond revenue by ~36%.
Final Thoughts
We focus our daily attention on studying our investments and making sure they are executing. We don’t think we can time the market and that company fundamentals win out in the long run. SSC Security is a great example, as they continued to execute, and one day the value was realized with a ~120% premium buyout on the stock. We remain focused on companies that are executing and as the table above illustrates, the valuations remain extremely attractive.
Each of our top 10 investments had a record year in terms of revenue growth and earnings growth in 2025 and are on pace for new records in 2026.
Feel free to reach out and connect with us.
Sincerely,
Jason & Jesse
Original Post
Editor’s Note: The summary bullets for this article were chosen by Seeking Alpha editors.