: Dip Following FDA Clinical Hold Creates Asymmetric Opportunity")


")

")
Introduction
AMETEK (NYSE:AME) is an industrial conglomerate of over 100 niche market leading businesses. With almost 100 years of public operating history, AMETEK has built an excellent company that takes the Moat strategy that is familiar with more household names and applies it to scientific endeavors. By aggregating a wide range of niche moat-holding companies, despite the small available market of each, the overall financials remain high quality. In fact, I will use this article to highlight how AMETEK’s diversification, value-added revenue base, and managerial strategy has created one of the best financially performing companies in the entire market. By the end, I will highlight how AME may be a suitable investment for almost every type of investor, whether from a low-risk, SWAN view, or a high growth, long-term secular opportunity.
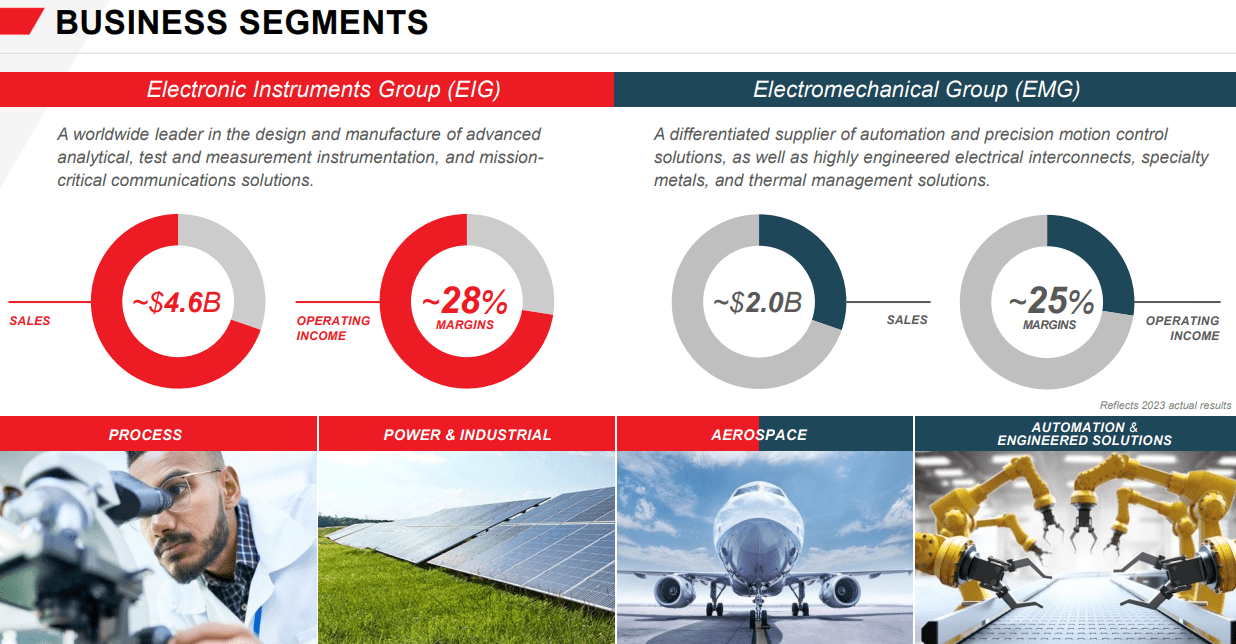
AMETEK Investor Presentation
Building a Service-Based Industrial
The provision of value-added service, data control/ analysis, mission-critical supplies/consumables, and consulting/engineering expertise are all revenue bases that outperform the market, no matter the company industry. AMETEK checks all these boxes. While data on exact revenue types can be hard to find, it is easy to assess the opportunity based on profitability. As shown in Table 1 below, higher margins can be earned with the provision of services, as evident by the select group of service-based industrial companies I compiled.
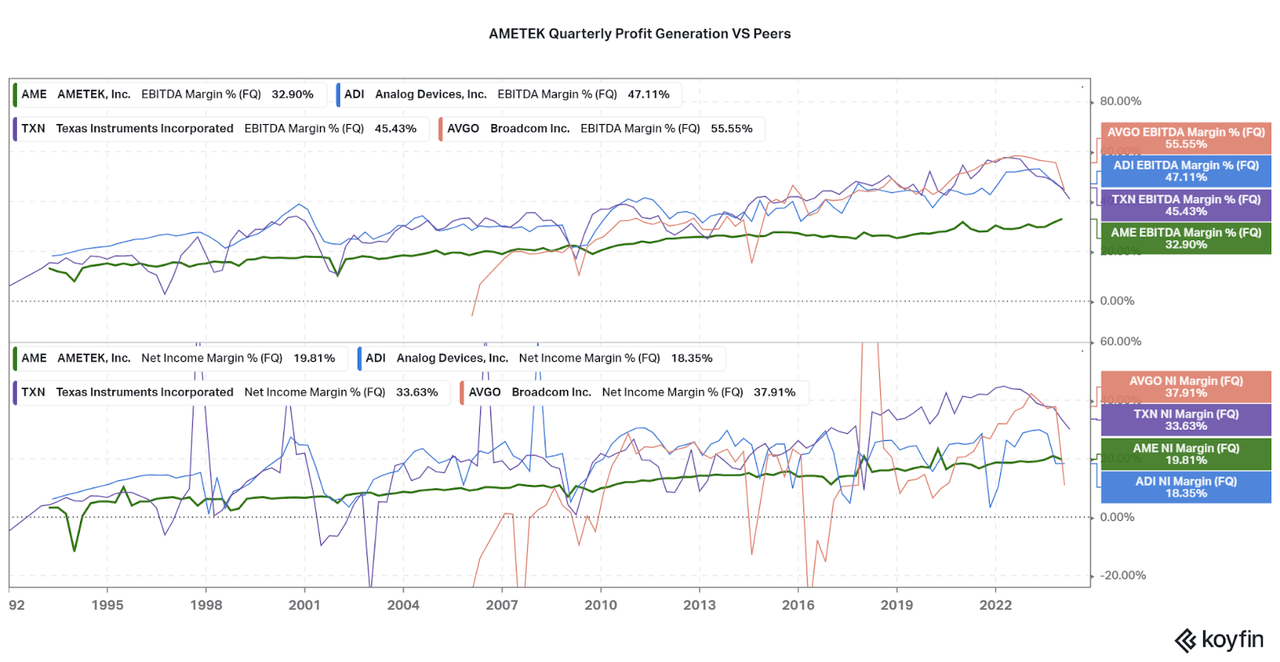
Also, important is reduced cyclicality of margins, a risk point of tech and industrial investors, I instead look for linear improvement of both EBITDA and Net Income margins with time. AME is a prime example that fits the bill, as the company has generated 29% EBITDA margins over the past five years on average. This is up from a high teens percentage in the 90s, with only small declines during bear markets. When compared to other peers, AMETEK excels at reducing earnings volatility. I believe this suits long-term investors who do not want to time the market and would like to sleep better at night, but I will highlight the key factors that have led to this performance.
|
Company |
% Service/Recurring Revenues |
20 Year Total Return CAGR (%) |
5 Year EBITDA Margin (%) |
5-Year Average EV/EBITDA (TTM) |
|
Hexagon AB (OTCPK:HXGBY) |
>60% (software) |
22.1 |
31 |
21 |
|
Daifuku (OTCPK:DFKCY) |
~25% (maintenance/operation services) |
18.8 |
11 |
17.91 |
|
Spirax-Sarco (SPSXY) |
45% (maintenance and repair services) |
18.3 |
26 |
26 |
|
AMETEK |
~15% long-term contract revenues |
18.1 |
29 |
20 |
|
Parker-Hannifin (PH) |
Unknown, but provide custom engineering services |
16.1 |
20 |
14 |
|
Kadant (KAI) |
>60% (parts and consumables) |
15.6 |
19 |
15 |
|
Ebara (OTCPK:EBCOY) |
~39% (service and support) |
10.4 |
12 |
6.2 |
|
Kurita Water (OTCPK:KTWIY) |
Unknown, but provide long-term maintenance and cleaning services |
9.69 |
20 |
10 |
|
Emerson Electric (EMR) |
24% (software and control) |
9.27 |
22 |
14 |
|
Yokogawa Electric (OTCPK:YOKEY) |
Unknown, but >90% of sales are industrial automation and control solutions |
5.12 |
14 |
9 |
|
3M (MMM) |
Majority consumables sales |
3.82 |
25 |
11.5 |
Table 1: A summary of financial data between high quality, service revenue based industrial companies. Compiled by author with Seeking Alpha and company data.
Of the group, Hexagon AB has offered the best total return and currently has the highest margins, with AMETEK being the second most profitable and offering a competitive return. While we can attribute Hexagon’s success to the profit generation capabilities of software services, AMETEK is far more mysterious in terms of how profits are generated. Perhaps most influential is the 27% of sales in 2023 that were based on products released in the past three years. The ratio is increasing according to management, particularly with increases in M&A and internal R&D has expanded the platforms.
Also, important is the fact that AMETEK is incredibly service based. I see the value-added engineering services, i.e. the ruggedization of Intel CPUs for aerospace embedded use, as key. By taking base products released by other tech or industrial giants, AMETEK works closely with clients to maximize the original item’s potential. Conversely, AMETEK’s business also often acts as an OEM, or sole supplier, to the aforementioned giants, leading to excellent pricing power. Essentially, there is a positive feedback loop in place, with both first-line designers/manufacturers and end users all being reliant on AME’s niche expertise. When either customer type seeks AME’s assistance, the other customer type will benefit from increased sales and/or the production of higher quality products.
Lastly, AMETEK has long-term contracts in place with customers, suggesting revenues are not reliant on inventory management, an area where most manufacturers suffer during bear markets. In 2022, over 15% of revenues were derived from products and services over time, primarily consisting of training, consulting, and maintenance. While 85% single point sales seems high, we must also understand that the company is still selling niche, low-volume/high-cost components rather than commodities, allowing for the superior profit margins overall. And, despite taking the risk of M&A and internal R&D, AME management has conservatively maintained financial excellence, and I believe that this will continue regardless of the individuals in charge, as the company culture is now developed to succeed self-sufficiently.
Lack of Volatile Financials
There are many well-performing companies in the market, many of whom are larger and information is more transparent. The industrial peers I listed in the table above include some of those peers, particularly in regard to overall growth rate. However, to me, AMETEK stands out in terms of consistency. This is where any premium and favoritism should provide the group with a premium. I believe a comparison between semiconductor stalwarts Analog Devices (ADI), Texas Instruments (TXN), and Broadcom (AVGO), along with the closest industrial peer Parker-Hannifin, is quite important in highlighting AME’s superiority. I believe these comparisons are also complementary to my thesis that AME works as an investment for all types of investors, as consistency and low downside risk are always appreciated.
The first area that this is apparent is AMETEK’s long revenue history compared to the peers. As shown in Table 2 below, AME had the least cyclicality of peers. For those looking for safety in a bear market, AME had the smallest maximum revenue drawdown of the group, which occurred during the financial crisis of 2008-09. However, the long-term revenue trend was relatively undisturbed as over the past 20 years, AME had the least cyclical 10-year average revenue CAGR. AME threads the needle between cyclicality and defensiveness with a relatively fast high-single-digit average growth rate through all market conditions (with Koyfin data going back to the early 90s for all firms).
Further detail not included in Table 2 is the fact that both ADI and TXN have failed to drive secular growth, as both firms have long periods of flat revenues. Particularly, high points seen around 2000 were not surpassed for the firms until the mid-2010s (hence negative 10-year rates on occasion). All of these details are replicated in profitability metrics as well. So despite AME seeing lower overall margins than the large peers, consistency has been established over the 30-year period. I believe Chart 1 below highlights the discrepancy. Not to mention the fact that AMETEK holds only a $40 billion market cap, and so there is plenty of room for expansion into the future.
As a long-term investor myself, I want to feel comfortable with my holdings and do as little portfolio management as possible. If or when I hold AME, will I feel confident that the financials will continue improving, and the only risk point will be market sentiment and valuation which can be negated through recurring investments. Also, upon market crashes, AME will be a clear choice on the wishlist to add shares while other companies may need to be assessed for financial health. Although, let us take a look at the balance sheet to see where AME stands now.
|
Max Revenue Drawdown |
Lowest 10 Year Rev. CAGR |
Highest 10 Year Rev CAGR |
All-time Mean Rev CAGR |
Current 10 Year Rev CAGR |
|
|
AMETEK |
-24 |
3 |
12 |
8.4 |
6.3 |
|
Analog Devices |
-47 |
-0.75 |
18 |
7.6 |
15 |
|
Texas Instruments |
-40 |
-1.3 |
6.5 |
2.5 |
2.1 |
|
Parker-Hannifin |
-34 |
1.4 |
9.9 |
6.0 |
4.5 |
Table 2: A comparison between highly profitable value-add industrial and semiconductor companies. Compiled by author with Seeking Alpha, Koyfin, and company data.
Koyfin
Flexibility for Continued Investments
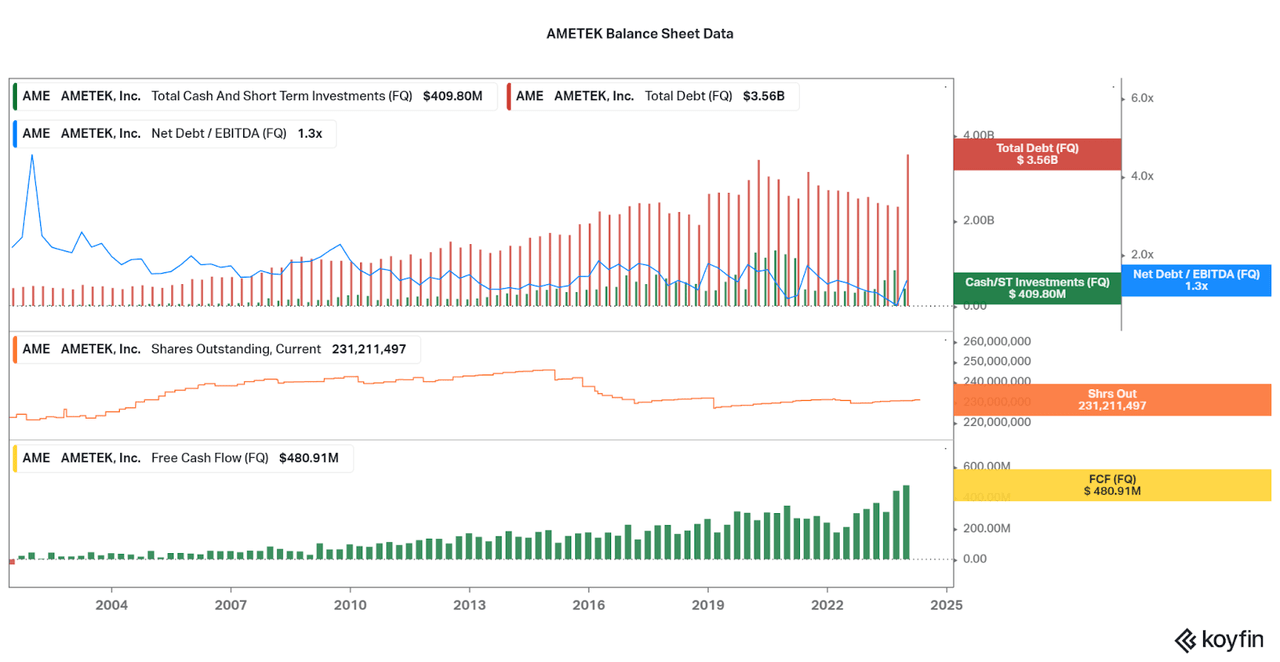
Along with low-cyclicality of revenues and earnings, AME holds a defensive balance sheet with low leverage. While debt has increased in 2024 after the Paragon Medical acquisition, the largest for the firm, leverage remains at only 1.3x trailing EBITDA. This is in-line with larger firms ADI and TXN, and is less than aerospace focused Parker-Hannifin. Cash flow generation has also been consistent, but investors should note that share buybacks may become a new form of return when larger size is gained.
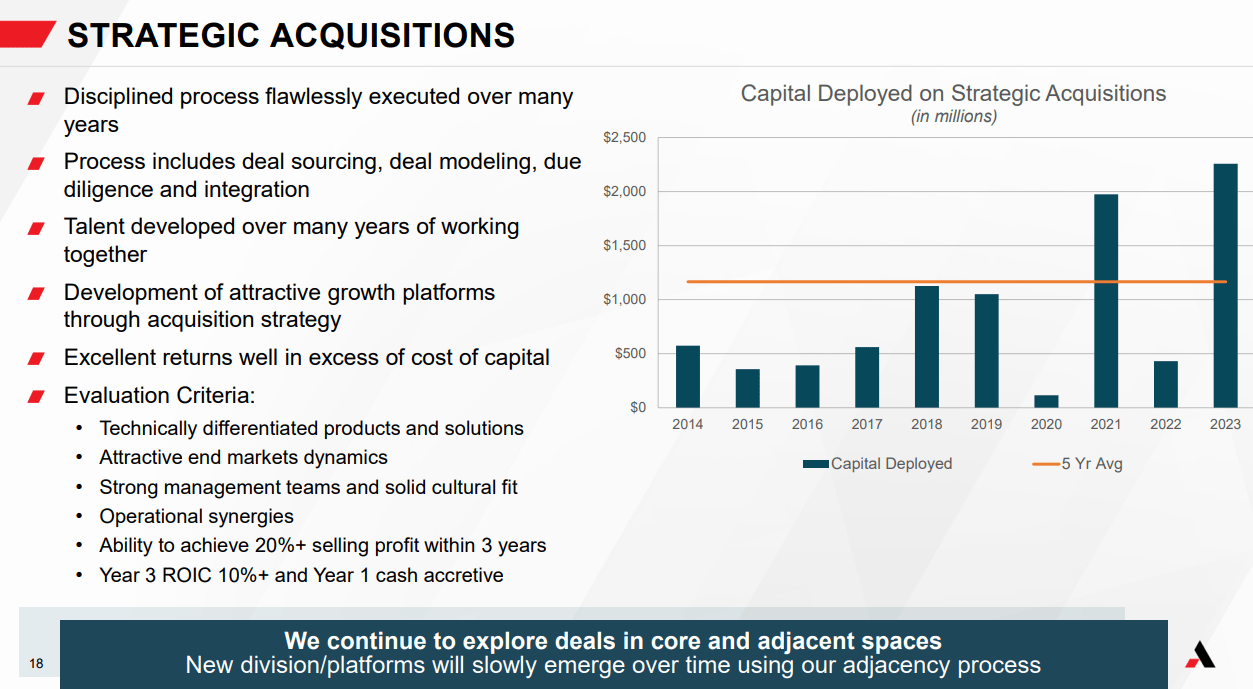
For now, though, I do not expect more than 15% of cash flow to go towards buybacks for the time being. Instead, look for continued acquisitions to drive growth for at least the five to ten-year period. This is not a risk point in my eyes, thanks to decades of M&A success driven by kaizen theory and comprehensive deal evaluation techniques, as evident by the company slide below.
Koyfin
AMETEK Investor Presentation
Valuation and Outlook
AMETEK is with little doubt a low-risk industrial company, but remains at risk due to cyclicality of the economy. In the past, I noted that revenues do fall, just not as much as peers. Bad times usually coincide with four quarters of negative growth, such as the GFC and pandemic, although the broader industrial market slowdown of 2015-16 led to two negative quarters in a row. Despite the risks, share price performance has done well to not provide investors with long periods of negative or low returns. In fact, I did not see any five-year period with negative total returns for AME, even going back to the 90s. The worst I could find: +5% between 1995 and 2000, but that was far worse than normal conditions. Instead, going back to 1968, investors earned over 13.4% per year annually.
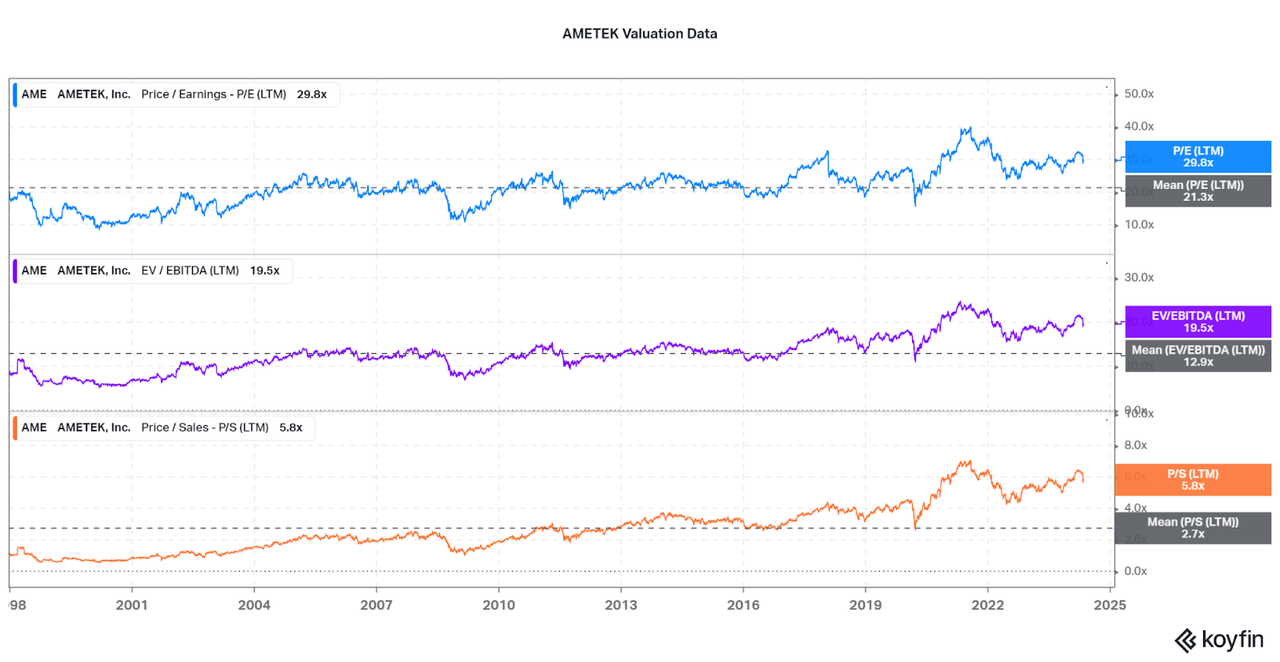
At the same time, new investors may be off-put by current valuations. AME is trading well above 25-year mean valuations across P/E, EV/EBITDA, and P/S, although down from 2021 highs. The issue for bears, though is that this is just a steady continuation of a long-term pattern of increasing valuation in-line with improved financials. Also, increased transparency due to the easy flow and analysis of financial data has supported higher overall valuations, and this is another beneficial indicator that valuation is not an issue in my eyes. I will recommend recurring investments for most, but the recent fall after earnings in early May is a solid entry point.
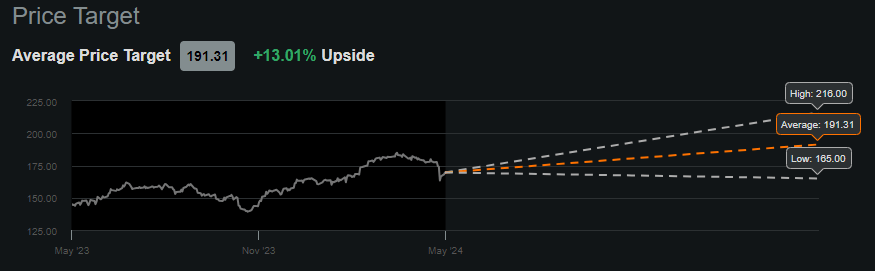
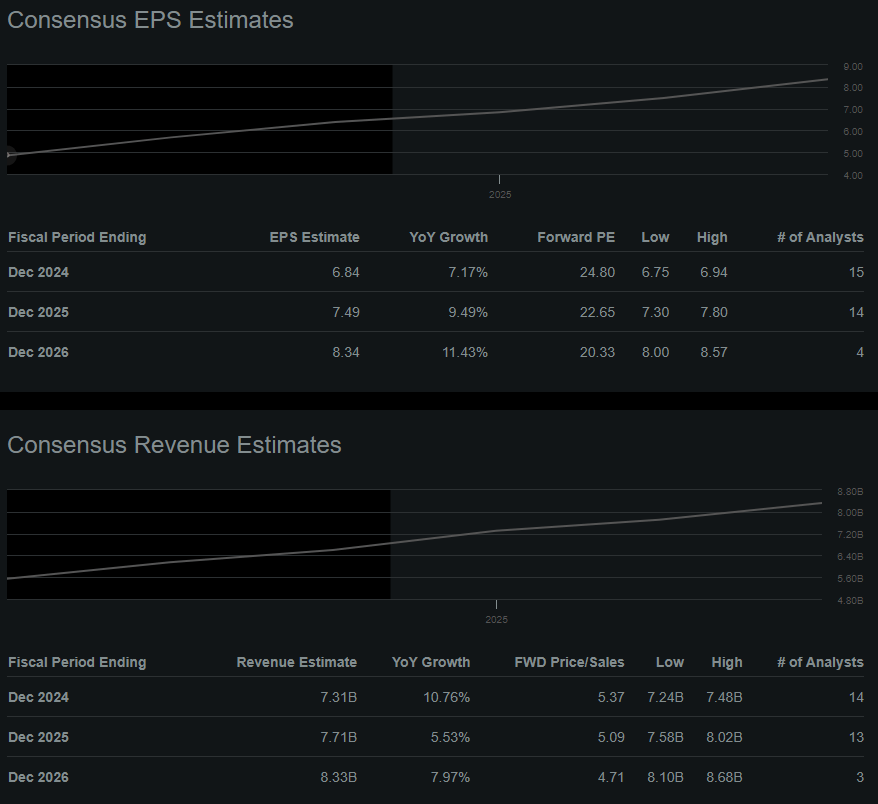
Below, I add images of analyst estimates that highlight how both the share price and financials are expected to continue climbing, rather than fall. This leads to three scenarios:
-
A continuation of the long-term pattern of increased valuation into the 30s and 20x P/E and EV/EBITDA, respectively, leading to mid-teens returns from current levels. I see this as a 60% probability of 30-40% return in three years.
-
A degradation in value, but continued growth, may lead to weak returns in the short term. This may lead to a 25% increase in earnings, but a reduction in value to 20x P/E, or a 16% return. I see this as a 30% probability.
-
Or, a recessionary danger may cause estimates and the valuation to fall, with no M&A, leading to 10% earnings growth over the three-year timespan. This could lead the share price to remain flat to rise in the single digits, but is unlikely at an estimated 10% probability.
Koyfin
Seeking Alpha
Seeking Alpha
Conclusion
When combining my estimations for the future, I come to a 25% return for AMETEK for shares bought around the 30x P/E mark over the next three years. This is slightly below the average annualized return of the broader market of 9%, or 30% three-year returns, but is conservative in considering recessionary downside risk, the high-interest rate environment, and a lack of M&A. Overall, the actual downside risk is far less than peers, so I do recommend investors consider using AME as a pillar of their industrial and technological portfolio. I will be adding on recurring investment and raise the position to be within my top 10 largest holdings by weight.
Editor’s Note: This article discusses one or more securities that do not trade on a major U.S. exchange. Please be aware of the risks associated with these stocks.
")

")

")