





Introduction to the State Street SPDR NYSE Technology ETF
The State Street SPDR NYSE ETF (XNTK) is a +$2 billion-sized ETF that has been in existence since September 2000. XNTK, with an expense ratio of 0.35%. It makes quarterly distributions, which annualize to 0.13% currently.
What Does XNTK Do?
XNTK consists of a pool of “technology-related equities,” and it doesn’t employ a fund manager to pick stocks from scratch, but instead, it seeks to sample and passively track stocks from the NYSE Technology Index [NTI]. What’s important to note is that NTI isn’t built or maintained by State Street but by an external institution called ICE Data Indices, LLC.
So what is NTI made up of? Contrary to the name of this index, NTI isn’t a pure play group of New York listed stocks from the technology sector alone. In fact, the index only requires 75% of its holdings to be headquartered in the US, and stocks from the consumer discretionary sector, which are also technology-related, are considered. In addition to certain market-cap and liquidity thresholds, any potential constituent that makes it to NTI needs to meet at least one of three revenue-related conditions.
- Positive YoY sales growth for the most recent quarter
- Have only two negative quarters of sales growth over the last two years
- The total trailing 4-quarter revenue figure is to be within the top 75 companies within an industry.
In the next steps, these stocks are ranked on the basis of their market cap and liquidity, with the top 35 stocks making the cut. These top 35 are then eventually equally weighted, with rebalancing taking place once a year (in December).
What Are The Main Features Of XNTK’s Portfolio?
One of XNTK’s defining traits is that it isn’t very widespread but narrow, with only 35 stocks being covered. Then, while it does include some stocks from the consumer discretionary sub segments, the portfolio is still largely dominated by those from the traditional technology universe. Within the technology stack, semiconductors, and those that manufacture equipment and materials for that specific industry account for 53% of the entire portfolio.
Sector weights (State Street)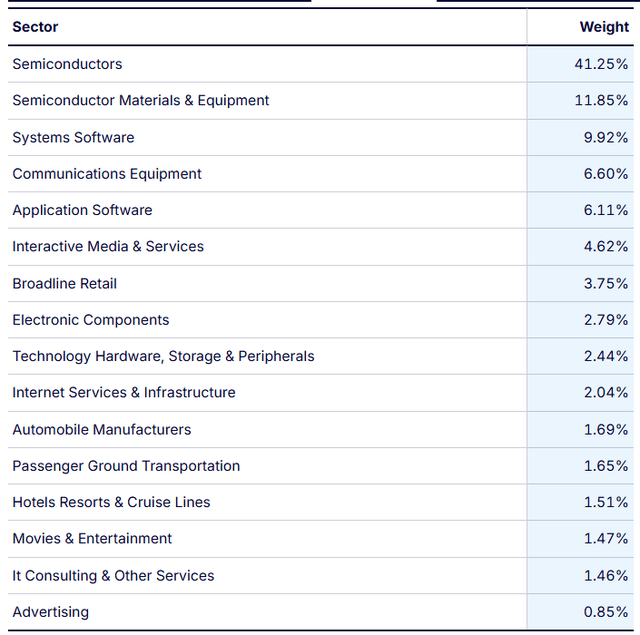
Note also that this is a portfolio that doesn’t cover any small caps, with minimum mid-cap coverage. This is because XTNK’s tracking index does not consider any stock with a market-cap of less than $2 billion. Secondly, one of the screening conditions is for the trailing revenue of a stock to be amongst the top 75 companies within a sector (which should tilt towards giants and large caps). Finally, also consider that even though XNTK is equally weighted, the 35 stocks that are chosen are ranked on the basis of higher market-cap.
Market cap exposure (Morningstar)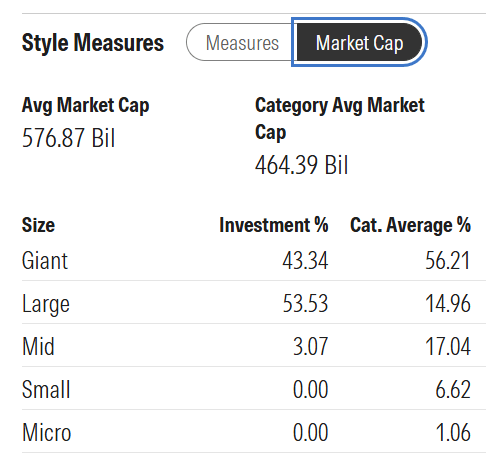
From a geographical standpoint, I noted how XNTK requires 75% of its constituents to be US-headquartered. The reality is that 90% of this portfolio is US-based, with the rest coming from the Netherlands, Taiwan, Canada, and China at this time.
Geographical breakdown (State Street)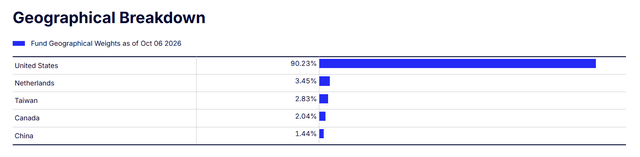
What Are The Risks Associated With XNTK?
XNTK would represent a risky bet for those looking at it as a core holding, as its annualized volatility is over 2x wider than what a typical ETF experiences (14%). Put simply, the price fluctuations associated with XNTK are over twice that of the ETF median.
Risk metrics (Seeking Alpha)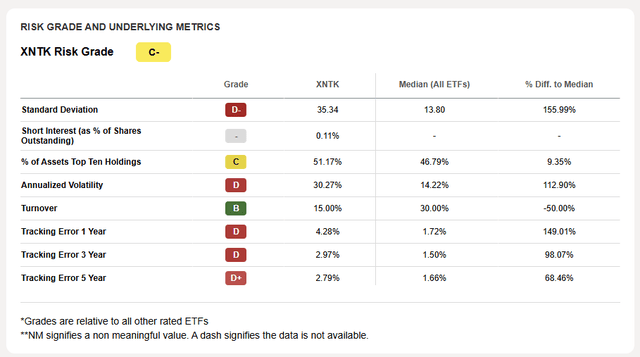
As noted earlier, XNTK passively tracks NTI, but rather than fully replicating the latter to the tee, the former follows a sampling policy. Sampling is seen as more cost-efficient, as the fund is only looking to own a smaller pool of stocks that have the same broad characteristics (similar industry exposure, similar market cap breakup, etc.) as an index. However, the drawback of sampling is that it typically also translates to relatively higher tracking errors, which reflect poorly on the ability of a passive ETF to mimic a certain index. In XNTK’s case, note that across different time durations, its tracking errors are much wider than what a typical ETF experiences, and this trend has only magnified over time. So, those looking for a true-blue passive ETF should view XNTK with caution.
Investors run the risk of owning stocks that don’t have the most resolute fundamentals despite their screening process. For instance, it calls for potential constituents to only meet at least one of three sales criteria, rather than all three. Also, the requirements, such as positive YoY topline growth for the most recent quarter, seem rather easy to achieve.
XNTK’s tracking index gets rebalanced only once a year (rather than on a semi-annual or quarterly basis), which may help curb unnecessary transaction costs, which end up impacting net returns. However, on the flip side, because changes are only made once a year, investors could end up owning stocks that have seen negative YoY topline growth for 2-3 quarters on a stretch. Recall that one of XNTK’s requirements is that positive YoY topline growth is required only for the most recent quarter. XNTK also doesn’t incorporate any forward-looking measures.
Who Is XNTK For?
Most of XNTK’s competing ETFs that focus on mega- and large-cap tech tend to be more widespread in their coverage. However, because these alternatives typically follow a market-cap weighting policy, they also tend to suffer from strong concentration effects, with a lot of smaller holdings just making up the numbers. Against this competing backdrop, we believe XNTK would make for a suitable bet for those who prefer owning a relatively narrow pool of stocks, where each stock has an equal say in the overall performance.
Because XNTK only gets rebalanced once a year, it would also appeal to those who like to resort to low-churn “buy-low and sell-high” portfolio management policies. For added context, note that XNTK’s annual churn of only 15% is half of the median ETF’s churn levels.
XNTK’s strong coverage towards the semiconductor landscape makes it apt for those who want to stay exposed to businesses that will be powering the secular technological trends [such as AI, robotics, etc.] over the next few decades.
XNTK would also appeal to growth style investors, as nearly two-thirds of its portfolio consists of large and mid-cap growth stocks.
Stock style (Morningstar)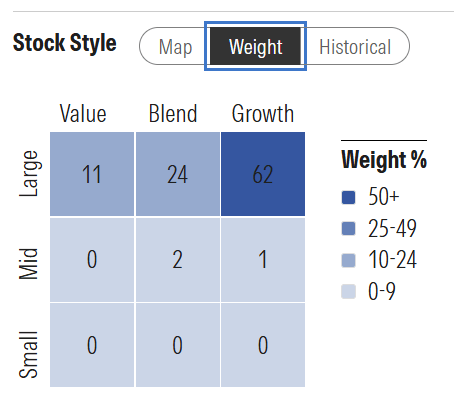
Growth-style stocks typically exhibit strong earnings potential, and it is believed that XNTK’s portfolio is set to deliver impressive long-term earnings growth of 28%. Needless to say, these estimates won’t necessarily be at static levels over time.
While XNTK would primarily appeal to long-term investors, it also has the appropriate qualities to fulfill those with short-term tactical mindsets, such as those looking for a levered proxy on the equity benchmark. We say this because XNTK tends to see fairly resilient daily dollar volumes of $20 million a day, which also translates to tight trading spreads of 0.02% (whereas the spread of a median ETF is 6x wider). This means the risk of slippages is quite low. Also consider that XNTK’s beta vs. the S&P 500 is quite large at over 1.6x at this time, so if investors are expecting the S&P 500 to embark on an uptrend over a period of time, XNTK would represent a more levered way to play that potential uptrend. For those not familiar with the beta, it tells us how sensitive a financial asset is to the movements of a base asset. The base asset here is the S&P 500, so every 1% move in this index should typically see XNTK move by a greater threshold of 1.6%. To be clear, this high-beta facet applies even to the downside, which of course brings an element of risk.
Beta vs S&P500 (YCharts)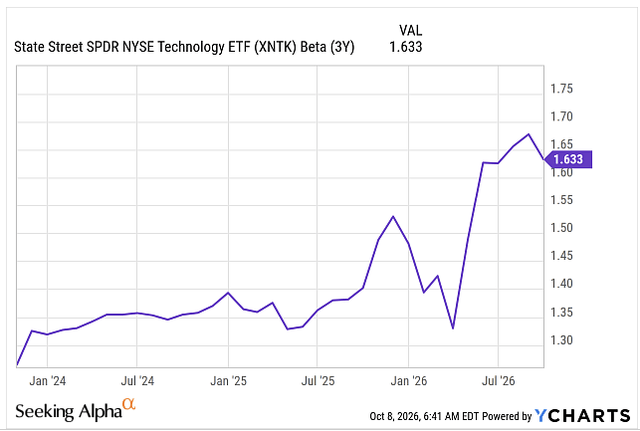
Peers to XNTK
Two other passively managed ETFs that subscribe to an equally weighted policy of US technology stocks are the First Trust NASDAQ-100-Technology Sector Index (QTEC), and the Invesco S&P 500 Equal Weight Technology ETF (RSPT).
As their respective names suggest, QTEC equally weights the tech constituents of the Nasdaq 100, while RSPT equally weights the tech constituents of the S&P500. While both these products made their debuts almost 6 years after XNTK, their AUM stakes have already exceeded the latter. Likewise, the daily liquidity seen in these counters is superior to XNTK’s.
Compared to XNTK, their coverage of stocks is wider, and while they also tilt towards the semiconductor sector (RSPT’s portfolio is dominated by software stocks as well), their respective exposure isn’t as pronounced as XNTK’s exposure. Likewise, both alternatives offer healthy mid-cap exposure, while RSPT also offers double-digit small-cap exposure.
These two products are not as cost-efficient as XNTK, but they tend to see marginally lower volatility. What’s also key to note is that they resort to far more frequent churn and rebalancing than what XNTK engages in.
From an income angle, all three make quarterly distributions with the annualized figures amounting to an unremarkable picture of less than 0.25%.
Key metrics (Seeking Alpha, Morningstar)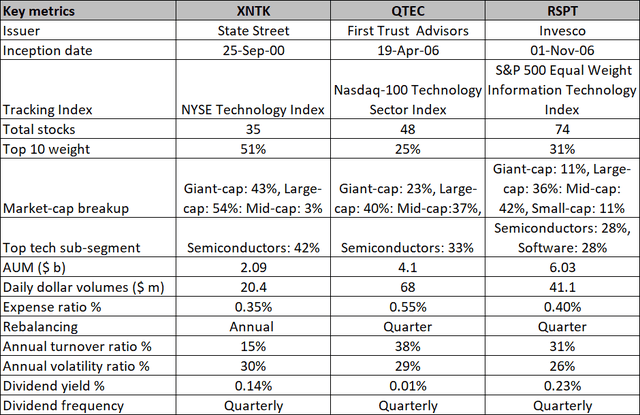
Summary
XNTK comes across as a low-churn and narrow-technology ETF that will appeal to growth-chasing investors who like to buy low and sell high. XNTK’s risk profile is twice that of the median ETF, and it is also very sensitive to the movements of the benchmark index.
This article answers three main questions about XNTK:
- What are the key features of XNTK’s portfolio?
- What type of investor is XNTK suitable for, and what are the risks associated with it?
- How does XNTK compare against other equally weighted ETFs that focus on US technology stocks?
Editor’s note: This article is intended to provide a general overview of the ETF for educational purposes only and, unlike other articles on Seeking Alpha, does not offer an investment opinion about the ETF.