





Fast Facts
Simplify High Yield ETF (CDX) is an actively managed high-yield bond ETF launched on 02/14/2022. CDX has a net expense ratio of 0.25% and a trailing 12-month yield of 8.29% at the time of writing. Distributions are paid on a monthly basis. CDX is a mid-size ETF, with about $362 million in assets under management and sufficient liquidity for long-term and tactical allocation as well ($2.9 million in average daily trading volume). The sponsor, Simplify ETFs, is an investment management firm founded in 2020 with about $13.9 billion in total AUM specialized in alternative strategies and hedge fund-like ETFs.
CDX’s Strategy
Despite its name, Simplify High Yield ETF is not a simple high-yield bond ETF. It implements a sophisticated multi-layered strategy based on derivatives.
As described by Simplify ETFs, the fund gets primary exposure to high-yield corporate bonds (often referred to as “junk bonds”) through swap contracts on traditional high-yield ETFs and applies a credit risk protection using derivatives. Let’s dive into the sub-strategies.
Layer one: high-yield exposure. The fund holds swaps in one or several high-yield corporate bond ETFs such as iShares iBoxx $ High Yield Corporate Bond ETF (HYG). These swaps provide capital-efficient exposure to the performance of the underlying ETFs. On the downside, CDX doesn’t own real bonds or bond ETFs, and swaps have the counterparty risk of their issuers (typically large financial institutions such as investment banks).
Layer two: hedging. The fund uses derivatives to hedge against interest rate risk and credit risk. These derivatives are primarily swaps in fixed income indexes or ETFs, but the strategy may also involve swaps in equity indexes or ETFs. Hedging positions may be closed when the related risk is no longer considered significant.
Layer three: options income. The fund may use call spread and put spread strategies to generate income from option premium. The options sold and bought by the fund are generally short-term (less than one month to maturity) and may be related to a broad range of instruments (equities, debt, volatility indices, commodities, and currencies).
Layer four: cash equivalents. The fund holds short-term Treasuries and money market instruments as collateral for all the derivatives. They also participate in income generation.
The portfolio turnover rate is very high: 622% in the most recent fiscal year. I will use HYG as a benchmark.
Portfolio
The portfolio composition is based on data available on 8/27/2026. It may have changed by the time you read this. The options income layer seems absent: no options or derivatives tracking option strategies appear in the holding list.
The “cash equivalents” sleeve (layer four) weighs 100% of net asset value, including Simplify Government Money Market ETF (SBIL) (76.8%) and short-term Treasuries. The portfolio also contains:
- Total return swaps on HYG (layer one).
- Index CDS (credit default swaps) on both investment grade and high-yield bonds (layer two).
- Total return swaps on commodity indexes (likely layer two, although quite unexpected from the strategy description).
- A broad long-short, almost market-neutral stock portfolio (103 long, 106 short).
The latter is also quite unexpected from the strategy description, but it makes a lot of sense in layer two: a market-neutral portfolio, long high-quality stocks and short low-quality stocks, can be used as a credit risk hedge. Quality may be measured based on credit rating and/or fundamentals (not specified here). There is no stock position above 0.5% of net asset value in absolute weight, so company-specific risk is extremely low. The top long positions at this time include Accenture plc (ACN), Fox Corporation (FOXA) and Expedia Group, Inc. (EXPE). The top short positions include RingCentral, Inc. (RNG), ManpowerGroup Inc. (MAN) and NIQ Global Intelligence plc (NIQ).
The portfolio duration is now ~3.3 years, close to that of HYG (2.95 years), pointing to moderate interest rate risk. It means asset value would change by approximately 3.3% for every 1% move in interest rates, in the opposite direction. A note of caution: due to the active hedging strategy and high turnover, duration may vary in the short term, unlike that of a traditional high yield ETF.
Performance
CDX has underperformed the high yield bond benchmark HYG by 1.1% annualized from 02/21/2022 to 8/27/2026, with similar risk metrics (maximum drawdown and volatility in the table below).
Data: Portfolio123
The share price has lost 17% from inception to 8/27/2026, while HYG is down only 3.3%. CDX has steadily underperformed the benchmark since the end of Q2 2024. This cannot be easily explained from the strategy description and macro backdrop. Anyway, the track record of CDX is too short to assess its long-term potential at this time.
CDX price return (Seeking Alpha)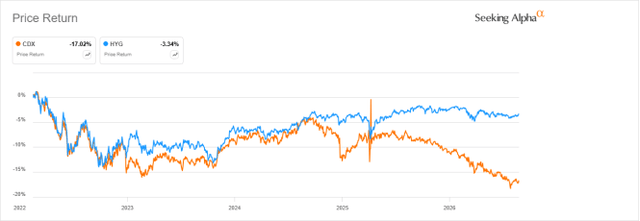
The monthly distribution has increased from inception to August 2026, although it remains slightly below the historical average ($0.153) due to exceptional distributions in December 2022 and 2024.
CDX distribution history (chart: author; data: Simplify ETFs)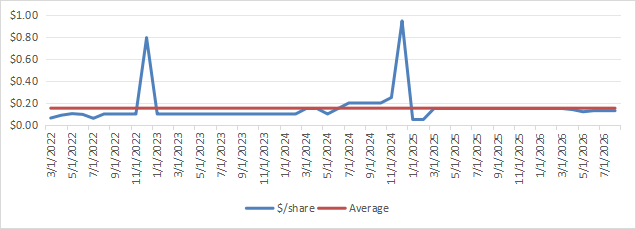
Based on the Section 19(a) notice of July 2026, the latest monthly distribution was classified as 36% ROC (return of capital). This percentage may vary from month to month, and points to significant ROC.
Competitors
To my knowledge, there is no other ETF offering high-yield bond exposure and potentially adding credit risk protection, interest rate protection and options income. The next table compares characteristics of CDX and its closest competitors, four high-yield bond ETFs with derivative strategies for hedging or income:
- iShares Interest Rate Hedged High Yield Bond ETF (HYGH)
- WisdomTree Interest Rate Hedged High Yield Bond Fund (HYZD)
- ProShares High Yield-Interest Rate Hedged ETF (HYHG)
- iShares High Yield Corporate Bond BuyWrite Strategy ETF (HYGW)
* calculated with Portfolio123 from 8/25/2022.
CDX has the lowest expense ratio and the second highest yield, but ranks second to last in total return over the past four years, and last in Sharpe ratio (a measure of risk-adjusted performance).
Takeaway
CDX pays an 8.3% yield from an active portfolio primarily based on swaps offering high-yield bond exposure and potentially adding credit risk hedging, interest rate hedging and options income. The track record of CDX is too short for sound assessment, but it is still unconvincing for now. Indeed, CDX has underperformed the benchmark HYG and three interest rate-hedged high-yield ETFs. Nonetheless, CDX remains well-suited as a satellite holding for investors seeking diversification in hedge fund-like ETFs with a low expense ratio.
- Pros: low-cost hedge fund strategy.
- Cons: still unproven by results, swap counterparty risk (no real bonds).
This article answers these three main questions about CDX:
- How is the CDX’s portfolio structured?
- How does CDX compare to benchmarks and competitors?
- What type of investor is CDX best suited for?
Editor’s note: This article is intended to provide a general overview of the ETF for educational purposes only and, unlike other articles on Seeking Alpha, does not offer an investment opinion about the ETF.