






The Bristlemoon Global Fund returned 1.9 percent for the June 2026 quarter, with a -2.7 percent return for the month of June 2026, net of fees. Key performance contributors in the month of June included ASML (ASML), PAR Technology Corporation (PAR), and Baltic Classifieds Group (BCLGY). Notable performance detractors over the same period included AppLovin (APP), Hemnet (HMNTY), and ServiceNow (NOW).
The Bristlemoon Global Fund has now reached its two-year mark. We want to begin by thanking you for your trust and patience, especially over what has been a difficult last twelve months for the Fund. That trust is not something we take for granted, and we remain encouraged that the stocks owned by the Fund are excellent businesses whose values we expect to compound meaningfully over time.
Starting Bristlemoon has been an incredible journey and we’re more excited than ever for what lies ahead. The last two years have reinforced our conviction in the path to building a reputable funds management business that serves as a platform for us to find and own stakes in excellent businesses, and to do so for decades to come. However, we must always improve and adapt, and the challenges in the past year have provided ample fuel for these reflections and process improvements.
This letter reflects on some of the key lessons from our first two years, the changes we have made to mitigate the risk of large drawdowns, and the early evidence that those changes are working. We also provide updates on the Fund’s investments in Timee (TMEEF), AppLovin, and ASML.
The double-edged sword of averaging down
There is a famous photo of the trader Paul Tudor Jones, with a makeshift “LOSERS AVERAGE LOSERS” sign in the background. The somewhat blunt maxim is a reminder to never add to a losing position simply because it has fallen.
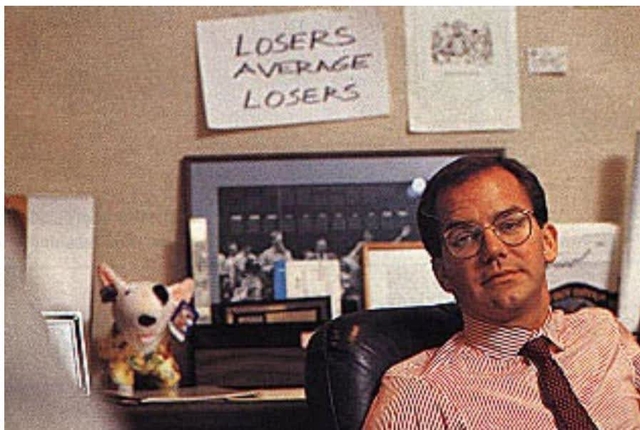
Tudor Jones, however, is a macro trader. This has made it easier for fundamental investors to disregard this risk management protocol, particularly as it is directly at odds with the countless “Buffettisms” that espouse buying more of a stock if its price declines.
There is nuance to the idea of averaging down, and it is very much not as simple as never, or always, buying more of a declining stock. Averaging down successfully depends on 1) whether you are correct about the future value of the stock; and 2) whether you correctly time your additional purchases to coincide with when the market agrees with your view and pushes the stock to where you think it should trade. You are unable to know the answer to either of these unknowns a priori, which alone hints at the risk inherent in averaging down.
In the past, we have averaged down in stocks where we liked the valuation and believed that the business would be much more valuable in the future. This wasn’t a terribly sophisticated approach, and it has been problematic to the extent that it didn’t give due weight to when a stock was likely to be re-rated by the market. The timing of the rebound matters, and, at least in the short-term, buying more of a stock that continues to decline is indistinguishable from being wrong.
Hemnet and PAR Technology are two examples of this, with both stocks having been significant underperformers that have contributed to the bulk of the Fund’s drawdown over the past year. While we believe these stocks will recover, we have been wildly wrong on the timing of when that recovery would occur, and the path with which those stocks would take before staging a recovery. These unforced errors in position sizing and averaging down have been very costly, and the only solace we can take from them is that they have prompted a lot of reflection that has resulted in process improvements that will hopefully reduce the likelihood of making similar position sizing mistakes in the future.
Compounding/conviction framework – only sizing what is likely to work
For example, in our March 2026 letter we introduced our compounding/conviction position sizing framework, which decomposes each investment position into two distinct exposures: 1) the compounding position; and 2) the conviction position. This framework seeks to prevent us from over-sizing positions that lack near-term catalysts, have negatively inflecting narratives, and/or a high risk of negative earnings revisions.
Source: Bristlemoon Capital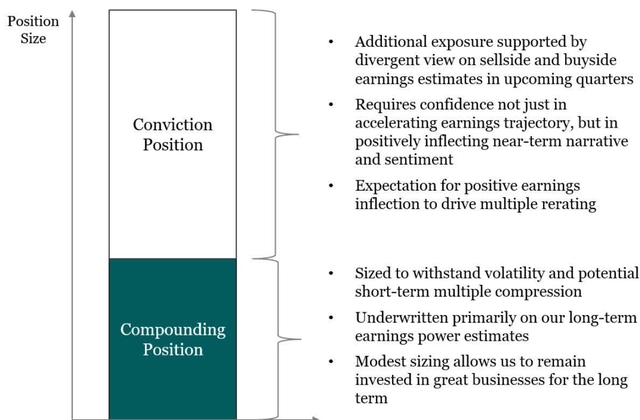
Our framework acknowledges that when a stock’s narrative is negatively inflecting and earnings expectations are being revised downward, the likelihood of other market participants stepping in and buying that stock, even at historically depressed valuations, is lower. We touched on how this is being driven by market structure changes, with the rise of multi-manager firms, in the following piece: Do You Dance While the Music is Playing?
Furthermore, when the narrative and numbers are deteriorating, there is a heightened chance of negative earnings surprises. Consequently, for a stock caught in a downgrade cycle, the risk of being wrong on the numbers and suffering a permanent impairment of capital increases. Our framework is aimed at limiting the amount of capital we are allowed to commit to stocks that have an elevated chance of being “value traps” – that is, seemingly “cheap” stocks at the outset that may cease to be cheap in the future if earnings expectations suffer material downward revisions.
Conversely, a business with positively inflecting fundamentals, particularly if there is a step function rate of change in earnings expectations, is likely to surprise on earnings to the upside, and there is a higher chance that the stock will outperform as a wider swathe of investors feel comfortable deploying capital into these types of stock setups.
This is simply how we’ve observed stocks trading, and we believe it makes sense to augment our approach to position sizing and averaging down to concentrate the Fund’s capital in stocks that we believe are not only quality businesses and mispriced, but also where there is a high chance of us making money from that investment within a reasonable timeframe. In the current market regime, this distils down to stocks with accelerating growth profiles that result in earnings beats.
This compounding/conviction framework seeks to reconcile the trading wisdom of Tudor Jones with the value-based Buffett approach, guiding us to be more tactical in the timing of sizing up positions. In other words, we will only average down and maintain a large position in a mispriced stock when we have a well-founded and divergent view of there being a positively inflecting narrative and growth profile, not on valuation cheapness alone. It also follows that when we no longer hold such a view that we should aggressively cut the position size. Under this revised framework, we would have been reducing exposure to Hemnet and PAR, not adding.
By being more tactical in timing our additions to a position, it is likely that there will be a higher proportion of the portfolio that is performing well at any given time, which helps avoid the opportunity cost associated with parking capital in an underperforming stock where the rerate takes far longer than expected.
Timee – our framework in action
Thankfully we are seeing early indications that this framework is working well. For example, the Fund has held a position in Timee since October 2025. We first wrote about Timee in our December 2025 quarterly letter, and we later hosted Founder and CEO of Timee, Ryo Ogawa, for a fireside chat. As a recap, Timee is the monopoly spot work marketplace in Japan. Essentially, Timee matches workers who are looking for sporadic, part-time shifts, with firms that are in need of workers to fill a shift.
While we like the business, have a deep respect for Ogawa-san as a leader and his execution track record, and felt that the stock had gotten too cheap, we limited ourselves to a 5% “compounding position” when we made our initial investment in Timee. This is because the business was decelerating and we were unable to build conviction on when a reacceleration was likely to occur. In particular, Timee’s Food vertical had experienced a large growth deceleration, with growth dipping negative as restaurants in Japan grapple with cost pressures from rice and energy cost inflation.
Nevertheless, Timee reported their Q4 2026 result in June and the result showed a marked improvement in the growth trajectory of the Food vertical, as well as a reacceleration in Timee’s consolidated net sales growth. The company also guided to an expansion of Timee’s core spot work operating margins as we progress through FY27, given moderating investment levels in the back half of the year. Based on the assumptions underpinning the FY27 guidance, and through our discussions with the Timee management team, we are of the view that the guidance is conservative, and we could see Timee’s spot work operating profit growing at north of 40% year-over-year in 2H27.
In the trading session following the earnings result, the stock rallied by more than 10%, and during this session we increased the Fund’s Timee position size from 5% to 8%. The stock subsequently staged a powerful rally, increasing by around 40% over the week following the earnings result.
Source: Bristlemoon Capital, Bloomberg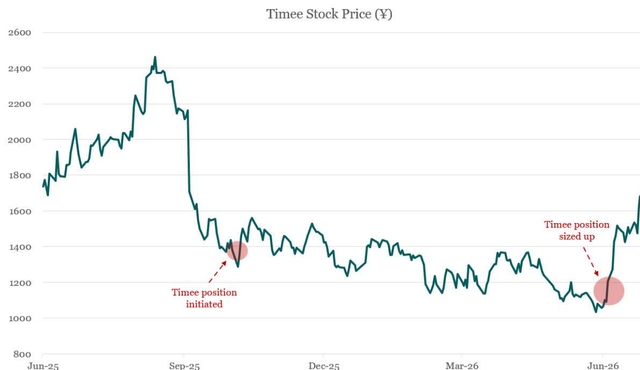
The growing signs that an acceleration was underway gave investors the “all clear” that it was now okay to invest in Timee. We were able to move quickly and scale up the position once there was increasing evidence of a positive growth inflection.
We believe that the approach of averaging up into a confirmed growth inflection will serve us far better than averaging down into a falling knife scenario, where no one has any real idea of where the bottom is.
Things don’t trade how they used to
There have been market structure changes – some of which we touched on here – which are resulting in stocks trading differently to how they have historically. More specifically, a shrinking portion of the market is pricing stocks based on long-term fundamentals. The rise of multi-manager firms (a.k.a. pods), retail investors, systemic investment strategies, and passive flows has changed the way that some parts of the stock market trade, and our belief is that we won’t see a return to the way markets previously used to function.
Notably, there is a lot more volatility in stock multiples, with stock prices easily whipsawed by narrative shifts. This is a departure from the previous market environment where a stock’s valuation multiple would ebb and flow within a narrower range, unless there was a truly significant change in the underlying business or market-wide correction. In this sense, the market value of a stock would more closely track the intrinsic value of that business over time.
Source: Bristlemoon Capital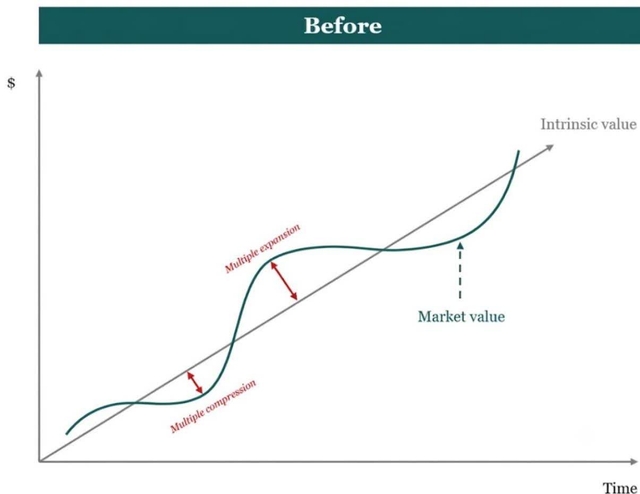
Nowadays, there is seemingly a lower bar for what is capable of moving a stock. Narrative shifts are sudden, are more susceptible to being shaped by low signal information, and are resulting in greater stock price volatility.
So, for stocks that are increasingly transacted by market participants that are non-fundamental, the oscillation in valuation multiples is now much more extreme. Stocks that are widely regarded as expensive are pushed to new highs if the second derivative of the narrative is positive. Conversely, stocks that are cheap will struggle to find a floor if there are scarce signs of an earnings acceleration.
Source: Bristlemoon Capital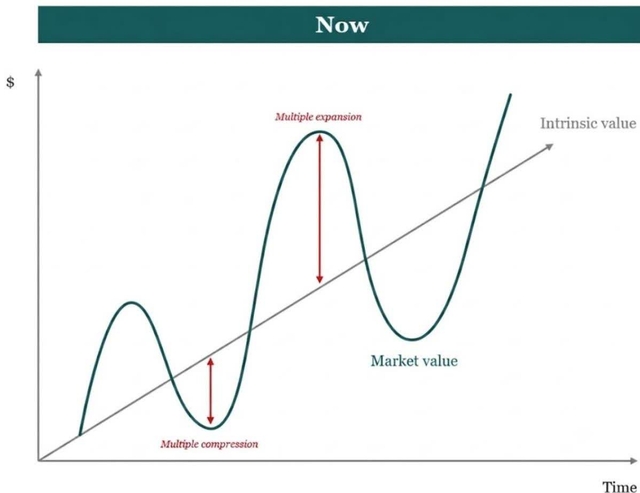
This is not to say that the stock price won’t still track the trajectory of a business’s underlying value over time. It’s just that the interim stock price movements are more pronounced, and, at times, difficult to rationalise. This makes it harder to simply invest in great “compounder” businesses and hold them for the long term, unless you possess the intestinal fortitude to weather the additional volatility. The ride might still get you to the same destination, but it’s bound to be a lot bumpier now due to how the market has developed.
We are describing these changes not to complain and simply cross our fingers in the hope that the market will revert to how it used to behave, but rather to provide a basis for optimising how we manage the portfolio in this new regime.
Exploiting the multiple de-rate/re-rate cycle
We have observed that news is being priced into stocks more quickly, and that there is a higher-than-ever propensity for the market to pull forward investment returns when a stock’s narrative turns favourable and aligns with the thematic du jour. A stock might compress two years’ worth of returns into two months if investors turn giddy about that stock’s narrative and growth prospects.
And while there is typically a kernel of truth underpinning an explosive re-rate of a stock, it’s important to recognise when the market has moved too much of a stock’s future gains to the present. Given the wider band in which a stock’s multiple is likely to fluctuate, we believe that more than ever, there are opportunities for value creation in flexing position sizes to take advantage of the multiple de-rate/re-rate cycle.
For example, if the share price has risen sharply without a commensurate increase in future earnings expectations (i.e., mostly via multiple expansion), then the market has simply pulled forward some of the investment returns that would have otherwise materialised over a longer period. In other words, the future returns on offer from the stock are now lower, and it may make sense to reduce the position size to reflect this.
The decision to flex down the position size in this scenario ties back to our compounding/conviction framework, and if the market has already brought about the multiple re-rate upon which our larger position size was predicated, then it makes sense to pare back the investment. The factors informing these sizing adjustments are 1) the size of the investment position; 2) the magnitude and speed of the stock price move; and 3) what drove that share price move (i.e., if it was primarily multiple expansion).
So, in the event that a stock we own rallies very hard due to the market getting excited over a short term narrative shift, we think it makes sense to bank those gains. In the past we’ve seen stock multiples inflate but then de-rate in subsequent quarters, leading to us giving back a meaningful portion of those stock gains. It makes sense to be more comfortable shifting a portion of this stock position into cash.
We are conscious that adjusting position sizes is not a riskless endeavour. The rationale is not to smooth out volatility, and we are certainly not proposing that we become short term traders. Crucially, the intention of more actively managing the Fund’s position sizes is in no way an abandonment of our strategy of buying exceptional businesses and holding them for long enough for the wonders of compounding to bear fruit. Rather, these portfolio management decisions are made out of respect for the nuances of the current market regime, and if executed well, are capable of turning a 15% IRR stock into a 20% realised IRR.
AppLovin case study
One example of this re-rate and de-rate cycle in play is AppLovin, which remains the Fund’s largest position. The stock is the largest contributor to the Fund’s returns since inception, but it has also been a significant source of month-to-month volatility for the portfolio. With the benefit of hindsight, the optimal decision would have been to reduce the position size, perhaps aggressively so, when the stock price breached $700 and the forward P/E multiple exceeded 50x.
Source: Bristlemoon Capital, Bloomberg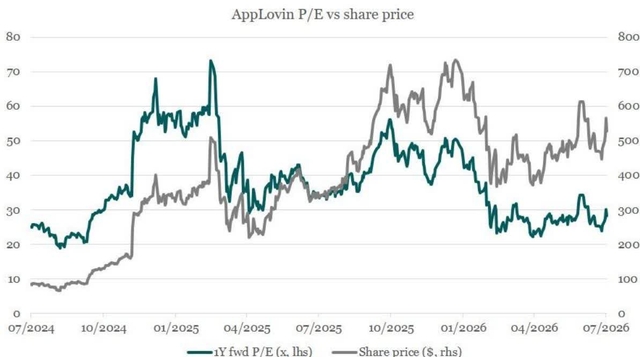
However, it is worth highlighting that while the stock is currently in a 28% drawdown from all-time highs and trading at 28x forward P/E, the stock price is still higher than it was in February 2025 when the forward P/E exceeded 70x. In other words, the company’s explosive earnings growth was more than enough to offset the significant earnings multiple compression. So, it’s important to not lose sight of the forest from the trees when investing in businesses with exceptional compounding potential, and the decision to adjust the size of the investment position in response to changes in multiple is highly nuanced rather than some formulaic rule.
We have extensively dissected our decision making as it relates to the Fund’s AppLovin position, allowing us to glean an important lesson. When AppLovin staged its face-ripping rally from late 2024 to early 2025, our earnings estimates for the business remained well ahead of sell-side consensus (and buy-side consensus as best we could gauge), so the stock was always trading at a much lower multiple to our numbers than the consensus numbers on stock screeners.
By the time the stock reached $700 in late 2025 and early 2026, sell-side consensus had caught up to our estimates. So, at this point, sharp upward estimate revisions were no longer a driving force for the stock price. In hindsight, the optimal decision was to reduce the position size once sell-side and buy-side estimates caught up to or exceeded our own, and the stock price continued to appreciate. And this is precisely the decision that would have been dictated by our compounding/conviction framework, directing us to reduce our material position in AppLovin once we no longer had a divergent view from consensus.
ASML investment thesis
We believe semiconductor capital equipment (semicap) is currently the most attractive subsector within semiconductors because the tremendous demand for compute and memory will drive a much higher-for-longer wafer fab equipment (WFE) capex cycle. Our preferred semicap exposure remains ASML, which we first wrote about in our September 2025 letter. In that letter, we outlined and debunked the main bear arguments levied against the business, and the stock price has nearly doubled since.
Despite the strong stock price performance, ASML has nonetheless derated materially against its large semicap peers. The historical premium that ASML used to command over the other four semicap majors (Applied Materials (AMAT), Lam Research (LRCX), KLA Corp (KLAC) and Tokyo Electron (TOELY)) has fully closed and the stock now trades at a discount to peers.
Source: Bristlemoon Capital, Bloomberg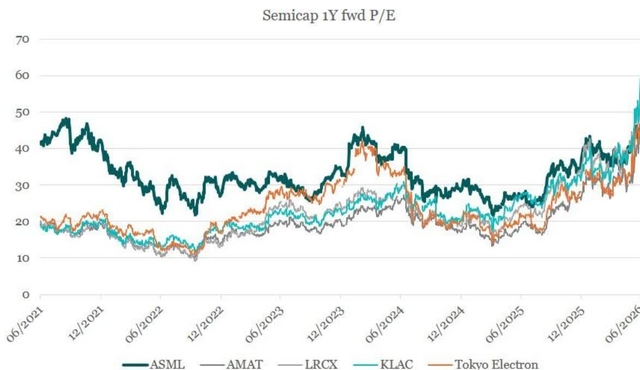
In the remainder of this letter, we outline why we still like ASML at current levels and why we believe the stock has further room to run.
WFE supercycle
In recent months, investors have come around to the view that there will be a WFE “supercycle” over the next several years, driven by unprecedented leading edge logic and memory (DRAM) capacity expansion.
TSMC (TSM) raised its 2026 capex guide to the high end of the $52-56 billion range and disclosed that capex over the next three years will be “significantly higher” than the past three years ($101 billion). Sell-side consensus currently estimates $197 billion in capex over 2026-28, but we believe that well over $200 billion cumulative capex is plausible considering TSMC is now playing catchup from a capacity perspective. The company has implemented three rounds of leading edge wafer price increases since 2025, with the latest set to occur in 2H 2026 at a reported +15%. These price increases clearly support higher capex plans.
An unintended consequence of TSMC’s conservative capital investment stance, especially during 2023-24 (remember leading edge fabs take 2-3 years to build and ramp to volume production), is that Intel (INTC) Foundry has experienced a revival. While most external customer discussions have centred around Intel’s advanced packaging capabilities, it appears the wafer foundry has been gaining customer traction as well.
In May, it was reported that Intel had reached an agreement with Apple (AAPL) to manufacture some of the latter’s chips, though the product family and process node are currently unknown. This followed an earlier commitment from Tesla (TSLA) to utilise Intel 14A for some of its AI chips. Intel also recently secured orders for 3 million Google (GOOGL) TPUs, although the announcement was ambiguous as to whether this was packaging only or includes front-end wafer foundry as well.
In any case, these external customer deals are not expected to enter production before 2028, so Intel’s near-term capex likely remains subdued (albeit with an upward bias). In the interim, 18A yields continue to improve towards mass production levels (90%+) and 18A-P – the performance-enhanced external customer node – entered risk production in June ahead of schedule. As far as 14A is concerned, when Intel CEO Lip-Bu Tan assumed the role in early 2025, he asserted that Intel was not going to invest in 14A capex until firm customer commitments had been secured. Tan’s recent capex commentary on the podcast circuit has become far more constructive, particularly as it relates to 14A, which strongly suggests more customer commitments are to be expected.
We also mustn’t forget that Intel’s core business is its product group that designs and manufactures CPUs for client and server end markets. Thanks to the rise of agentic AI, the mature CPU market is also expected to undergo rapid growth over the next few years. AMD (AMD) – the other x86 CPU design company – upped its forecast 2030 CPU TAM to $120 billion in May, compared to $60 billion it projected just six months prior.
Not to be outdone, Nvidia (NVDA) then came out with a $200 billion TAM forecast. Whether the 2030 TAM is $120 billion or $200 billion, we expect Intel to capture some of those incremental dollars even if it loses incremental share of a rapidly growing pie. Thus, for Intel to support the growth of its own CPU business and have credible capacity to run an external foundry business, it likely needs to tool up at least three 40kwpn 18A/14A fabs between 2027 and 2030.
These developments within TSMC and Intel are positive demand drivers for ASML, as any new foundry capacity constructed by TSMC and Intel requires them to buy equipment from ASML. This is not a bad place to be in the supply chain during a generational AI capex boom, and this becomes even more apparent when we look at the developments amongst the memory players.
It is in the memory space that we have the real capex supercycle. At the end of June, Korean memory giants Samsung Electronics (SSNLF) and SK Hynix (SKHY) both announced massive investment plans stretching through 2040, likely coerced by the strong invisible hand of the Korean government, with a mandate to spread their newfound memory-driven wealth across the nation. Samsung announced plans to invest 2,450 trillion won (US$1.6 trillion) between 2026 and 2040, of which 2,100 trillion is related to semiconductor production (though this seems to consolidate previously announced long-term investment plans). SK Group, the chaebol under which SK Hynix sits, announced 2,100 trillion won of investments, of which 1,100 trillion would be for semiconductor production and 1,000 trillion for AI data centre investments.
The most concrete incremental capital investment appears to be 800 trillion won (400 trillion each) to develop a new semiconductor cluster in the southwest of the country. Spread over a decade, this translates to 80 trillion won of incremental capex per year. Sell-side consensus already has Samsung and SK Hynix spending north of 150 trillion won in each of the next two years – figures that are likely to increase – and these new investment plans should be largely incremental.
However, we’d note that incremental capex over the next few years under these expansion plans will most likely go towards site preparation and fab construction, with equipment installation (when ASML recognises revenue) following thereafter. We also recognise that when/if this memory supercycle ends with a bang, these quadrillion-won plans will inevitably get shelved.
In terms of nearer-term upside to expectations for ASML, we highlight that Samsung and SK Hynix have both pulled forward the completion of currently under construction fab projects: Pyeongtaek P5 Fab 1 for Samsung and Yongin Fab 1 for SK Hynix, both targeting wafer production in 2027/28, which means equipment installation commencing in 2027. Micron (MU), the third member of the memory oligopoly, guided to north of $45 billion capex for FY27, which would exceed the cumulative capex spent from FY22-FY25. The company also pulled forward first wafer output from its new Idaho fab ID1 to mid-2027 from H2 2027, as well as meaningful volume contribution from its recently acquired Tongluo, Taiwan facility in mid-2027, a quarter earlier than scheduled.
With this aggressive memory capacity buildout, ASML likely becomes the most memory-exposed semicap vendor over the next few years largely due to the rising EUV intensity of 1d and 0a DRAM nodes. Having the highest memory exposure is usually a dubious distinction considering the historical volatility of memory cycles, but the magnitude of the capex this time should provide a very strong tailwind to orders over the next two to three years. And yet, Lam Research and Applied Materials have rerated sharply on the strength of their deep aspect ratio etch and thin film deposition franchises respectively, while ASML’s rerating has been muted, despite the rising importance of EUV in DRAM.
Capacity constraints unlikely
One recent debate that has emerged is whether ASML will be capacity constrained on EUV supply, and thus have its upside capped – quite the reversal from last year when the market was questioning whether ASML would grow revenues at all this year.
ASML’s stated capacity target back at its 2022 Investor Day was 600 DUV systems and 90 low-NA EUV systems in 2025-26, and 20 high-NA EUV systems in 2027-28. These targets have not been formally updated since, as the company has been shipping well below these levels (EUV peaked at 53 units and DUV at 396 units in 2023), and the company also slowed down capacity expansion during the 2023-24 downcycle. So, the key question for the current upcycle is: how quickly can ASML ramp up its capacity, especially on the EUV side?
As of the Q1 2026 earnings call, management was still speaking to an output plan of at least 60 low-NA EUV tools in 2026 and at least 80 tools in 2027, with DUV capacity scaling up commensurately. However, at the J.P. Morgan London TMT conference a month later, CFO Roger Dassen indicated there was potential for internal capacity to exceed 90 (no time frame given), which suggests to us that 1) demand and orders continue to rise on a monthly basis; and 2) the company is establishing the potential to exceed 90 EUV shipments in the near future – otherwise why shift the discourse to the capacity ceiling if it remains irrelevant for the next several years?
The company has laid out several steps for increasing capacity beyond 90 EUV tools without needing to build greenfield cleanrooms for system assembly, which would likely take 2+ years:
1) Reducing production cycle times by H2 2027 and supporting the broader supply chain capacity ramp
2) Optimise cleanroom output by reducing space dedicated to R&D. Not an ideal long-term solution, but one that can help alleviate short-term space constraints
3) Allocate unused high-NA capacity to low-NA tools given the delayed adoption of the former (most likely 2029+)
4) Implement fast shipments where final testing and acceptance are completed at customer fabs rather than ASML sites prior to shipment. This was used during COVID to get tools into customers’ hands faster and comes with a revenue recognition lag
The J.P. Morgan analyst came away from the conference thinking ASML could produce 110 low-NA EUV tools without needing new cleanrooms. While we don’t forecast annual low-NA EUV shipments to exceed 110 until after 2028, in our opinion, concerns about ASML being the industry capacity bottleneck are premature and likely to be resolved by the company before it becomes an issue.
Untapped pricing power
In the unlikely event that ASML is in fact capacity limited, the company has one additional lever it can pull to grow revenue: pricing power. ASML is arguably one of the few true unregulated monopolies that exist, as all advanced semiconductors currently (and for the foreseeable future) require its EUV tools to fabricate. For the monopolist of a critical piece of technology, ASML has been remarkably restrained when it comes to pricing. While the blended ASP of EUV tools has increased by a 12% CAGR since commercialisation began in 2018, ASML has justified these price increases with higher productivity tools, such that the price per wafer throughput has remained fairly constant.
Source: Bristlemoon Capital, ASML financial reports. WPH throughput at 30mJ/cm ² reference dose; NXE:3400B throughput at 30mJ/cm ² dose is estimated.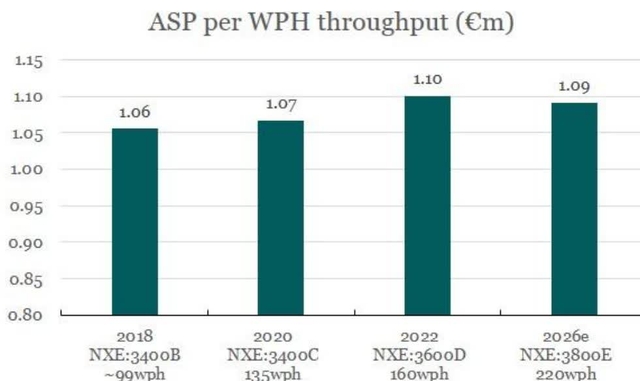
When we look at ASML’s customers, we can see for example TSMC earning 65% gross margins (vs 50-60% historically) and still pushing through 5-10% semi-annual price increases, memory vendors earning 85% gross margins (vs 20-30% through-cycle historically), and their customers, such as Nvidia, earning a 75% gross margin on top of that. So clearly, there is ample headroom for ASML’s customers to absorb substantial unit price increases, especially in a tight demand environment.
Now, it’s no secret that we’ve had our share of run-ins with monopoly-like businesses that have abused their pricing power (i.e., Hemnet and FICO), much to the detriment of the Fund’s returns. So, we certainly aren’t anticipating or clamouring for ASML to implement extractive pricing policies to exploit the current capex supercycle. After all, any business that sharply raises prices into a tight upcycle must face the prospect of cutting prices when the cycle turns. This would further exacerbate share price volatility, particularly as semicaps already sit toward the tail end of the bullwhip. For ASML specifically, exploiting its powerful and concentrated customer base would only further encourage them to break the ASML monopoly by accelerating the bring-up of a viable EUV competitor. The negatives from this outcome would far outweigh the benefit of any sharp short-term price hike.
Ideally, it would be encouraging to see ASML implement some modest level of like-for-like pricing, perhaps in the 5-10% range, such that it maintains a stable share of the increasing value that customers are extracting from its lithography tools. Another avenue for price increases is in spare parts and field upgrades, which are smaller ticket items critical to the efficient operation and uptime of already-deployed tools, where price increases may be more palatable for customers. Management has confirmed that field upgrades (essentially raising the throughput and/or yield of deployed tools) is higher gross margin than new tool sales, so customers are already willing to pay more for this productivity uplift.
Finally, high-NA EUV adoption, when it happens, will drive a significant uplift to ASPs, as high-NA will cost upward of $400 million per tool compared to $200 million for low-NA. While initial throughput will be lower, high-NA can print finer geometries in a single exposure, allowing chipmakers to skip double- or triple-patterning using low-NA tools. Per UBS, Intel recently claimed that 1 high-NA exposure with single-digit process steps could replace 3 low-NA exposures and 40 process steps, which highlights the significant throughput improvement and cost savings that high-NA can bring. Cutting total process steps by multiples can free up cleanroom space and reduce non-EUV tool costs, providing savings to fab operators that ASML could ostensibly share in.
Our ASML unit estimates
We present below the buildup of our EUV and immersion DUV unit forecasts over the next three years.
First, we begin with our estimate of the number of EUV tools required per N2-equivalent advanced logic fab of 25kwpm, TSMC’s typical fab module size (kwpm is thousands of wafer starts per month – denoting the capacity of the fab). ASML’s marketed reference throughput for its systems are significantly higher than what can actually be achieved in the field – e.g., we estimate TSMC runs its EUV tools at just ~1/3 of the advertised throughput due to maintenance downtime, mask swaps, and higher light source dosage. We arrive at ~11 EUV tools required per 25kwpm, and notably the number of EUV tools could be even higher after factoring in tool redundancy and less efficient operations by foundries not named TSMC.
Next, we estimate DRAM EUV demand across the three major DRAM vendors Samsung, SK Hynix and Micron. EUV insertion in DRAM processes is still relatively recent compared to advanced logic, so growth of total EUV layers and thus tool demand is faster off a smaller base. Based on sell-side estimates for industry HBM demand and our estimates of total industry DRAM capacity, we forecast EUV demand from the DRAM vendors to inflect sharply in 2027 and continue to grow rapidly beyond 2028 as the Korean mega clusters come online.
Combining these estimates, our forecast EUV tool shipments are materially ahead of sell-side consensus in 2027 and 2028, as we believe sell-side analysts are still anchored to management’s commentary of “at least 80 [units]” rather than updating their estimates for the demand signals from ASML’s customers.
Based on its qualitative capex outlook, we assume TSMC will continue to add around 100kwpw of leading edge capacity annually, which would require mid-40s EUV units. For Intel, 120kwpw of new leading edge capacity by 2030 (three 40kwpw fabs) will likely require 50+ EUV tools, most of which will be backloaded to end-of-decade to support 14A external foundry volume ramp. We have not explicitly forecast Samsung Foundry EUV orders due to its historical struggles with yields and customers, but recent media reporting suggests even Samsung’s fortunes are reversing so this may be a source of upside.
Our immersion DUV (ArFi) forecasts are also materially above sell-side consensus. Historically, the EUV/ArFi shipments ratio had risen from 21% in 2018 when EUV volume shipments first began to 52% by 2021 as EUV both unlocked finer critical layers and displaced more and more multi-pattern DUV layers, before declining back to 37% in 2025 as China immersion DUV imports accelerated (EUV is banned from China).
Management was expecting ArFi units to be down year-over-year in 2026 due to weak China orders but now expects to ship a roughly flat number of units as non-China demand has picked up. This brings the 2026 EUV/ArFi ratio back to up 50% and we expect it will continue to rise from there even as China DUV shipments recover next year when more cleanroom space comes online. ArFi units carry one-third the ASP of EUV units but are higher gross margin, so our ArFi forecasts are a key contributor to our much higher than consensus EPS estimates for 2027 and 2028.
In summary, we think ASML is one of the cleanest ways to play the next leg of the AI infrastructure buildout. The company sits at a critical bottleneck in the semiconductor supply chain, its EUV tools are becoming increasingly important across both leading-edge logic and DRAM, and our unit forecasts sit materially above consensus for both EUV and immersion DUV. While the stock has performed strongly, we do not believe expectations yet reflect the scale or duration of the coming WFE cycle, nor the potential for ASML to capture more of the value it enables. We continue to see healthy upside from here, and ASML remains a core position in the Fund.
We are not satisfied with the Fund’s performance over the past twelve months, but we are encouraged by the process improvements we have made, and the early evidence that those changes are beginning to work. We have an inexorable drive for self-betterment, and we will always seek to improve how we manage the portfolio. But with that said, those improvements will be in service of the overriding objective we have had since launching the Fund: to own exceptional businesses that can compound capital at attractive rates over time.
We will make ourselves available to investors to answer any questions about the Fund, the portfolio, or the changes discussed in this letter. Thank you for your ongoing support. It remains an honour to be entrusted as a steward of your capital.
Kind regards,
Bristlemoon Capital
Original Post
Editor’s Note: The summary bullets for this article were chosen by Seeking Alpha editors.