


")
Fund Characteristics
|
P/V Ratio |
Low-60s% |
|
Cash |
6.6% |
|
# of Holdings |
22 |
Annualized Total Return (All data as of December 31, 2024)
|
4Q (%) |
1 Year (%) |
3 Year (%) |
5 Year (%) |
10 Year (%) |
Since Inception (%) |
|
|
Global Fund |
-6.68 |
10.50 |
0.88 |
2.84 |
4.30 |
5.20 |
|
FTSE Developed |
-0.56 |
17.73 |
6.00 |
10.82 |
9.77 |
10.60 |
|
FTSE Developed Value |
-4.70 |
8.86 |
4.12 |
5.84 |
6.62 |
7.63 |
|
Inception date 12/27/2012. FTSE Developed Value 10 Year and Since Inception returns are gross returns, as net returns for those periods are not available. All other performance figures above are net returns. Returns reflect reinvested capital gains and dividends but not the deduction of taxes an investor would pay on distributions or share redemptions. Performance data quoted represents past performance. Past performance does not guarantee future results. The investment return and principal value of an investment will fluctuate so that an investor’s shares, when redeemed, may be worth more or less than their original cost. Current performance of the Fund may be lower or higher than the performance quoted. Performance data current to the most recent month end may be obtained by visiting Value Investors Since 1975 | Southeastern Asset Management. The prospectus expense ratio before waivers is 1.35%. The Global Fund’s expense ratio is subject to a contractual fee waiver to the extent the Fund’s normal operating expenses (excluding interest, taxes, brokerage commissions and extraordinary expenses) exceed 1.05% of average net assets per year. This agreement is in effect through at least April 30, 2025, and may not be terminated before that date without Board approval. |
The Longleaf Partners Global Fund (MUTF:LLGLX) returned -6.68% in the fourth quarter, compared to the FTSE Developed and FTSE Developed Value indices, which returned -0.56% and -4.70%, respectively. For the year, the Fund returned 10.50%, outperforming the FTSE Developed Value index return of 8.86% but falling short of the FTSE Developed index return of 17.73%.
Sometimes it is prudent to trail the broader market index, as we were doing in 1999 and early 2000 in our US large cap strategy, and the last few years could turn out to be one of those times. We also firmly believe that the 3-10 Year numbers above would be much better if we had some of the general lessons in place then that we are operating by now. This is different to us than regretting specific losers and missing potential winners – that is always going to happen for any active money manager.
Back to 2024, we grew your money since we wrote to you last January. We delivered double-digit returns in aggregate on our investments that we still own today. While the fourth quarter was disappointing compared to the market on the short-term scoreboard, the good news is that we improved the portfolio qualitatively and quantitatively through disciplined buying and selling. There were places we could have done better for the quarter and the year—we will talk about specific mistakes later in this letter. Looking ahead, we have confidence in our prospective returns based on the quality of each investment and the aggregate low-60s% price-to-value (P/V) and sub- 10x price/earnings power multiple of what we own today, which is dramatically different than the market as detailed below.
As value investors performing fundamental, appraisal-driven research, we can point to the quantitative as we did in the preceding paragraph. Others like to quantify the qualitative with measures of historical growth, margins and return on capital. These are important metrics, but future value per share growth and realization matter more to us. This growth sometimes happens steadily, but other times the turn comes when the market least expects it. We would group our holdings into three sets on this front:
- The first and largest group consists of companies where value per share growth has already turned the corner, but the market is not yet fully recognizing the progress. Ideally, this category would represent a majority of the portfolio, and today it represents approximately 60%. Examples include CNX, where value per share roughly doubled since early 2022, and Affiliated Managers Group (AMG) which, after a slow start, has seen steady value per share growth since COVID.
- The second group consists of companies that have not yet turned the value per share growth corner, but we see a path to this happening within the next 18 months. This group should be a minority of the portfolio and often includes some of our most attractive P/Vs and P/FCFs that are the most misunderstood qualitatively. IAC is one such company, and we discuss it in more detail below. Currently this group makes up less than 15% of the portfolio.
- The final group of companies includes those that we have owned for less than 18 months and are not yet clearly in either of the other groups. Because we are long- term, concentrated investors, this group will be a minority of the portfolio, as it is today.
If we are correct on our appraisals – which, based on the math, we believe we usually are – great partners with financial flexibility should eventually figure out a path to growth and improved shareholder returns (sometimes with our help). We do not want investments to be in the second group for too long, but patience is necessary at times. Said another way, we win with aligned partners when we can proactively realize value together. Along these lines, our approach benefits from surfacing companies that are acquisition and/or corporate action (spin-off, etc.) candidates. The Biden administration was much tougher on this front than Trump will likely be, so the change in administration should help companies we own over the next few years, as we believe there is more pent-up value realization activity potential in our portfolio than in the broader market.
That is one possible positive on the Trump micro front, but what about on the Trump macro? We have been asked a lot recently what to expect under the second term for Trump. Should we simply buy the same stocks that performed well during his first term? To look forward, we first need to look back to establish that things will likely be different this time around. Post-election in 2016, the S&P 500 (SP500, SPX) was coming off a 5-year period in which its earnings per share only grew at a weak 2% compounded annual growth rate (‘CAGR’). The S&P 500 index had gone up more – from 1250 to 2000 – over this time frame, driven by multiple expansion from a low-double-digit price-to-earnings ratio (P/E) to a mid-high-teens P/E. The market multiple post-Trump in late 2016/early 2017 was close to the then long-term market multiple average in the US of 16-17x, a 6% cap rate on after-tax earnings. After-tax margins on the S&P 500 had moved from the low-double-digit percentage range they had bounced around for decades to something more in the low-teens, which was understandable as the index likely had structurally higher margins with higher quality companies becoming a higher percentage weighting. Thus, after the initial Trump bump back then, we felt that the market was fairly valued to maybe even overvalued.
The most surprising thing to us about the 2017-2019 era in retrospect is how little happened that moved markets. This nothingness was a big deal because the tranquility allowed a big US tax cut to coincide with low interest rates and low regulations. Thus, we were wrong about the resulting earnings per share (‘EPS’) growth at both what we owned (we should have held investments longer) and what the S&P 500 owned, as the index’s EPS grew at a massive 14% CAGR from December 2016 to 2019. Margins went up even higher and multiples followed with the S&P 500 around 3250 right before COVID in January 2020. Then COVID hit and the world had to print a lot of money to make it through. Post-COVID, the world finally learned that inflation and higher interest rates can exist. Today there is a strange dynamic where the world has learned once again how much voters hate inflation, but many Trump policies like tariffs are inflationary, all while the stock market is implying inflation and high interest rates are under control. S&P 500 margins are literally off the charts in the high-teens, and the market is expecting a re-run of 2017-2019 and pricing one in at 6000 for the index, which is a P/E multiple in the mid-20s, which is also off the charts except for 1999-2000 era. Combining both margin and multiple dynamics into one chart really shows how elevated large parts of the US market are at the moment.
S&P 500 LTM Price / Sales (x)
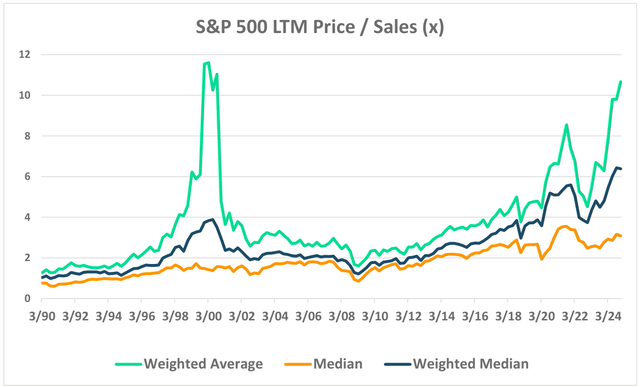
Source: FactSet
We do understand that many countries around the world have not been helping themselves recently. The quarter and the year demonstrated the stark contrast in fortunes for the US stock market compared to the rest of the world. With the return of Trump, the threat of trade tariffs impacted individual stocks perceived as having high exposure and drove a strengthening US dollar which hurt performance for the quarter and the year. In Europe, France is looking for its third government in six months, Germany’s coalition government collapsed towards the end of 2024 and in the UK the Labour government’s first budget was poorly received. Asia has seen governmental change in Japan and other countries the portfolio is less exposed to. Latin America and now even Canada have become targets of Trump’s comments, not helping market perception there, either. What matters most to us when considering the USA vs. non- US markets is price vs. value, and we are finding more mispriced value outside of the US at the moment.
It is not a bold prediction that there will be at least a normal amount of global macro volatility in the next few years. This time, however, there will be less ability to lower tax rates and interest rates to juice the US stock market when volatility hits. It might not feel that way because the same market themes of recent years have been turned up to even louder volumes. It is a sign of the times when these themes seem never-ending.
Stories about compulsive stock traders literally showing up at Gambler’s Anonymous meetings in growing numbers get a shrug these days. In the trailing short term, this has hurt our relative returns differential. It is encouraging that we are starting to see more undervalued companies that are out of step with what is most popular. This speaks to a better on-deck list than our cash level would suggest and reminds us of when 1999/2000 also saw a shift away from the boring yet good. In the coming years – which could come sooner than it might feel – this will help our prospective returns. As we have written before, Southeastern has done well in times of higher rates because individual stock picking is more important when discount rates in discounted cash flows (DCFs) matter more – look at our relative returns in the 1970s, 1980s and 2000s vs. the 1990s and 2010s.
Back to what we own and have owned, while there are a lot of positives, there are two themes of mistakes worth calling out. One is an error of omission: we should have looked harder at high-quality banks during the brief Silicon Valley Bank (OTC:SIVBQ, SVB) turmoil in 2023. We got close, but we did not see how benign the macro environment would be for banks over the just-ended 18 months. This has led to a relative headwind for us vs. the value indices that we can be judged against. We see arguments today that banks still have more room to run. That could be the case, but we are wary of relative- valuation-driven arguments at a time when overall market multiples are elevated.
Our second error was one of commission, which hurts more. We did not move on at the right times from some of our legacy Three Rules violators that we grandfathered into the portfolio because of both their 2022 undervaluation and what we thought could be coming improvements in their leverage and complexity. While we discuss the specifics below, the good news for the go forward is that we have a higher-quality portfolio with great partners on offense.
Notable Contributors & Detractors
CNX Resources (CNX) – Natural gas company CNX Resources was a top performer for both the quarter and the year. The company consistently delivered solid operational results throughout the year, maintaining continued focus on growing value per share. CNX came into 2024 more hedged than peers and with a strong balance sheet that has funded continued share repurchases at a double-digit annualized pace. The company continues to focus on what is within their control, leveraging its low-cost structure and disciplined hedging strategy to deliver free cash flow (‘FCF’) in a variety of price environments. The company also announced an asset purchase in the fourth quarter that both strategically helps its existing assets in the Deep Utica and grows the company’s value per share. CNX remains discounted and one of our stronger value growers over the last few years. Our partners CEO Nick DeIuliis and Chairman Will Thorndike continue focusing on growing long term FCF and value per share. If you would like to learn more about CNX, we hosted a podcast in September with CEO Nick DeIuliis that covers a range of topics.
Kellanova (K) – Packaged food company Kellanova was a top contributor for the year. In the third quarter, it was announced that the company would be acquired by Mars at a slight premium to our appraisal. This outcome was one of multiple potential paths to value recognition when we first invested. The company’s portfolio of strong brands had been undervalued by the market. However, the strategic spin-off of its less attractive cereal business allowed the snacks division to showcase its strengths. While we would have liked to own it longer, the company delivered strong results throughout the year, ultimately attracting a full and fair price by Mars. We exited our position in the third quarter on the price strength after the acquisition announcement.
Millicom (TIGO, OTCPK:MLCMF) – Latin American telecommunications operator Millicom was a top contributor in 2024. A renewed strategic drive from management coupled with solid execution led to a positive FCF inflection, with Millicom raising its equity FCF target for 2024 twice during the year. The company now expects $650 million of FCF, which is attractive relative to an approximate $4 billion market valuation. The company’s improved financial outlook resulted in accelerated deleveraging, reaching its 2025 steady-state leverage target of 2.5x by Q4 2024. Millicom also created value by selling its cell towers for a great price while entering into a highly accretive merger in Colombia. Millicom’s attractive P/V was further highlighted when its largest shareholder, Atlas, made an opportunistic takeover offer this summer (initially at $24 per share, then improved to $25.75), which the Board rejected as undervaluing the company. We agree with that assessment and look forward to another year on offense in 2025.
Prosus (OTCPK:PROSY) – Global consumer internet group Prosus was a contributor for the year. As we noted in our Q3 letter, Tencent (OTCPK:TCEHY), which represents close to 80% of net asset value (NAV) for Prosus, delivered strong results, particularly in gaming and advertising segments, with profits growing faster than revenue due to a mix shift towards higher-margin revenue streams. Tencent continued to repurchase its discounted shares and was on track to complete its HK$100 billion buyback program for the year. Prosus capitalized on improved sentiment towards China by fully divesting its stake in Trip.com (largest online travel agency (OTA) in China) and is gradually reducing its Tencent holdings, with proceeds used to repurchase discounted Prosus shares. New CEO Fabricio Bloisi’s purchase of a significant number of shares in the open market and his compensation structure, linked to doubling Prosus’ market cap in four years, align his interests with long-term shareholder value creation.
Fidelity National Information Services (FIS) – Technology solutions provider for financial institutions FIS was a top contributor for the year. We first started buying this company in 2023 when its bank customers were going through stock market turmoil following the failure of Silicon Valley Bank. As we have written previously, we have seen how resilient the financial technology industry tends to be, even through crises, and FIS has demonstrated this once again with the company’s core bank software business reporting solid growth this year. CEO Stephanie Ferris is proving to be a great partner since she was elevated to the role with FIS making notable strides this year. FIS monetized a non-core business this year at an attractive valuation and used the proceeds to repurchase 10% of its outstanding shares. These actions led to strong double-digit value per share growth in 2024. FIS is a stable company that is on offense yet still trading at a reasonable multiple of FCF – an increasingly rare attribute in today’s market.
Warner Bros. Discovery (WBD) – Media conglomerate WBD was a detractor in the year. We exited our position during the quarter to reallocate capital to opportunities with stronger qualitative and quantitative characteristics. In retrospect, WBD represents an error of commission as noted above. Our original thesis did not fully account for the company’s leverage and growth challenges in its linear TV and studio businesses. Adding insult to injury, the stock price has gone up since our exit, fueled by rumours of a potential linear TV business deal with Comcast. While this development offers some validation of WBD’s strategic assets, it is tempered by significant insider selling following the recent stock price increase. Time will tell if our decision to sell was the right one, but our focus remains on seeking investments that are growing and on offense.
MGM Resorts (MGM) – Hospitality and gaming company MGM Resorts was a detractor for the year. Despite relatively strong execution by the company and opportunistic repurchases of discounted shares, the market did not like the company’s quarter-to- quarter volatility, especially in the second half of the year. When making the necessary adjustments, MGM’s core Las Vegas properties continued to grow nicely if boringly in the low-mid-single digit range during the year. MGM remains one of our larger share repurchasers in the portfolio, demonstrating its commitment to shareholder returns. The company’s hidden assets in online gaming and Asia also showed progress as the year went on. We remain confident in the management team, led by CEO Bill Hornbuckle, as they navigate these challenges and focus on long-term value creation.
Vivendi (OTCPK:VVVNF) and Its Spin-offs – French conglomerate Vivendi was a detractor this year, especially in the fourth quarter when it split into 4 parts: Canal+ (a leading French language media company), Louis Hachette (a travel retail and publishing company), Havas (OTC:HAVSF, a global ad agency) and legacy Vivendi (a collection of disparate assets led by a large position in Universal Music, the largest music company in the world). Vivendi pre-split was complex to start with, and the situation became extra baffling for the stock market at a late in the year time when most market participants were not up for tough decisions. We believe this unique set of corporate actions is the right decision for long term value per share growth and realization. The split in December created multiple opportunities for us to upgrade our portfolio. We will limit our comments to that while we continue to adjust our positions and look forward to talking more about our moves next quarter.
Eurofins (OTCPK:ERFSF) – Laboratory testing services company Eurofins was a detractor for the year and the quarter. Following the Muddy Waters drama earlier in the year, the market remains skeptical of Eurofins, and the company has yet to do enough to dispel these doubts. Organic revenue growth did slow in Q3, to 4.4%, which was seen as a failure versus the company’s own mid-term target of 6.5%, but the lower revenue growth was offset by higher margins resulting in EBITDA and FCF guidance for the year being maintained. Eurofins held an investor day in the quarter which reiterated the core attractions of the business, its structural growth opportunities and path to a transformation by 2027 when the lab network rollout and IT investments will be complete. Both of those projects, the culmination of a 30-year investment journey, have been highly capital intensive and mask the underlying strong FCF potential of Eurofins. At its completion Eurofins will be an approximate €10 billion revenue business with strong margins throwing off €1.5 billion of cashflow, which is attractive vs. the current sub-€10 billion market cap.
IAC – Digital holding company IAC was a detractor for the quarter and year. Operationally, the company delivered strong results, with the key Dotdash Meredith segment achieving accelerating double-digit cash flow growth as the year progressed. Unfortunately, IAC’s stock price remains overly influenced by Angi’s stock price performance, despite Angi representing only a single-digit percentage of IAC’s overall value. This will change this year, however, as in the fourth quarter IAC announced the spin-off of its ownership of Angi. The market took this to mean more short-term stock price pressure for both companies, but we think Angi without the IAC overhang will ultimately trade better, and IAC without Angi will allow the market to focus on high- quality assets like Dotdash Meredith and MGM (discussed above). IAC is also closer to recognizing the value of its other assets, like Care.com and Turo. With a net cash balance sheet at the parent level, IAC is well positioned to go on offense in any market environment and will likely provide more capital allocation clarity in 2025 post-spin of Angi.
Portfolio Activity
During the quarter we purchased four new positions in the portfolio: HF Sinclair (DINO), an energy infrastructure company; Kansai Paint, a Japanese global manufacturer of paints and coatings; an undisclosed consumer packaged goods company we have followed for years and a diversified French company. We also made a number of portfolio moves related to the Vivendi split-up as described above. We exited multiple positions in the quarter to improve the quantitative and qualitative make-up of the portfolio: Accor (OTCPK:ACRFF), Richemont, Entain (OTCPK:GMVHF), Live Nation Entertainment (LYV) and Warner Bros. Discovery.
For the year we purchased several new holdings: Entain, Albertsons (ACI), Reckitt Benckiser (OTCPK:RBGPF), and those discussed above. We exited multiple holdings as well: PVH, Fairfax Financial (OTCPK:FRFHF), Hyatt (H), Fortune Brands (FBIN), Melco International (OTCPK:MDEVF), Kellanova, Warner Music Group (WMG), and the aforementioned fourth quarter moves. It was a year with more change than usual, driven by a unique opportunity to upgrade the portfolio and focus in our best ideas.
Outlook
As mentioned earlier, we are excited about the opportunities in 2025 and beyond. The businesses we own made solid progress this quarter and year. With the Fund’s price- to-value ratio in the low-60s%, we believe there is substantial opportunity in the portfolio today. We have multiple investments on-deck as we constantly look to improve our margin of safety.
Staley Cates completed his retirement from Southeastern in the fourth quarter, as we wrote about in our last quarterly letter. We wish him the best and are grateful as Memphians for his civic work. He has stayed a part of our network and has already heard from us on a stock-specific question or two where he could help. We also continue to work through applicants for our next US Junior Analyst. Additionally, we recently posted a new Data Analyst role that will work with multiple departments at Southeastern.
While we are excited to look ahead, 2025 will also be a year of looking back. Southeastern turns 50 in August. Our strong constitution has gotten us this far, and we are ready to go farther. All constitutions need amendments, and we have been through more change than usual over the last two-plus years. We think our next 10 years will be more like our first 30-35 years. We would expect less change going forward, with the caveat that we will always look to do what is best in the spirit of partnership with you. One communication change for 2025 will be a new note we will send intra-quarter. It will be brief and talk about specific stocks we own and what we are seeing in the market. This idea was inspired by some year-end cleaning when we found a Southeastern pamphlet from the 1980s. What was true then about the principles of alignment and value investing remains true now. We look forward to talking with you soon and remain grateful for your long-term partnership.
|
See following page for important disclosures. Before investing in any Longleaf Partners Fund, you should carefully consider the Fund’s investment objectives, risks, charges, and expenses. For a current Prospectus and Summary Prospectus, which contain this and other important information, visit Longleaf Partners Fund. Please read the Prospectus and Summary Prospectus carefully before investing. RISKS The Longleaf Partners Global Fund is subject to stock market risk, meaning stocks in the Fund may fluctuate in response to developments at individual companies or due to general market and economic conditions. Also, because the Fund generally invests in 15 to 25 companies, share value could fluctuate more than if a greater number of securities were held. Investing in non-US securities may entail risk due to non-US economic and political developments, exposure to non-US currencies, and different accounting and financial standards. These risks may be higher when investing in emerging markets. The FTSE Developed Index is a market-capitalization weighted index representing the performance of large and mid-cap companies in Developed markets. The index is derived from the FTSE Global Equity Index Series (GEIS) which covers 98% of the world’s investable market capitalization. The FTSE Developed Value Index measures the performance of the investable securities in the developed large and mid-cap value segment of the market, which includes companies that are considered more value oriented relative to the overall market. The S&P 500 Index is an index of 500 stocks chosen for market size, liquidity and industry grouping, among other factors. The S&P is designed to be a leading indicator of U.S. equities and is meant to reflect the risk/return characteristics of the large cap universe. Indexes are unmanaged, do not reflect the deduction of fees or expenses and cannot be invested in directly. P/V (“price to value”) is a calculation that compares the prices of the stocks in a portfolio to Southeastern’s appraisal of their intrinsic values. The ratio represents a single data point about a holding and should not be construed as something more. P/V does not guarantee future results, and we caution investors not to give this calculation undue weight. “Margin of Safety” is a reference to the difference between a stock’s market price and Southeastern’s calculated appraisal value. It is not a guarantee of investment performance or returns. Free Cash Flow (‘FCF’) is a measure of a company’s ability to generate the cash flow necessary to maintain operations. Generally, it is calculated as operating cash flow minus capital expenditures. Price / Earnings (P/E) is the ratio of a company’s share price compared to its earnings per share. EBITDA is a company’s earnings before interest, taxes, depreciation and amortization. Net Asset Value (NAV) is a statement of the value of a company’s assets minus the value of its liabilities. Enterprise value (‘EV’) is a company’s market capitalization plus debt, minority interest and preferred shares, and less total cash and cash equivalents. As of December 31, 2024, the top ten holdings for the Longleaf Partners Global Fund: EXOR, 6.0%; Affiliated Managers Group, 5.8%; Canal+, 5.6%; CNX Resources, 5.6%; IAC, 5.3%; FedEx, 5.2%; Albertsons, 4.7%; Fidelity National Information Services, 4.7%; Millicom, 4.4% and Bio-Rad, 4.3%. Fund holdings are subject to change and holdings discussions are not recommendations to buy or sell any security. Current and future holdings are subject to risk. Funds distributed by ALPS Distributors, Inc. LLP001557 Expires 5/15/2025 |
Original Post
Editor’s Note: The summary bullets for this article were chosen by Seeking Alpha editors.
Editor’s Note: This article discusses one or more securities that do not trade on a major U.S. exchange. Please be aware of the risks associated with these stocks.


