


Average Annual Total Returns for Period Ended 6/30/2024
|
Class |
Qtr(%) |
1 Year(%) |
3 Year(%) |
5 Year(%) |
10 Year(%) |
Since Inception(%) |
Inception Date |
Gross ExpenseRatio (%) |
|
nvestor (MUTF:TWEIX) |
-1.30 |
5.20 |
3.64 |
5.85 |
7.59 |
9.81 |
8/1/94 |
0.93 |
|
I |
-1.25 |
5.28 |
3.80 |
6.06 |
7.79 |
8.29 |
7/8/98 |
0.73 |
|
R5 |
-1.25 |
5.29 |
3.81 |
6.07 |
7.79 |
6.90 |
4/10/17 |
0.73 |
|
R6 |
-1.09 |
5.55 |
3.99 |
6.23 |
7.97 |
8.42 |
7/26/13 |
0.58 |
|
Russell 3000 Value Index |
-2.25 |
12.93 |
5.14 |
8.89 |
8.10 |
– |
– |
– |
|
Data presented reflects past performance. Past performance is no guarantee of future results. Current performance may be higher or lower than the performance shown. To obtain performance data current to the most recent month end, please visit www.americancentury.com/performance. Investment return and share value will fluctuate, and redemption value may be more or less than original cost. Data assumes reinvestment of dividends and capital gains. Returns for periods less than one year are not annualized. For information about other share classes available, please consult the prospectus. There is no guarantee that the investment objectives will be met. Dividends and yields represent past performance and there is no guarantee that they will continue to be paid. Historical performance for the R5 Class prior to its inception is based on the performance of I Class shares, which have the same expenses as the R5 Class. Expense ratio is as of the fund’s current prospectus. The I Class minimum investment amount is$5 million($3 million for endowments and foundations) per fund. The R5 Share Class is available only to participants in group employer-sponsored retirement plans where a financial intermediary provides recordkeeping services to plan participants. Periods greater than one year have been annualized. |
Portfolio Review
U.S. stocks advanced. During the quarter, broad U.S. equity markets rose amid moderating inflation, strong corporate earnings growth and weakening employment data. While the Federal Reserve kept interest rates steady, policymakers suggested they may cut rates once by year-end.
Large-cap growth stocks led U.S. equities higher. While large-cap growth stocks delivered notable gains, value indices declined across the market-capitalization spectrum. Mid- and small-cap growth indices also fell.
Financials was an area of strength. Opportune stock picks in the financials sector contributed to the portfolio’s outperformance of the benchmark for the period. Strategic picks in the insurance industry, where the portfolio is overweight relative to the benchmark, helped.
Information technology contributed. Stock selection in the information technology sector gave the portfolio’s performance a boost compared with the benchmark. Avoiding certain names in the benchmark helped results. In particular, not owning Intel, whose foundry business reported weak financial results, aided performance.
Industrials pressured performance. The industrials sector, where the portfolio is broadly underweight relative to the benchmark, hampered results. Allocation among names in the ground transportation industry weighed on performance compared with the benchmark. In particular, an overweight holding in Norfolk Southern was a laggard, given that its rail volumes were soft during the period.
Key Contributors
Roche Holding (OTCQX:RHHBY). Shares of this Switzerland-based pharmaceutical company rallied on news of encouraging clinical trial results for its GLP-1 obesity treatment.
Intel (INTC). Lack of exposure to the common stock of this semiconductor company helped relative performance. Intel’s shares underperformed after the company provided worse- than-expected financial results for its foundry business.
Unilever (UL). Shares of this consumer goods company rose after Unilever released quarterly results that exceeded expectations. The company has increased its product sales volume, which seems to have helped investors gain comfort around the sustainability of Unilever’s sales growth.
Key Detractors
Medtronic (MDT). This medical device stock underperformed on concerns about health care utilization slowing in the future. Medtronic also reported slightly weaker margins for its recent quarter. However, in our view, Medtronic is trading at a very attractive valuation, and the company should be able to expand its margins over time.
Norfolk Southern (NSC). This railroad company underperformed after an activist investor was only successful in electing three directors to the board’s 13 seats. Norfolk Southern’s rail volumes also continued to be soft.
Kenvue (KVUE). Shares of this consumer health company underperformed after a corporate shareholder sold a large amount of stock. In addition, Kenvue is facing some temporary headwinds in one of its relatively seasonal businesses, weighing on the earnings potential of that business.
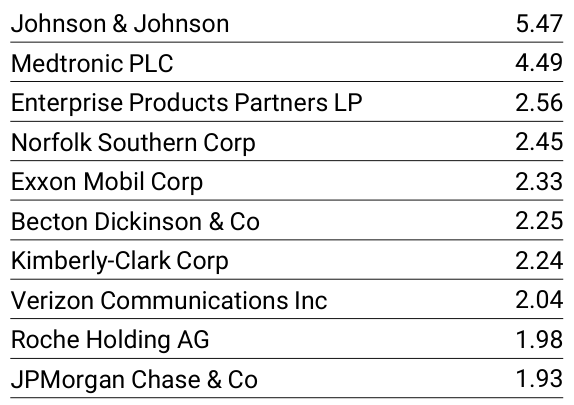
Top 10 Holdings (%)
|
As of 6/30/2024 The holdings listed should not be considered recommendations to purchase or sell a particular security. Equity holdings are grouped to include common shares, depository receipts, rights and warrants issued by the same company. Fund holdings subject to change. |
Notable Trades
Microchip Technology (MCHP). We initiated a position in this convertible security because we believe it offers an attractive risk/reward profile. In our view, the company’s actions, such as its recent cost-cutting initiatives as revenue and earnings appear to be bottoming, should result in relatively stable margins.
Analog Devices (ADI). We initiated a position in this semiconductor company. Recent weakness in automobile and industrial demand weighed on its shares, providing an entry point that we deemed attractive. We think the company is high quality and should benefit from higher electric vehicle and advanced driver-assistance systems adoption.
Texas Instruments (TXN). We exited our position in this large analog supplier. We think its risk/reward profile is less attractive, and the company’s aggressive capacity expansion plan over the next few years could weigh on its free cash flow and margin.
Chubb (CB). After years of strong relative outperformance, we viewed the valuation of this insurance company as less attractive. In turn, we exited the position and used the proceeds to fund other positions with risk/reward profiles that we deemed more attractive.
Portfolio Positioning
The portfolio seeks to invest in companies where we believe the valuation does not reflect the quality and normal earnings power of the company. We believe this can result in a portfolio with less volatility. Our process is based on individual security selection, but broad themes have emerged.
Higher-quality stocks may offer resilience. We believe that, while central banks may enact small cuts to interest rates if inflation continues to subside, the economy should still experience the lagging effects of elevated rates over the next year. That, along with continuing geopolitical risks, may contribute to an uncertain economic environment for investors. Against this backdrop, we continue to focus on companies that we view as higher quality with stable revenues and profits, low indebtedness, stable cash flows and predictable business models that are less sensitive to economic conditions.
Opportunities in consumer staples and utilities. We maintain a significant overweight in consumer staples. Even as consumers grapple with economic pressures like inflation, they still have to buy the necessities sold by companies in the defensive consumer staples sector. We also remain keen on utilities for their defensive nature and attractive valuations, as well as the potential for new electricity demand from data centers supporting the computing power of artificial intelligence.
Remaining selective in regional banks. While bank valuations are historically low, regional banks continue to face headwinds to net interest income from the higher cost of deposits, while loan growth is subdued. Also, regulatory requirements for capital and liquidity have been rising since the bank failures last year. Despite the challenges to regional banks, we continue our focus on attractively valued equities in the financials sector that generate consistent returns from diverse sources that also maintain strong capital and liquidity ratios.
Few opportunities in consumer discretionary and real estate. While consumer activity has provided significant support to the economy, recent economic reports point to a slowdown in spending. That may put pressure on consumer discretionary stocks, a sector where we already find it difficult to identify companies with durable business models. Within the real estate sector, our metrics continue to show that most equities remain overvalued.
Our exposure to the communication services sector remains limited. The portfolio is underweight relative to the benchmark in the communication services sector. To us, many companies in this sector have volatile business models and high levels of debt, which prevents them from meeting our investment criteria.
|
You should consider the fund’s investment objectives, risks, and charges and expenses carefully before you invest. The fund’s prospectus or summary prospectus, which can be obtained at American Century Investments® Home, contains this and other information about the fund, and should be read carefully before investing. The fund invests in convertible securities, which may be affected by changes in interest rates, the credit of the issuer and the value of the underlying common stock. The fund also may invest in foreign securities, which can be riskier than investing in U.S. securities. The opinions expressed are those of the portfolio investment team and are no guarantee of the future performance of any American Century Investments portfolio. Statements regarding specific holdings represent personal views and compensation has not been received in connection with such views. This information is for an educational purpose only and is not intended to serve as investment advice. The information is not intended as a personalized recommendation or fiduciary advice and should not be relied upon for investment, accounting, legal or tax advice. The Russell 3000® Value Index measures the performance of those Russell 3000® Index companies(the 3,000 largest U.S. companies based on total market capitalization) with lower price-to-book ratios and lower forecasted growth values. The Russell 3000® Index is a trademark/service mark of the Frank Russell Company. Russell® is trademark of the Frank Russell Company. IN-FLY-92059 American Century Investments Services, Inc., Distributor©2024 American Century Proprietary Holdings, Inc. All rights reserved. Non-FDIC Insured May Lose Value No Bank Guarantee |
Original Post
Editor’s Note: The summary bullets for this article were chosen by Seeking Alpha editors.
Editor’s Note: This article discusses one or more securities that do not trade on a major U.S. exchange. Please be aware of the risks associated with these stocks.
 Q4 2024 Earnings Call Transcript")


")
