


")
Introduction
In my last analysis we talked a little about companies that are adopting a defensive strategy to navigate a slow traffic scenario. Endogenous and exogenous pressures require the definition of a strategy, and it seems that among QSRs, adapting to the time preferences of low-income guests is the most natural strategy. After all, there is direct competition with convenience stores.
In this context, I invite you to take a deep dive into the strategies and recent developments of Jack in the Box (NASDAQ:JACK), one of the big names in QSR with the peculiarity of having a large part of its units located in California, the epicenter of AB 1228.
Before we begin our analysis I would like to talk a little more about the current situation before getting into the actual developments. First, no one is immune to the downturn and like almost the entire industry in the first quarter, Jack reported a sharp decrease in same-store-sales, both in its own stores (0.6%) and in franchises (2.6%). Del Taco, which is another concept owned by Jack, reported a decrease in SSS of 1.4% system-wide. Basically, with the drop in traffic, restaurants that had a positive SSS in the quarter needed to compensate for this factor with an increase in the average check. In Jack’s case, the company even managed to increase the average check by 3.1%, but this was not enough to compensate for the 3.7% drop in traffic.
Although we do not see major changes in operating costs for the Jack in the Box concept, with labor costs representing 30.6% of all quarterly revenue within the restaurants operated by the company, the company is going through a period of refranchising aiming to contain operational costs. In the Del Taco concept, for example, labor costs grew by 1.4%, reaching 34.9% of all revenue generated. Remember the ’30/30/30 Rule’. This is generally the minimum acceptable standard when dealing with operating costs in restaurants.
Probably aware of this, the company made some changes to the units’ management models. In 2023, the company refranchised 5 Jack in the Box units and 16 Del Taco units. This year, even before the end of the first semester, the company refranchised 13 Del Taco units. This movement will probably have consequences in relation to the volume of revenue generated by the company, but it is an important movement that aims to contain costs in order to sustain growth without using an absurd amount of capital.
Until last year, Del Taco was made up of 46% owned units and 54% franchised. At the moment, the concept has approximately 28% of its own units and 72% of franchised units. This movement should continue until the composition becomes similar to that of Jack in the Box, which in 2024 has 7% of its own units and 93% of franchises.
Now that I’ve introduced the company’s current situation, let’s navigate topic by topic and understand how Jack is positioning itself within the industry
Some generalities about the QSR situation in California and rising labor costs: How does this impact traffic and margins?
With a large portion of its units located in California, I consider it important that we dedicate a section to understanding how the impacts of AB 1228 are affecting QSRs within the current dynamics of the restaurant industry. First take a look at the numbers.
The state of California is Jack’s main market, accommodating 949 units. This represents about 43% of all its units, ahead of Texas (with 584 units and representing 27% of total units) and Arizona (with 178 units and representing 8% of total units). When we look at the population/restaurant ratio we have very attractive numbers even with the large concentration of units in two states. There are 41,945 people per restaurant in California, 49,651 in Texas and 40,893 in Arizona. In Los Angeles alone, Jack has 42 units, six more than in San Diego.
Given this high concentration of units, it is clear that setting the minimum wage at $20 per hour only in QSRs would have significant impacts for Jack. But before we look inside, I invite you to look outside. How does the minimum wage policy affect the segment? At the end of the day, as the famous French author Frédéric Bastiat says, we must not end our investigation on what is seen, but we must seek to know what is not seen.
Yes, the first basic observation (what you see) would be the decrease in traffic and the increase in labor costs. These labor costs need to be passed on if the company wants to keep its margins intact. But if guests are becoming increasingly price sensitive and there is a whole host of substitute products threatening the financial integrity of restaurant operations, that cost will be passed along with the bitter price of decreased traffic. Let’s talk about decreasing traffic first.
According to a very interesting survey by Placer.ai, fast-food chains within the state of California had weaker traffic than the national average in 10 of the 12 weeks after the law was enacted. This is clearly a sum of three interconnected factors.
The first factor is due to substitute products. Convenience stores, bakeries and markets are taking a share of the restaurant market precisely because they present cheaper and sometimes just as appetizing options. According to Porter, substitute products have a very interesting task in the dynamics of industries and competitive strategy: they reduce the potential returns of an industry. And so we saw this happening in practice precisely with the low-income guest, but all the guests seem to be giving in little by little. Research by Technomic presents us with some impressive results regarding this fact.
The number of people who visit restaurants at least once a week fell from 68% to 67%. When we looked at low-income guests we also saw a drop from 59% to 58%. On the other hand, when we look at convenience stores the scenario is very different. The percentage of customers who go to convenience stores increased from 57% to 59%, and when we look at low-income consumers, this number increased from 55% to 58%.
The second factor is also clear as a sunny day. Labor costs needed to be passed on for the sake of earnings integrity. I’m not saying that the price increase started only when we saw an increase in labor costs, but well before that. As I said in my RBI analysis, many fast-food chains have raised prices at two and even three times inflation in the last ten years. This was the case with McDonald’s (MCD) with a 100% increase in prices since 2014 and Popeyes increasing by 86%. Other chains like Wendy’s (WEN) and Burger King (QSR) were a little more restrained and rose 55%. An important observation is that inflation in the same period was 31%.
The third factor, and this is interesting because it represents a dynamic within California that differs from the rest of the country, is that the decline in QSR traffic is being pressured by the underlying increase in traffic at full-service restaurants. Also from the perspective of Placer.ai’s research, we can note that traffic was positive in eight of the last twelve weeks, surpassing quick service restaurants in all periods analyzed. This indicates that there is a transfer of occasional guests who prioritize value and experience within the benefits they expect at the time of the meal (something that is much more present and malleable within full-service restaurants by their very nature). Everything in the end comes down to the value perceived by the guest.
This is interesting because the national average of traffic at full-service restaurants has been quite different in the rest of the country in the last two months than within California, as shown in the following graph:
Placer.ai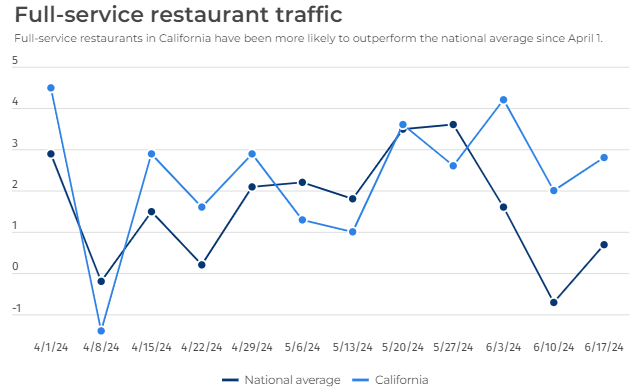
In finance we generally measure the cost-benefit of certain projects by relating the present value of cash flows to the initial cost, whereas in marketing everything is more subjective. The cost-benefit index for consumers has to do with the relationship between expected benefits and perceived value. If guests have the opportunity to enjoy a full-service meal with all the underlying benefits that such a restaurant offers for a price just a little higher than a QSR, the answer becomes obvious and explains this phenomenon caused by the increase in the minimum wage within California and the situation we see today. Putting this discussion once again under ‘Porterian’ terms we have a substantial competitive advantage in favor of full-service restaurants within the state.
If you’ve read my previous reviews, you know that this dynamic between limited-service restaurants and full-service restaurants only occurs within California. We have plenty of examples to confirm this. Companies like BJ’s (BJRI), Chuy’s (CHUY), First Watch (FWRG), Olive Garden and the entire portfolio of Darden (DRI) concepts except Longhorn, Dine Brands (DIN) and many other service restaurant chains complete showed a decline in traffic.
Speaking specifically about Jack now, we know that the company is committed to offering an attractive value offer, recognizing the need to adjust price-based promotions to navigate this scenario. At the end of the day, QSRs are closer to competing with convenience stores than the broader value proposition offered by full-service restaurants, so when it comes to limited-service restaurants there is almost an overwhelming need to bring back the low-income guests, and that’s what Jack seems to admit. We will talk about promotions later.
Within this context we saw the company’s SSS drop 2.5% system-wide, mainly driven by the decrease in traffic. This number worsens when we consider franchises, which had a SSS reduction of approximately 2.6%. Meanwhile, company-owned restaurants had a 0.6% lower SSS.
Now talking about labor costs and how this impacted margins this last quarter, we have the following overview:
Total revenue (Own restaurants and franchises) and operating costs (Author)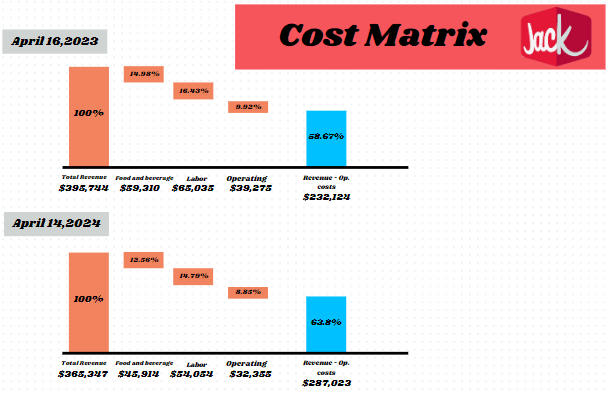
Unlike most restaurants, in the last quarter Jack was able to proportionally reduce labor expenses as its revenue from its own restaurants decreased. That is, through the franchise model the company is reducing labor costs. Proportionally in the quarter, Jack reduced labor costs by 1.64%, and the same panorama was seen in the other operational cost centers. Now, when we relate revenue from own operations to labor expenses, we obtain a proportion of 32% in the second quarter of 2023 which increased by less than 0.5%. In a simpler way, we can say that Jack is ‘leveraging’ its franchise model to absorb the rise in labor costs, reducing the pressure on its financial resources.
To summarize this dynamic, we can infer that despite the increased pressure on labor costs, Jack is optimizing the management of this cost center and increasing the performance of its franchise model, even when this reduces revenue from its own operations, managing to transfer part of these costs and preserving the integrity of its operations. Regarding slow traffic, with the imminent price increase to contain costs, it is expected that this trend will continue to repeat itself as long as macroeconomic pressures remain tight and low-income guests are kept away by substitute products and full service restaurants (the latter specifically within California).
In this scenario, it is important that we take a look at the mix of promotions and other developments that serve as an attraction for low-income guests, and that is what we will discuss in the following section.
How does Jack fit into an environment focused on financial efficiency and price-based promotions?
To start, let’s take a look at Jack’s mix of promotions. We know that management is committed to the return of traffic and low-income guests, which is essential for the operation of the QSR and the maintenance of traffic. After all, this is a volume-oriented segment, with few opportunities to add value through its dynamic, streamlined nature and a price-sensitive guest.
At the end of May, Jack launched its ‘Munchies Under $4’ promotion. This promotion consists of a menu of selected items with great appeal for less than $4. The promotion includes Jr. Jumbo Jack, Tiny Tacos, French Toast Sticks, and the new Sourdough Grilled Cheese, among other options. The new promotion is clearly targeted at low-income guests, in the same vein as other fast-food chains we’ve seen recently. This is a strategy that aims to influence the balance of forces within the QSR segment, presenting a strategy that aims to combat the actual causes of traffic reduction.
If you are paying attention to the industry, you will remember that almost all of Jack’s direct competitors also established segmented promotions for the most price-sensitive guest. Burger King launched and promised to maintain the “Eat Like a King” promotion until the end of the year, which consists of choosing a sandwich option from three available (Chicken Jr., Whopper Jr. or Bacon Cheeseburger), fries, nuggets and drinks, all for $5. Popeyes, which is also an RBI brand, has reintroduced its “Big Box” with two pieces of fried chicken, a choice of side and a lentil biscuit for $6.99. Wendy’s with breakfast for $3 and the “Biggie Bag”, offering a similar offer to Burger King, but with upscaling options ranging from $4 to $6. McDonald’s also launched a McChicken or McDouble promotion with nuggets, fries and a drink for $5 in June, lasting an estimated month, despite some claims from franchisees that were circumvented through a deal with Coca Cola (KO). . There are many examples, we could spend a good amount of time talking about them. But the most important fact is that Jack is acting reactively to market movements, and this demonstrates that the company is committed to bringing low-income guests back to restaurants.
The efficiency of using the park is also being considered by the company. Wendy’s, for example, has been relying on its off-premises sales in the mornings, which have proven to be an interesting weapon for generating alternative sources of revenue in historically slower periods. We also have some developments of this type at Jack. First in the morning, the company made Toast Sticks a permanent item on the menu and believes that this inclusion will gradually strengthen the park in the morning on a consistent basis. During the evening, management also believes they have a chance to gain market share, mainly by reintroducing Chick-n-Tater Melt and marketing efforts.
The most interesting thing here is that Jack is not living off promotions alone. We talked a little about ‘barbell menu strategy’ and how this is especially important in the current scenario. In early 2024, the company launched the Smashed Jack Burger, made with seasoned beef, topped with grilled onions, thick pickles and a new sauce called Boss Sauce, served on a buttery brioche bun. The pricing is more attractive to ‘premium’ guests and serves as an interesting lever to increase the average check. It turns out that after a very strong launch, the supplier halted production, forcing Jack to halt sales until the supply chain stabilized in March. After its return, the Smashed Jack Burger helped catapult the average check by 2%, which is curious to say the least. I believe that Jck got the pricing right for Smashed, as it is at a threshold where low-income guests can still try it while still guaranteeing a significant cash inflow when compared to promotions. And often the cash inflow is as significant as substantial margins.
New POS, new possibilities
In the digital field I see Jack still a little behind its direct competitors. Around 13% of all its sales are in the digital environment. RBI, for example, increased its sales in digital channels from $13 billion in 2022 to $14 billion in 2023, an increase of almost 8% across all its brands. Burger King US alone showed 40% growth in the digital channel, which represents around 27% of all total sales. At Popeyes, approximately 25% of all sales are made through digital channels. At YUM! Brands (YUM), we saw a 25% increase in digital sales over the same period, with Taco Bell achieving an impressive 31% increase in digital sales. Wendy’s, slightly above Jack in this sense, reached the mark of 14.5% of its total sales through digital channels. As you can see, there is no shortage of examples.
In the digital field, another very interesting development is the integration of the new POS, called Qu. If you read my review of Dine Brands and how the integration of data collected by Tray POS is being used to generate IHOP in-app purchasing suggestions and how this is helping to increase the average check per guest, I highly recommend strongly reading. These are ways in which restaurants can adopt data management and artificial intelligence to generate extra sales, and this is the future for the industry, there is no way around it. But what are the benefits of this new POS for Jack, and how will the reach of digital sales enhance the guest experience?
First of all, the new POS will aid in operational efficiency in routine tasks such as integration of payment methods, order management, kitchen management, staff management for peak hours, effective implementation of self-service kiosks, menu management and of stocks. Note that in the long term, after the complete integration of the restaurants with the new POS, more accurate management of these processes will help Jack to expand its margins and achieve stronger results. It is interesting how almost all players are developing process management solutions that involve integrating the POS with some AI system that assists daily processes.
We can give some examples of this. BJ’s Restaurants (BJRI) is a chain of casual dining restaurants that is standing out by improving its profit margin by adopting processes that benefit its operational efficiency, especially after PW Partners adapted the company’s cost structure. Integrating your POS with the AI tool allows you to identify the busiest days in advance, so managers at the unit level can make decisions that increase the efficiency of operations.
Another interesting example is the case of Starbucks (SBUX). With queue management problems in recent times, mainly due to the complexity of preparing customizable drinks and logistics with ice, the company developed the ‘Siren Craft System’. This system is basically an update of the same one the company used in 2022 and consists of three distinct fronts. The first relates to the adoption of new preparation routines. The second is the creation of the ‘Peak Play Caller’ employee figure, who can change roles according to traffic needs. And the third is the integration of AI-based predictive tools with the POS to detect critical moments for the formation of very long queues and increased waiting times.
When we talk about POS integrations with AI for suggestions for online sales platforms like IHOP, we still don’t have a concrete forecast, but the most important fact for Jack is that this is now achievable.
Remodeling and lean units: a point of convergence
As I have always said in my analyses, the development of lean units is more than desirable, it is necessary. With a very mature industry and profitability being sucked up by substitute products and high entry barriers related to economies of scale, industry managers are increasingly valuing expansion projects through units with a higher cost-benefit ratio and a lower payback. In fact, in my last text in which I wrote about First Watch, one of my points of criticism was precisely the underutilization of assets and the lack of projects aimed at lean units, despite developing some very interesting renovations in the kitchen.
And don’t think that even within the theme of lean units there is no differentiation, quite the opposite. Bloomin’ (BLMN), for example, underwent a broad project in 2023 to remodel and close Outback units that were not performing satisfactorily, which became known as the “2023 Closing Project”, where 10 of its own units were closed in the United States, all of which were units of old models. On the other hand, in 2021 Bloomin’ developed a type of unit called “Joey”, which is 4,800 to 5,000 square feet. Approximately 16 Joey units were opened in Brazil in 2023.
Dine Brands, in contrast to smaller units with greater reach to lower volume markets, developed the dual-branded unit, which interconnects an IHOP unit with an Applebee’s unit contiguously, without internal partitions. Note that this model optimizes the park at different times for the two concepts, as each one has its own peculiarities regarding peak traffic hours, however its implementation is not lean, quite the contrary, opening costs are even bigger.
Once again, there are many examples. For Jack we have the ‘CRAVED’ model. The plan is for the company to achieve a net growth of 2% per year in relation to the number of units, with all new openings using the same prototype, which is already being used in Mexico, where Jack opened its first unit in the second quarter and is already attracting the attention of operators, according to the CEO. The ‘CRAVED’ model has an estimated payback of less than five years and is already being implemented in 88 restaurants that are at some point in their development phase.
To have some basis for comparison in relation to the estimated payback of the ‘CRAVED’ model, which is 5 years or less, let’s take a look at some projects that I have been following. Portillo’s (PTLO), a fast-casual chain recently released some data about its “Units of the Future”, developed to spearhead its accelerated expansion project. The company currently has paybacks of 8 years for units in the Midwest, 7 years for units in the Sunbelt and 4 years for a unit in Chicagoland. After the introduction of lean units (scheduled for 2025), paybacks would decrease to 6, 5 and 3 years respectively.
A five-year payback is what most restaurants want when developing lean units. This generally means a decrease of two to three years in the payback of an average volume project. Along the same lines and with an average payback of five years, there are also the new units of Potbelly (PBPB) and Walk-On’s Sports Bistreaux. Therefore, I see the ‘CRAVED’ units as a good sign that the company is acting proactively within the new industry requirements. This is a sign that there is the possibility of expansion in the medium term, perhaps internationally.
Some considerations about financing and investments
Before formulating my thesis for Jack, I would like to establish some comparisons about the company’s profitability. To do this, I would like to examine some metrics that will help us discover how Jack behaves in relation to some direct competitors. Let’s do this quickly so we don’t go on too long:
Author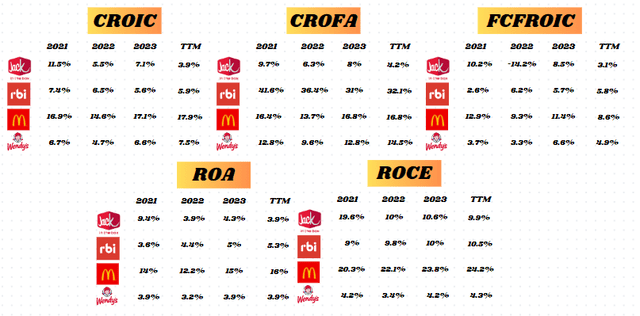
At first glance we can notice a decrease in the rate of return using operating cash flow. That is, in simplified terms, the company is generating a lower cash return in the last twelve months than before. But how did this happen if net profit did not show anomalous variations during this period. Simple, the OCF for the last twelve months was directly impacted by an accumulation of operating accounts, more precisely due to receivables. For the first time in two years, Jack presented a negative operating cash flow, and this occurred at the end of last year, accumulating $107.5 million in operating assets that needed to be covered through investment in current assets and consequently reduced the OCF. In the last quarter, Jack still had its OCF reduced by just over $3 million for the same reason.
However, despite keeping the OCF reduced due to this clutter in the operating accounts, Jack still managed to maintain a record investment of $98.8 million in Capex and maintain a positive free cash flow. Note that despite these problems, Jack managed to maintain its free cash flow on invested capital at levels similar to Wendy’s. If we normalized its free cash flow to non-anomalous levels we would have a free cash flow of approximately 6%, which is not bad at all.
Also note the difference between ROA and ROCE. This is precisely due to the comparison method and the exclusion of interest paid on third-party capital and taxes on the latter. In conjunction with the high burden of implicit costs on third-party capital, Jack also has many sources of operational financing in current liabilities, which reduces the need for financial liabilities to fund immobilization and also reduces the capital employed. To give you an idea, when we exclude the effects of interest and taxes, Jack shows an EBIT margin of 15.14%, which is more than 90% higher than the industry median.
This brings us to the need to take a look at Jack’s financing structure:
Author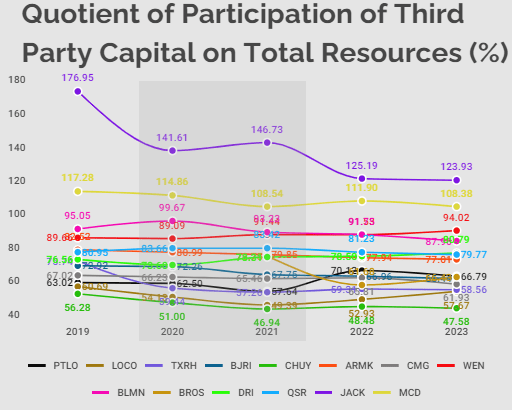
Note that even by industry standards, Jack finds itself with very high levels of debt. Despite the reduction in leverage since 2019 (where the company reached a debt ratio of 176%), the company only reduced just under 5% of its long-term debt over the course of two years, which still continues to put pressure on its operating profit . Remember, despite this, the company does not incur short-term debt to maintain its investments in operational assets, but uses operational liabilities, mainly those not related to the cash conversion cycle, but which help the company to not have to incur “addictive” short-term loans. In any case, depending on short-term loans or not, I consider Jack’s debt levels to be quite high. Despite not incurring a massive economic risk due to the satisfactory generation of EBIT, the company incurs massive financial risk due to leverage.
Still on debt, I would also like to make some brief considerations about the imminence of financial risk and the possibility of economic risk based on coverage data. Firstly, I was able to identify a deterioration in the Debt Efficiency index (Return on Debt/Cost of Debt). The index in 2017 was 5.6, falling to 2.7 during the pandemic and maintaining a range between 2.8 and 4.0 until then. Both the return on debt and the Debt Efficiency are at levels below their 10-year average.
Other indicators that I modeled were related to debt coverage from Cash Flow. As you already know, Jack’s Cash Flow has been suffering for some time due to an increase in operational accounts, mainly at the end of 2023 and beginning of 2024. We have already talked about this. But what we haven’t talked about yet is how this affects debt coverage. With Cash Flow stagnant and debt rising (at least until 2019) we noticed a deterioration in principal coverage using OCF. Over the last ten years, Jack maintained an average principal coverage ratio with an OCF of 7.71. This meant that Jack generally needed a little more than 7x its OCF for the corresponding year to cover its debt principal. Jack currently maintains an index of 14.9. For those interested in more heterodox data, debt interest coverage from the OCF through the debt service coverage indicator adjusted for cash flow variability also deteriorated, falling from 2.79 in 2019 to 1.94.
To have a basis for comparison, the average coverage of indebted companies like Bloomin’ Brands is 8.09. In the case of Debt Efficiency, despite seeing a drop in pre-pandemic standards, Jack still outperforms direct competitors such as Wendy’s, which has maintained an index of 2.17 in the last five years, while Jack has an index of 3.14 in the same period. Therefore, we can say that even though it is very indebted and needs to restructure its financing sources, Jack is still able to maintain solvency rates in line with companies (despite being very indebted) that are less indebted than itself.
My thesis
In my opinion, Jack has everything a limited-service restaurant needs to navigate an environment that suffers exogenous pressures (due to substitute products and increases in labor costs) and endogenous pressures (promotional environments and industry-level margin compression). This implies that the company is actively positioning itself so that its capabilities integrate new industry paradigms.
Promotions with appeal, use of barbell pricing in menu engineering, premium items with a satisfactory gross cash inflow, successful launches (see the case of Smashed Jack Burger and all the buzz on social media) make me see that both prices and The products are aligned with industry paradigms.
Broader strategies such as the integration of a modern POS that allows the use of all the benefits provided by AI are also almost mandatory today. Although in this sense Jack is not at the same level as its peers, the recent integration with Qu seems to me that there will be developments in this regard. Therefore, the coming quarters should see an increase in digital sales as the company completes this integration.
Other needs that I also see as mandatory are the optimization of the park at times with lower traffic and the development of lean units being developed within Jack. The ‘CRAVED’ unit appears to have a very satisfactory payback and will be able to lead the international expansion project. In this sense, I see the success of the units in Mexico and the interest of new operators as something very interesting and should also be observed closely. Another very interesting point is the refranchising of company-owned units. This is helping and will likely continue to help Jack deal with rising labor costs in the long term.
Furthermore, the aspects that concern me at the moment refer to the structural aspects of the company. We saw a dilapidation in solvency ratios, corroborated by a weaker operating cash flow and a persistently large long-term debt that appears to be out of step with the EBIT, which continues to grow slowly, typical of mature companies. However, Jack maintains a negative net need for working capital, managing to finance its working capital from operational liabilities. This implies that even with the increase in operating assets that we have recently seen cluttering up the cash flow, Jack does not appear to have a need to increase financing and increase its total debts.
In my opinion, these structural factors are resolved when we compare them with other indebted companies (as I have done previously) and look at their undervaluation. Therefore, even with these headwinds, I still see potential in Jack within the current environment, as the company is adapting to the vast majority of needs that a modern QSR must seek.
At current price levels I would recommend ‘Buy’ for Jack. I believe that all the problems we discussed previously have already been priced in. The company is taking extensive measures both to maintain margins and to attract lost traffic by presenting a very interesting promotional mix.
Valuation
I would like to start our valuation procedure today not with the ‘Comps’, but with the NPVGO Model. To accomplish this, we need to calculate both the value of your current operations and the value of future growth opportunities. We consider EPS for fiscal 2024 to be in line with analyst estimates of $6.32. For the discount rate I used 7.97%. The payout rate for Jack is approximately 29%, naturally the retention rate will be 71%.
Thus, the retention per share is $4.49, which will generate growth from retention of just $0.28 in the first year of retention, $0.29 in the second and $0.31 in the third. As the retention-based investment serves as the initial cost of investment projects each year, we have a negative NPV all these years, which when we bring it to present value with the help of the discount rate we have the following values for the next three years : -$0.89, -$0.86 and -$0.83.
But you may even wonder: why do managers choose projects with negative NPVs? Wouldn’t it be easier to distribute a higher percentage of the profit. The issue is not that simple. Stephen Ross, a leading professor of corporate finance conjectures that managers like to control large companies and retain profits rather than pay dividends and thus increase the size of the firm. Anyway, when we calculate the perpetual value of NPVGO it is -$27.31. We need to add this to the value of the firm as if it were a ‘cash cow’, using the EPS to calculate the simple perpetual value, which is $79.30. This means the enterprise value + NPVGO is $51.99. This is approximately 5.3% above the current share price.
Let’s see how this happens in the ‘Comps Model’? I selected five companies to compare with Jack. The result is in the following table:
Author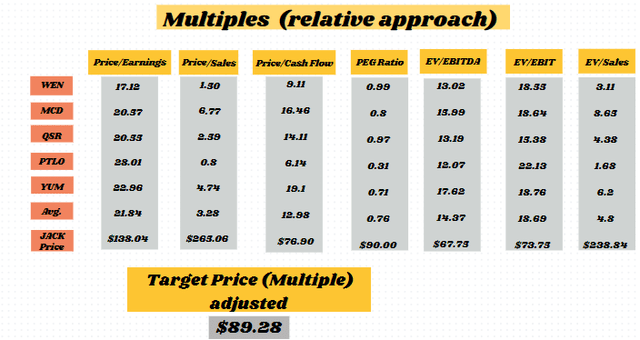
Note that to arrive at the value of $89.28 I excluded from the average both Price/Sales and EV/Sales which were inflating our target price using the Comps model. Remembering that I used both Equity ratios and Enterprise ratios, the latter being multiples that consider the capital structure. Note that even considering the capital structure, both EV/EBIT and EV/EBITDA present prices higher than the current value of the share.
Now we can look at the discounted cash flow models. First let’s start with dividends. We already know that because the payout is low (less than 30%), the expected dividend (D1) will be lower and, consequently, our target price will be lower. To resolve this fact, I will use the Single Period DDM and the Multi Period DDM, this way we will avoid considerations regarding the growth of these dividends. The result is what you see in the table below:
Author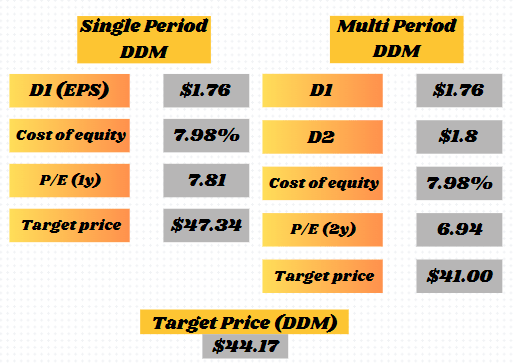
Now let’s model the DCF. For WACC we will consider 6.73%. The following image is the FCFF forecast for the coming years:
Author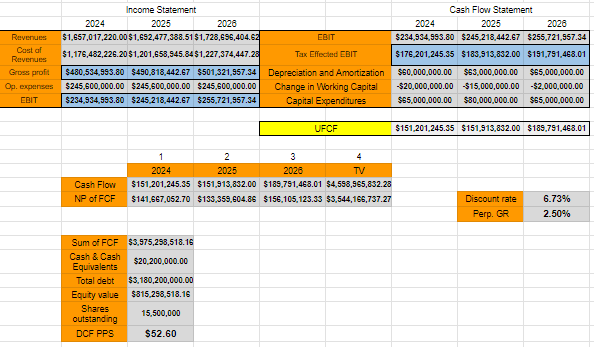
Note that the DCF model also indicates that the share is being traded below its intrinsic value, more or less in line with the value we found in NPVGO. However, in this case, the price based on the DCF points to an upside of approximately 6.5%.
We can still use the Graham Model and the Lynch Model to obtain some other perspectives that corroborate the undervaluation hypothesis. For growth in the Graham Model I used the internal growth rate (which we use in the NPVGO Model). For the Lynch Model, I used the estimated EPS growth rate for the next fiscal year. Remembering that as the Lynch Model does not indicate a target price, but rather a state of relative valuation, it will not be included in our ‘football field’ graph and consequently in the analyst’s definitive target price.
Author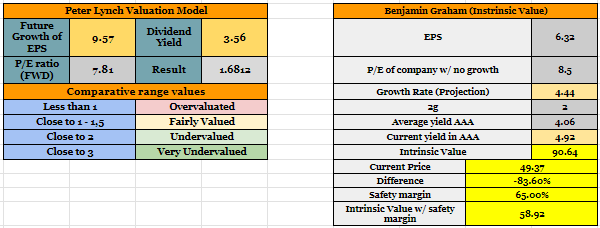
Now that we have a series of results from different valuation models, let’s combine this data to find a target price that takes into account all the assumptions we made:
‘Football field’ target price (Author)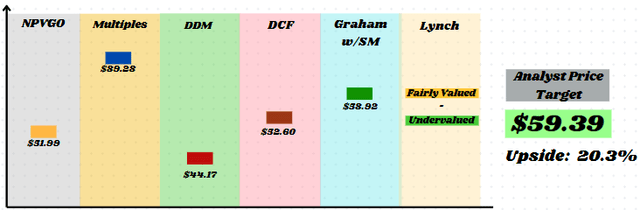
Conclusion
I would like to conclude by saying that although I believe in Jack’s resilience in the current environment, some factors would make me consider lowering my rating for the company. The first of these is performance. Basically, aggressive adaptation strategies require more timely results to be justified. This is even more true when taking into account that QSRs compete directly with convenience stores, which puts them in a more dangerous place in terms of pricing than casual dining, for example.
Another factor that I consider extremely important is the level of debt. I will be monitoring the solvency ratios and as soon as they exceed the standards of highly indebted companies like Wendy’s or Bloomin’, I will give my opinion on the matter. For now I don’t see any great danger, just precaution.


")