


Author’s Note: This is our monthly series on Dividend Stocks, usually published in the first week of every month. We scan the universe of roughly 7,500 stocks listed and traded on U.S. exchanges and use our proprietary filtering criteria to select five relatively safe stocks that may be trading cheaper compared to their historical valuations. Some of the sections in the article, like “Selection Process/Methodology,” are repeated each month with few changes. This is intentional as well as unavoidable, as this is necessary for the new readers to be able to conceptualize the process. Regular readers of this series could skip such sections to avoid repetitiveness.
************
Markets are always unpredictable. However, to be a successful investor, fortunately, we do not need to know exactly where the market is going. We believe it is not possible to catch the exact bottom (or the peak), so it is best to invest regularly and consistently in good, solid dividend-paying stocks when their valuations are attractive. Against this backdrop, keeping some cash reserves and dry powder ready to deal with any scenario is important.
The main goal of this series of articles is to shortlist and highlight companies that have a solid history of paying and raising dividends. In addition, we demand that these companies support strong fundamentals, carry low debt, and are offered at a relatively cheaper valuation. These DGI stocks are not going to make anyone rich overnight, but if your goal is to attain financial freedom by owning stocks that would grow dividends over time, meaningfully and sustainably, then you are at the right place. These lists are not necessarily recommendations to buy but a shortlist of probable candidates for further research. The purpose is to keep our buy list handy and dry powder ready so we can use the opportunity when the time is right. Besides, every month, this analysis is able to highlight a few companies that otherwise would not be on our radar.
Every month, we start with roughly 7,500 stocks that are listed and traded on U.S. exchanges, including over-the-counter (OTC) networks. Using our filtering criteria, the initial list is quickly narrowed to roughly 700 stocks, mostly dividend-paying and dividend-growing. From thereon, by using various data elements, including dividend history, payout ratios, revenue growth, debt ratios, EPS growth, etc., we calculate a “Dividend Quality Score” for each stock that measures the relative safety and sustainability of the dividend. In addition to dividend safety, we also seek cheaper valuations. We also demand that the selected companies have an established business model, solid dividend history, manageable debt, and an investment-grade credit rating.
This month, we highlight three groups with five stocks each that have an average dividend yield (as a group) of 3.61%, 5.30%, and 7.78%, respectively. The first list is for conservative and risk-averse investors, while the second is for investors seeking higher yields but still wanting relatively safe dividends. The third group is for yield-hungry investors but comes with an elevated risk, and we urge investors to exercise caution.
Notes: 1) Please note that when we use the term “safe” in relation to stocks and investments, it should be interpreted as “relatively safe” because nothing is absolutely safe in investing. Even though we present only 5 to 10 stocks in our final list, one should have 15-20 stocks at a minimum in a well-diversified portfolio.
2) All tables in this article are created by the author unless explicitly specified. The stock data have been sourced from various sources such as Seeking Alpha, Yahoo Finance, GuruFocus, Morningstar, and CCC-List (Dividend Radar).
The Selection Process
Note: Regular readers of this series could skip this section to avoid repetitiveness. We include this section (in part) for new readers to provide the necessary background and perspective. Readers can also read a more detailed explanation of the goals and the selection process in our blog post here.
Criteria to Shortlist:
- Market cap > $10 billion ($8 billion in a down market)
- Dividend yield > 1.0% (some exceptions are made to include high quality but lower yielding companies)
- Daily average volume > 100,000
- Dividend growth past five years >= 0.
By applying the above criteria, we got around 600 companies.
Narrowing Down the List
As a first step, we would like to eliminate stocks that have less than five years of dividend growth history. We cross-check our current list of over 600 stocks against the list of so-called Dividend Champions, Contenders, and Challengers originally defined and created by David Fish. Generally, the stocks with more than 25 years of dividend increases are called dividend Champions, while stocks with more than ten but less than 25 years of dividend increases are termed Contenders. Further, stocks with more than five but less than ten years of dividend increases are called Challengers. Also, since we want a lot of flexibility and wider choice at this initial stage, we include some companies that pay dividends lower than 1.40% but otherwise have a stellar dividend record and growing dividends at a fast pace.
After we apply all the above criteria, we’re left with 364 companies on our list. However, so far in this list, we have demanded five or more years of consistent dividend growth. But what if a company had a very stable record of dividend payments but did not increase the dividends from one year to another? At times, some of these companies are foreign-based companies, and due to currency fluctuations, their dividends may appear to have been cut in US dollars, but in reality, that may not be true at all when looked at in the actual currency of reporting. At times, we may provide some exceptions when a company may have cut the dividend in the past, but otherwise, it looks compelling. So, by relaxing some of the conditions, a total of 70 additional companies were considered to be on our list. We call them category ‘B’ companies. After including them, we had a total of 434 (364 + 70) companies that made our first list.
We then imported the various data elements from many sources and assigned weights based on different criteria as listed below:
- Current yield: Indicates the yield based on the current price.
- Dividend growth history (number of years of dividend growth): This provides information on how many years a company has paid and increased dividends on a consistent basis. For stocks under the category ‘B’ (defined above), we consider the total number of consecutive years of dividends paid rather than the number of years of dividend growth.
- Payout ratio: This indicates how comfortably the company can pay the dividend from its earnings. We prefer this ratio to be as low as possible, which would indicate the company’s ability to grow the dividend in the future. This ratio is calculated by dividing the dividend amount per share by the EPS (earnings per share). The cash-flow payout ratio is calculated by dividing the dividend amount paid per share by the cash flow generated per share.
- Past five-year and 10-year dividend growth: Even though it’s the dividend growth rate from the past, this does indicate how fast the company has been able to grow its earnings and dividends in the recent past. The recent past is the best indicator that we have to know what to expect in the next few years.
- EPS growth (average of previous five years of growth and expected next five years’ growth): As the earnings of a company grow, more than likely, dividends will grow accordingly. We will take into account the actual EPS growth of the previous five years and the estimated EPS growth for the next five years. We will add the two numbers and assign weights.
- Chowder number: So, what’s the Chowder number? This number has been named after well-known SA author Chowder, who first coined and popularized this factor. This number is derived by adding the current yield and the past five years’ dividend growth rate. A Chowder number of “12” or more (“8” for utilities) is considered good.
- Debt/equity ratio: This ratio will tell us about the company’s debt load in relation to its equity. We all know that too much debt can lead to major problems, even for well-known companies. The lower this ratio, the better it is. Sometimes, we find this ratio to be negative or unavailable, even for well-known companies. This can happen for a myriad of reasons and is not always a reason for concern. This is why we use this ratio in combination with the debt/asset ratio (covered next).
- Debt/asset ratio: This ratio will tell us about the debt load in relation to the company’s total assets. In almost all cases, this ratio would be lower than the debt/equity ratio. Also, this ratio is important because, for some companies, the debt/equity ratio is not a reliable indicator.
- S&P’s credit rating: This is the credit rating assigned by the rating agency S&P Global and is indicative of the company’s ability to service its debt. This rating can be obtained from the S&P website.
- PEG ratio: This is also called the price/earnings-to-growth ratio. The PEG ratio is considered to be an indicator if the stock is overvalued, undervalued, or fairly priced. A lower PEG may indicate that a stock is undervalued. However, PEG for a company may differ significantly from one reported source to another, depending on which growth estimate is used in the calculation. Some use past growth, while others may use future expected growth.
- Distance from 52-week high: We want to select companies that are good, solid companies but also are trading at cheaper valuations currently. They may be cheaper due to some temporary down cycle or some combination of bad news or simply having a bad quarter. This criterion will help bring such companies (with a cheaper valuation) near the top as long as they excel in other criteria as well. This factor is calculated as (current price – 52-week high) / 52-week high.
- Sales or Revenue growth: This is the average growth rate in annual sales or revenue of the company over the last five years. A company can only grow its earnings power as long as it can grow its revenue. Sure, it can grow the earnings by cutting costs, but that can’t go on forever.
Downloadable Dataset:
Below, we provide a link to the table with relevant data on nearly 400 stocks. Readers can download this table for further analysis. Please note that the table is sorted by “Total Weight” or “Initial Quality Score.”
File-for-export-5_Secure_DGI_-_July_2024.xlsx
Selection Of The Top 50
We will first bring down the list (of about 400) to roughly 50 names by automated criteria, as listed below. In the second step, which is mostly manual and subjective, we will bring the list down to about 15.
- Step 1: First, take the top 20 names from the above table (based on total weight or quality score). At times, some industry segments tend to get overcrowded at the top, so we take the top two (or three) and ignore the rest.
- Step 2: As a second step, we will take the top 10 names based on the highest dividend yield. When it comes to dividend yield, some of the industry segments tend to be overcrowded. So, we will take the top two (or a maximum of three) names from any single industry segment. We take the top 10 stocks after the sort to the final list.
- Step 3: Now, we will sort our list based on five-year dividend growth (highest at the top) and select the top 10 names.
- Step 4: Not all companies have a 10-year streak of dividend growth, but many do. We will sort our list based on 10-year dividend growth (highest at the top) and select the top 10 names.
- Step 5: We also want to give priority to stocks that are rated highest in terms of credit rating. So, we will sort the list based on the numerical weight of the credit rating and select the top 10 stocks with the best credit rating. Again, we are careful not to have too many names from the same sector.
- Step 6: Lastly, as the name of the series suggests, we want to have some names that may be trading cheaper in comparison to their historical valuation. So, we select the top ten names with the highest discount. However, they could be trading cheap for just the wrong reasons, so we need to be careful that they meet our other quality criteria.
From the above steps, we now have a total of 70 names in our final consideration. However, the following stocks appeared more than once:
Stocks that appeared two times: ADP, CI, DHI, GFI, MSFT, TSM, V, VOYA (8 duplicates)
Stock that appeared 3 times: NKE (2 duplicates).
After removing ten duplicates, we are left with 60 (70-10) names.
Since there are multiple names in each industry segment, we will keep a maximum of two or three names (from the top) from any one segment. Also, if the dividend yield was too low (< 0.75%), we would rather remove them at this stage unless the growth potential is extraordinary. After some pruning, we are left with 50 names. The top names from each sector/industry segment are presented:
Financial Services, Banking, and Insurance:
Banks – Regional:
Banks – Major: (JPM), (BNS)
Financial Services – Others: (MS), (VOYA), (ARCC)
Security & Exchanges –
Asset Management/ Inv Bank – (RJF)
Insurance: (OTCQX:ZURVY)
Business Services/ Consulting:
(V), (ADP)
Conglomerates:
(CSL)
Industrials:
(PH), (AGCO), (ALLE)
Transportation/ Logistics:
Chemicals:
(FMC)
Materials/Mining/Gold:
Materials – others: (MOS)
Mining (other than Gold): (RIO)
Gold: (GFI)
Defense:
None
Consumer/Retail/Others:
Cons-Staples: (PEP), (ADM), (PG)
Cons-discretionary: (NKE), (SIRI)
Cons-Retail: (TGT), (DKS)
Tobacco: (BTI)
Communications/Media
(VZ), (BCE)
Healthcare:
Pharma: (JNJ), (BMY), (SNY)
Healthcare Ins: (CI)
Healthcare Services:
Technology:
(MSFT), (TSM), (AVGO), (NXPI)
Energy:
Pipelines/ Midstream: (MPLX), (ENB)
Oil & Gas (prod. & exploration): (EOG), (OVV)
Energy Majors: (CVX)
Utilities:
(NEE), (NRG)
Housing/ Construction:
Home Building: (DHI), (LEN),
Building Material:
Construction & Engg: (PWR)
REIT:
(CCI), (GLPI).
Final Step: Narrowing Down To Just Five Companies
In this step, we construct three separate lists of five stocks each, with different sets of goals, dividend income, and risk levels.
The lists are:
1) Relatively Safe (Low-yield) Dividend list,
2) Moderately High Dividend List,
3) Ultra High Dividend List, and
4) A combined list of the above three (duplicates removed).
Out of the top 50, we make our judgment calls to make these three lists, so basically, the selections are based on our research and perceptions. So, while most of the filtering until now was based on automated criteria, the last step is pretty much subjective. We try to make each of the three lists highly diversified among various sectors and industry segments and try to ensure that the safety of dividends matches the overall risk profile of the group. We certainly encourage readers to do further research on the highlighted names.
Nonetheless, here are our three final lists for this month:
Final A-List (Relatively Safe Income):
Average yield: 3.61%
Table-1A: A-LIST (Conservative Income)
Author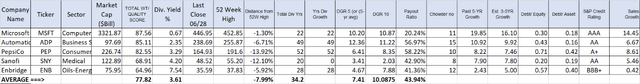
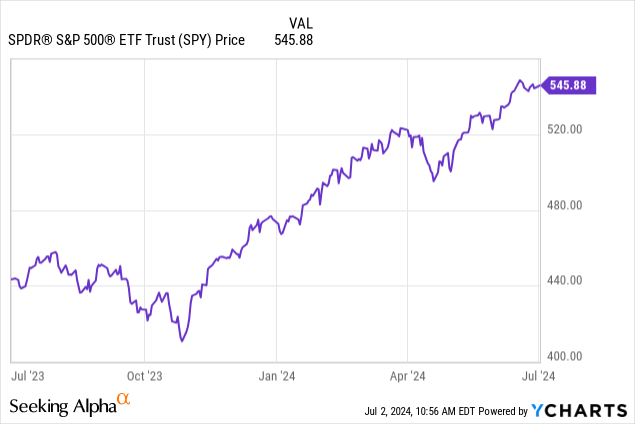
We think this set of five companies (in the A-List) would form a solid, diversified group of dividend companies that would be appealing to income-seeking and conservative investors, including retirees and near-retirees. The average yield is 3.61%, which is nearly 2.75x of what the S&P 500 pays. The average dividend history is nearly 34 years. Also, all five companies have an investment grade credit rating, and four out of five have an excellent rating of AA- or higher. If you must need higher dividends, consider B-List or C-List, presented later.
MSFT (Microsoft):
MSFT is a technology behemoth that needs no introduction. It is part of the so-called ‘Magnificent Seven’ in the S&P500. It has paid and raised dividend payouts for the last 22 years and is only a few years away from being a dividend aristocrat. It has had tremendous growth in its share price since 2014, and there seems to be no let-up in its upward trajectory. Most recently, in 2023, it has led the AI wave from a position of strength, as it owns a major stake in ChatGPT maker OpenAI (thanks to its $10 billion investment in OpenAI). In fact, its AI Services are expected to contribute significantly to its Azure cloud growth in the future. Microsoft is likely to continue leading in the Cloud and AI space. All that said, the stock price is not cheap, and the dividend yield is quite low despite 10% plus growth in payouts for the last ten years. We are including it in the A-List for its growth prospects, stellar credit rating, and stable and growing dividends.
ADP (Automatic Data Processing):
ADP has paid and grown its dividend payout for the last 49 years and is known for the reliability and growth of its dividends at a steady pace. It is only a year away from becoming a Dividend-King. Even though its current yield is mediocre, relatively high growth should compensate in the long run. Currently, the shares are not particularly cheap and are hovering near their 52-week high. We are still including it in the A-list for its exceptional record of growing dividends and growth and excellent credit rating.
PEP (PepsiCo):
PepsiCo is an iconic American company that operates around the globe. It owns well-known household brands, including Pepsi, Mountain Dew, Gatorade, Lay’s, Cheetos, and Doritos, among others. The company is the second-largest beverage company behind Coca-Cola, and beverages account for nearly 45% of its revenues. The rest of the revenue is generated by Snacks and Convenience foods. The company generates nearly 40% of total sales and nearly a third of its profits outside the US.
Besides, last year, PepsiCo became a Dividend-King, meaning it has increased its dividends consistently for the last 50-plus years. For dividend investors, it is quite a milestone. PepsiCo is a must-have in every DGI portfolio; however, it should be added at the right price. In our view, currently, it is trading close to its fair price, though not cheap by any means. It is yielding roughly 3.29% against a 5-year average of 2.75%. Morningstar puts the fair value close to $176 a share, which is nearly 8% above the current price. Also, it is 14% cheaper than its 52-week highs achieved in July 2023.
There are short-term headwinds for the company, which have impacted the market sentiment and drove the share price down from its recent highs in May 2024. The main reason appears to be that the consumer is maxed out due to persistent inflation and high interest rates, from car loans to credit card rates. The consumer is in no position to take any more price increases for consumer and food products. PepsiCo was able to push price increases in 2023 without impacting the volumes, but that changed in 2024. All that said, these things are cyclical and are not going to impact the company in the long term. The share price can still go down from the current levels, so it should be added in multiple lots.
SNY (Sanofi):
Sanofi is one of the largest pharmaceutical companies in the world, based in France. It is also the largest French pharma company. Morningstar puts the fair value at $61 a share, which is nearly 19% above the current price. The company enjoys a strong balance sheet due to a rich pipeline of approved and experimental drugs. The company announced a new strategic policy in 2023, under which it would increase R&D spending and also spin-off or separate the consumer healthcare business unit. Apparently, the market and the dividend-seeking shareholders did not like the idea of increased spending, even though the proposals should benefit the long-term shareholders if the management can bring some faster growth. The company has relatively low debt (roughly $8.5 billion), a strong balance sheet, and a healthy pipeline of current and future drugs, especially in the immunology segment.
The current share price offers a good entry point and a very attractive dividend yield.
ENB (Enbridge):
Enbridge is a midstream energy company based in Canada and serves markets both in Canada and the United States. They operate one of the longest and most complex liquids transportation networks, with over 17,000 miles of pipelines. Enbridge’s natural gas pipelines connect supplies to major North American cities and population centers, as well as LNG export facilities. Another subsidiary of Enbridge, Enbridge Gas, will become one of the largest natural gas utilities in North America (after their September 2023 acquisition of Dominion’s assets close in 2024). So far this year, the company has closed on two of three utility purchases/ acquisitions from Dominion Energy, while the third should be completed before the end of 2024. However, the results from these acquisitions have yet to show up in the profitability of the company. ENB’s focus on utility-like businesses will likely de-risk ENB’s profile. The current debt to EBITDA ratio stands at 4.7x, which is right in the middle of ENB’s target of maintaining the debt to EBITDA in the range between 4.5x and 5x.
The company has paid and grown the dividend at a very respectable pace for 28 years (in Canadian dollars). The dividend payout is fully covered by the DCF (distributable cash flow). In fact, the ratio of dividends to DCF (distributable cash flow) is below 60%, thus quite conservative. Moreover, the current dividend yield, roughly 7.5%, is very attractive. All this bodes well for the investors in terms of the company’s ability to continue growing its dividend for the foreseeable future, albeit at a slower pace.
Final B-List (High Yield, Moderately Safe):
Average yield: 5.30%
- (MSFT)
- (PEP)
- (BMY)
- (ARCC)
- (ENB)
Note 1: Very often, we include a few low-risk stocks in the B-list and C-list. Also, oftentimes, a stock can appear in multiple lists. This is done on purpose. We try to make each of our lists fairly diversified among different sectors/industry segments of the economy. We try to include a few of the highly conservative names in the high-yield list to make the overall group much safer.
Table-1B: B-LIST (High Yield)
Author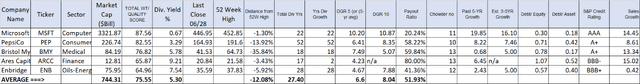
In the B-List, the overall risk profile of the group becomes slightly elevated compared to the A-List. That said, the group (as a whole) will likely provide safe dividends for many years. This list offers an average yield for the group of nearly 5.30%, an average of 27 years of dividend history, and an average discount of -12% (from 52-week highs).
BMY (Bristol Myers Squibb Co):
Bristol’s share price has lost nearly 50% since its peak in Dec. 2022, and currently, it appears to be undervalued. It also offers a very nice dividend yield of 5.75% at current prices. Only Pfizer is another major pharma company that offers a higher dividend yield at this time, but it also comes with higher risks. The company is facing several headwinds that include patent expirations, generic threats, decreasing pricing power owing to managed-care constraints, and product liability cases. The Celgene acquisition in 2019 added a large amount of debt to the company’s balance sheet, which continues to be a financial risk. That said, the company has reduced its long-term debt by nearly 1/3rd from $48 billion in 2020 to $32 Billion in 2023.
BMY is quite adept at making partnerships, deals, and acquisitions. In the process, Bristol has created a strong pipeline and has partnered with other companies to lower the development costs of the new drugs as well as diversify the risks of regulatory failure. They also have a cardiovascular partnership with Pfizer, managing the blockbuster potential of the Eliquis drug. Another recent deal is a licensing deal with SystImmune to bolster BMY’s oncology pipeline, which could turn out to be worth multi-billion dollars. BMY increased its quarterly dividend payout early this year from $0.57 a share to $0.60 (a 5.26% increase). In balance, BMY is an attractive buy at the current price and, to some extent, a contrarian turn-around candidate.
ARCC (Ares Capital):
Ares Capital is one of the largest BDCs (Business Development Companies) in terms of market capitalization and net asset values. ARCC offers a very high yield of roughly 9.2%. Being a BDC, it invests in small and medium-sized companies, some of which may be distressed. ARCC has investments in nearly 500 companies, making it a very diversified portfolio. It has a record of generating a high NII (net Investment income), which currently exceeds $1 billion on an annual basis. Based on core-EPS, its payout ratio is under 81% for the last 12 months, which is respectable for a BDC. Based on the Net Investment Income, it comes out to be 85.7%. The dividend coverage stands at 1.15%. The market for BDCs is getting competitive, and the uncertainty about the interest rates makes their business more challenging, but ARCC is well-positioned to continue performing well.
With over 9% dividend yield, there is not much scope left for capital appreciation, but we must remember that this is an investment for income. That said, if someone reinvests all the dividends, the total returns may still be attractive.
Final C-LIST (Yield-Hungry, Less Safe):
Average yield: 7.78%
Notes:
Note 1: Oftentimes, a stock can appear in multiple lists. We try to include one or two conservative names in the high-yield list to make the overall group much safer.
Table-1C: C-LIST (Yield-Hungry, Elevated Risk)
Author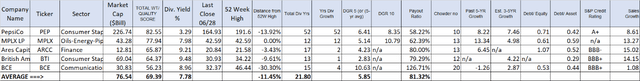
NOTE: MPLX is structured as a partnership (not a corporation) and issues a K-1 tax form instead of the usual 1099-Div. Please use due diligence.
BTI (British American Tobacco)
Some investors may not like Tobacco stocks, and that is understandable. But if you are fine with investing in Tobacco stocks, it probably can’t get better than this. The current yield is quite high at 9.5%. The company has excelled in growing the new categories of products. However, this is purely an income investment, and we should not expect any significant growth. That said, for income investors, the dividend appears to be reasonably safe. The share price has recovered somewhat from the lows earlier this year. It may be much safer to buy this stock in multiple lots using the dollar-cost-averaging. You may like to read our previous article here, which covered BTI in more detail.
BCE (BCE Inc):
BCE is the largest communications company in Canada. In many ways, its positives and challenges are similar to those of Verizon (VZ) in the US; however, currently, it is providing a much higher dividend yield than Verizon. BCE is currently paying a very attractive dividend yield of 8.75%. It has paid and raised the dividend payouts consecutively for 15 years (in Canadian dollar terms). It offers a wide range of telecommunications products and services, including wireless, wireline, Broadband, and TV services, to approximately 22 million subscribers in Canada. However, there are some risks that investors should be aware of. It operates in a very competitive environment, and just like other telecom companies in the industry, it carries a large debt burden of nearly $25 billion. We should not expect much growth in the share price, but with over 9% dividend, even a marginal capital appreciation would make it a reasonably good investment.
MPLX (MPLX LP):
We included ENB from the energy sector in the A-List and B-List. However, to enhance the yield slightly, we are replacing ENB with MPLX in the C-List. First of all, it is a Partnership and issues a K-1 tax form (partnership income) instead of the usual 1099 in case of regular dividends.
MPLX is a diversified midstream energy company structured as a master limited partnership. It was formed in 2012 by Marathon Petroleum Corporation (MPC) for the purpose of owning, operating, acquiring, and developing midstream energy infrastructure assets. To date, MPC remains the largest unitholder of MPLX.
MPLX maintains a solid balance sheet with investor-grade BBB credit rating and pays a very attractive yield, currently at 8%. It has paid and raised the dividend payout since its inception in 2012 and most recently raised the payout by 9.65% in Nov. 2023. Its dividend is well covered, and dividend coverage stands at 1.6x. Even though, in the last five years, the price appreciation has been significant, we expect limited price appreciation going forward. However, we can expect a very stable and near 8% dividend payout for the foreseeable future.
===
Apparently, this list (C-List) is for yield-hungry DGI investors. The yield goes up as much as 7.78%. However, this list is not for conservative investors. As you can see, the average credit rating of this set of companies is much lower than the A-List or even B-List. Dividends are moderately safe in this list, but the yields are very attractive. At least a couple of companies in this list come with an elevated level of risk. We urge due diligence to determine if it would suit your personal situation. Nothing comes for free, so there will be more risk involved with this group. That said, it’s a highly diversified group spread among five different industry segments.
We would like to caution that each company comes with certain risks and concerns. Sometimes, these risks are real, but other times, they may be a bit overblown and temporary. So, it’s always recommended to do further research and due diligence.
What If We Were to Combine the Three Lists?
If we combine the three lists and remove the duplicates (because of combining), we would be left with eleven names.
Two-time duplicates: ARCC, ENB, MSFT (3 duplicates).
Three-time duplicates: PEP (2 duplicates).
After removing these five duplicates, we are left with 10 names.
From the energy sector, we have two similar names (ENB and MPLX). We keep ENB and remove MPLX (since MPLX is a partnership).
We also have two stocks from Healthcare; we keep SNY and remove BMY.
The combined list is highly diversified in as many as eight industry segments. The stats for the group of 8 are as follows:
Average yield: 5.71%
Average discount (from 52WK High): -10.4%
Average 5-yr dividend growth: 6.84%
Average 10-yr dividend growth: 8.08% (from five names)
Average Payout Ratio: 63.69%
Average Total Quality Score: 71.88
Table 2:
Author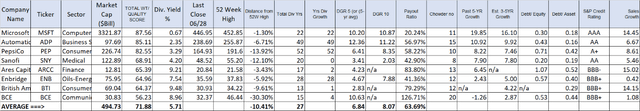
Conclusion
In the first week of every month, we start with a fairly large list of dividend-paying stocks and filter our way down to just a handful of stocks that meet our selection criteria and income goals. In this article, we have presented three groups of stocks (five each) with different goals in mind to suit the varying needs of a wider audience. Even though the risk profile of each group is different, each group in itself is fairly balanced and diversified.
This month, the first group yields 3.61%, while the second group elevates the yield to 5.30%. We also presented a C-list for yield-hungry investors with a 7.78% yield. The combined group (all three lists combined with duplication removed) offers an even more diversified group with eight positions and a 5.71% yield.
")


")

