")


Dear Fellow Investor,
Upslope’s objective is to deliver attractive, equity-like returns with significantly reduced market risk and low correlation versus traditional equity strategies. Despite an incredibly challenging quarter from a factor1 perspective, Q3 was another strong period for the Fund. Details are below.
|
Upslope Exposure & Returns2 |
Upslope Exposure & Returns2 |
Benchmark Returns |
Benchmark Returns |
|
|
Average Net Long3 |
Net Return |
S&P Midcap 400 ETF (MDY) |
HFRX Equity Hedge Index |
|
|
Q3 2025 |
46% |
+8.8% |
+5.5% |
+3.8% |
|
YTD 2025 |
42% |
+12.5% |
+5.5% |
+8.3% |
|
Last 12 Months |
41% |
+4.3% |
+5.9% |
+8.6% |
|
Since Inception |
35% |
+10.7% |
+9.8% |
+5.3% |
|
Downside Deviation |
5.5% |
12.8% |
4.6% |
|
|
Sortino Ratio4 |
1.57 |
0.61 |
0.71 |
Note: LPs/clients should always check individual statements for returns, which may vary due to timing, fee schedules and other factors. Since inception returns, downside standard deviation, and Sortino are all annualized figures.
Market Conditions – White Flags
The macro environment is unusually volatile and uncertain. Elevated risk has been masked by strong recent returns in equity markets. But it is not hard to gauge where markets sit today on the pendulum:
- Valuations are very extended; everyone knows this, many defend it
- The AI investment boom has become very circular; everyone knows this, few defend it
- Profiting from longs has become so easy that throwing darts is more effective than sober analysis
- Short-selling – especially of fraudy, speculative stocks – has become nearly impossible
Given the above, the outlook for equity markets appears asymmetrically negative over the medium term. Upslope’s portfolio today contains a larger than usual amount of exposure to defensive, quality longs and high-beta shorts. Net long exposure is modest and downside protection is significant.
*****
From a performance perspective, Q3 was a weird one. There were three roughly equal sources of returns on the long side: (1) AI hedges, (2) Intermex take-out, and (3) core defensive-leaning longs. I will discuss the first two in more detail below in the Portfolio Updates section. The third, I anticipate, will be the biggest driver of returns going forward. Underlying fundamentals for this group (defensive longs) remain solid and valuations are reasonable. Should markets sober up, boring stocks like these should handily outperform.
1Everything went wrong in terms of traditional tailwinds for Upslope’s style: high beta “junk” outperformed, Europe lagged, and
somehow midcaps underperformed both large and small caps.
2See important performance-related details and disclosures in Appendix A.
3Beta-/delta-adjusted.
4Calculated as: (Net return since inception – 2.0% risk-free rate) / downside deviation.
Portfolio Positioning
At quarter-end, gross and beta-adjusted net exposures were 151% and 31%, respectively. Positioning reflects a high number of perceived opportunities on both (long + short) sides of the portfolio.
Exhibit 1: Portfolio Snapshot
|
NAME |
TICKER |
INDUSTRY |
HQ |
MCAP ($B) |
|
Core Longs (26% of Total Gross Exposure) |
||||
|
CME Group (CME) |
CME |
Investment Banks/Brokers |
United States |
$97.4 |
|
Hershey Company (HSY) |
HSY |
Food: Specialty/Candy |
United States |
37.9 |
|
Teledyne Technologies (TDY) |
TDY |
Aerospace & Defense |
United States |
27.5 |
|
STERIS (STE) |
STE |
Medical Specialties |
United States |
24.4 |
|
Japan Exchange Group (OTCPK:JPXGY) |
8697-JP |
Investment Banks/Brokers |
Japan |
11.5 |
|
Diploma (OTCPK:DPMAY) |
DPLM-LON |
Wholesale Distributors |
United Kingdom |
9.6 |
|
Tactical Longs (36%) |
||||
|
Holcim (OTCPK:HCMLF) |
HOLN-SWX |
Construction Materials |
Switzerland |
$45.6 |
|
Sandvik (OTCPK:SDVKY) |
SAND-SE |
Trucks/Construction/Farm Machinery |
Sweden |
34.9 |
|
West Pharmaceutical Services (WST) |
WST |
Medical Specialties |
United States |
18.9 |
|
Korea Defense Industry ETF (KDEF) |
KDEF |
Investment Trusts/Mutual Funds |
United States |
13.8 |
|
Smiths Group (OTCPK:SMGZY) |
SMIN-LON |
Electrical Products |
United Kingdom |
10.3 |
|
Bio-Rad Laboratories (BIO) |
BIO |
Medical Specialties |
United States |
7.6 |
|
MarketAxess Holdings (MKTX) |
MKTX |
Investment Banks/Brokers |
United States |
6.5 |
|
FTI Consulting (FCN) |
FCN |
Miscellaneous Commercial Services |
United States |
5.2 |
|
Chemring Group (OTCPK:CMGMF) |
CHG-LON |
Aerospace & Defense |
United Kingdom |
2.1 |
|
Starter Longs (12%) |
||||
|
Alphabet (GOOGL) |
GOOGL |
Internet Software/Services |
United States |
$2,940.1 |
|
Intel Corp. (INTC) |
INTC |
Semiconductors |
United States |
156.7 |
|
International Money Express (IMXI) |
IMXI |
Miscellaneous Commercial Services |
United States |
0.4 |
|
— |
— |
Engineering & Construction |
United States |
— |
|
— |
— |
Financial Conglomerates |
United States |
— |
|
— |
— |
Industrial Machinery |
Japan |
— |
Shorts & Hedges (26%)
Note: as of 9/30/25 and may change without notice. Positions disclosed/categorized at Upslope’s discretion. Tickers shown for underlying businesses; actual securities/instruments held may differ. Source: Upslope, FactSet
Exhibit 2: Gross Exposure by Market Cap & Geography (Total Portfolio)
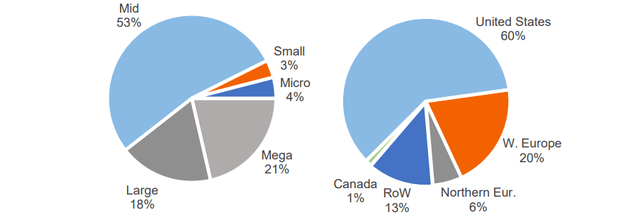
Note: as of 9/30/25. Market cap ranges: Micro (<$500mm), Small ($500mm – $2bn), Mid ($2bn – $25bn), Large ($25bn – $50bn), Mega (>$50bn). Source: Upslope, Interactive Brokers, FactSet
Portfolio Updates
The largest contributors to and detractors from quarterly performance are noted below. Gross contribution to overall portfolio return is noted in parentheses.
Exhibit 3: Top Contributors to Quarterly Performance (Gross)
|
Top Contributors |
Top Detractors |
|
Long: Intermex (+535 bps) |
Long: MarketAxess (-195 bps) |
|
Long: Alphabet (+290 bps) |
Short: Index Hedge (-130 bps) |
|
Long: Intel (+265 bps) |
Short: Technology Co (-120 bps) |
|
Longs – Total Contribution |
Shorts – Total Contribution |
|
+1,750 bps |
-665 bps |
Source: Upslope, Opus Fund Services, Interactive Brokers
Note: Amounts may not tie with aggregate performance figures due to rounding.
Performance Contribution Notes
AI hedges (GOOG),(INTC) – earlier in the year I implemented hedges to protect the short book from an acceleration of the “AI bubble.” These included LEAPS (long-term call options) on two big tech stocks that I perceived to be (a) likely beneficiaries of an AI bubble, and (b) relatively out of favor: Alphabet (Google) and Intel. They were highly effective and offset most of the Fund’s losses from shorts. Today, the positions are effectively reduced and “Starter”-sized. While I won’t hesitate to be creative in mitigating portfolio risks, I am not about to become a big tech-focused investor.
Intermex (IMXI) is a remittance payment provider. Upslope had been tracking IMXI for several quarters with a small Starter position. Historically, the company had an attractive financial profile. Recently, shares came under pressure due to immigration policy uncertainty. In late July, I observed the company was clearly late announcing its Q2 earnings date. In my view, this can signal one of two things: a sale of the company or…fraud. Given IMXI’s recent history (share price collapse and pressure to engage in strategic discussions) I suspected the former. Given the business model (EM payments), however, I did not rule out the latter. This led me to purchase call options for the Fund – betting on a take-out in the very short-term, while limiting downside. On Aug 10, Western Union announced it was acquiring Intermex for a 60% premium. Most of the position was sold shortly thereafter.
Key Long(s) Exited
The Fund exited its Evercore ((EVR), leading independent M&A advisor) holding during the quarter, due to full valuation and better opportunities for capital. Since inception of Upslope’s long/short strategy in 2016, Evercore (which Upslope has owned multiple times) has been the largest individual contributor to performance.
Healthcare (STERIS, West Pharma, Bio-Rad) – New Longs
The Fund currently holds several healthcare stocks, generally sized smaller than typical longs (historically 7-12%). I may add or change positions in the future and ultimately expect to pare down Upslope’s healthcare holdings to one or two more concentrated bets. The point of structuring the healthcare “position” this way was three-fold:
- Extraordinary opportunities seem to exist in the sector today. Despite many of the stocks being quality, defensive beneficiaries of normalizing rates, the sector is very out of favor (25-year low S&P 500 weight, bottom decile or two multiples, heavy outflows), and valuations and fundamentals are both depressed.
- Given how challenging performance has been for stocks in the group, it’s been more difficult than usual to sit tight with concentrated positions. Added diversification enables larger aggregate exposure to the sector and makes enduring short-term drawdowns of individual positions easier to stomach.
- While much remains to be proven, many healthcare businesses could ultimately be large beneficiaries of advancements in AI. Such an acceleration does not appear to be baked into valuations or estimates.
A brief overview of healthcare positions currently owned by Upslope is provided below:
- Bio-Rad Laboratories (BIO)– global producer of clinical diagnostic and life sciences products. The company is the market leader in a majority of its products and largely sells to hospital and other labs, as well as academic, government, and biopharma customers. ~70% of sales are recurring/consumable in nature. Importantly (and somewhat strangely…and impressively), the company owns more than 35% of Germany-based and -listed Sartorius (SRT-DE). As a global leader in bioprocessing, Sartorius provides many of the vital tools, consumables and equipment used by drug-makers to develop and manufacture biologic medicines. Tax-affected, BIO’s SRT stake represents almost 50% of BIO’s enterprise value today and implies a well-below market and peer valuation for BIO’s core operating business. Like most healthcare stocks, both BIO and SRT have seen sharp valuation de-ratings in recent years, as they’ve worked through their own COVID era hangovers (fundamentally and especially valuation-wise). BIO’s underlying valuation (9x 2026 EBITDA accounting for the SRT stake) seems particularly attractive today – especially considering the prospect of troughing fundamentals.
- STERIS (STE)– leader in infection prevention, sterilization, and procedural solutions for healthcare providers, hospitals, pharmaceutical & bioprocess customers, and medical-device makers. Despite an overall economically defensive model with ~75% of sales from service and consumables, Steris has historically delivered high single-digit % organic growth and been active in M&A. Valuation is reasonable at 22x 2026 EPS (in line with medium-term history) and the balance sheet is strong at 1x net leverage (low end of historical range and an opportunity for capital deployment). Long-term secular tailwinds from an aging global population and continued innovation in healthcare procedures and devices/technology should be continued drivers of growth going forward.
- West Pharmaceutical Services (WST)– leading producer of packaging and components for injectable drug delivery devices (e.g. seals, elastomer stoppers, syringe components). Close readers of Upslope’s letters over the years will recognize the West name as the larger, more dominant competitor of Aptar’s (former long) Pharma segment. In addition to tailwinds from growing GLP-1 usage (rapidly growing, but a small minority of sales), West should benefit from continued advancements in drug development and a push to reshore drug manufacturing. While WST has historically (and still does) traded at a premium, shares de-rated to a more reasonable valuation in recent years (~23x 2026 EBITDA). Although not “cheap,” valuation seems reasonable enough given WST’s solid, consistent growth, deep regulatory- driven competitive advantages, and the prospect of accelerated growth in the years ahead.
In addition to company-specific risks, healthcare stocks are also exposed to risks related to the rapidly evolving/uncertain regulatory and government funding environments. While uncertainty remains, Upslope’s view is that valuation and investor positioning have more than accounted for this uncertainty today.
Korea Defense Industry ETF – New Long
Upslope first initiated a position in the PLUS Korea Defense Industry ETF (KDEF) at the end of Q2 and made it a full position in Q3. While Upslope typically avoids exchange traded funds for longs, KDEF seems an optimal vehicle in this situation due to Korea’s unique (i.e. opaque for outsiders) market structure and the targeted, specialized nature of the index.
KDEF provides concentrated exposure to Korea’s leading defense and shipbuilding contractors. Its three largest holdings are: (1) Hanwha Aerospace (17% of KDEF), the country’s flagship defense prime, spanning missiles, aircraft engines, and space systems, (2) Hyundai Rotem (13%), a dominant player in armored vehicles and rail systems, and (3) HJ Shipbuilding & Construction (9%), a leading naval (e.g. frigates and subs) and commercial shipbuilder. ~15% of KDEF is tied to shipbuilding. Key thesis points include:
- Elevated and rising geopolitical tensions globally and in Asia-Pacific should drive sustained defense investment for years.
- Korean defense industry maintains significant relative cost advantages vs. US and European peers – cheaper/faster and compatible with NATO standards. Given recent trade and policy uncertainty, the industry has the potential to capture additional global share as NATO allies become responsible for funding an increasing burden of defense spend.
- Korean government has recently begun pursuing pro-shareholder/-market reforms, aimed largely at improving corporate governance and increasing equity ownership.
- Sector valuations remain reasonable on an absolute and relative (vs. global and EU defense) basis – particularly given Upslope’s view on the duration of the current cycle.
Key risks: US-China détente could undercut defense spend urgency, FX, valuation (reasonable vs. global peers, but re-rated vs. history), and general political/policy uncertainty.
Closing Thoughts
Upslope is positioned to benefit from an eventual snapback in relative performance of durable, high-quality businesses. When such a rebound will occur is anyone’s guess. But underneath the surface markets are about as stretched in favor of questionable, speculative (being polite) businesses as anytime I’ve seen in my 20+ year career. This is an exciting time.
Thank you for the trust you’ve placed in me and Upslope to manage a portion of your hard-earned money. Please contact me if you have any questions at all, would like to add to your investment, or know a qualified investor who may be a good fit for Upslope’s unique approach.
Sincerely,
George K. Livadas
1-720-465-7033
Appendix A: Upslope Capital Long/Short Strategy Performance (Net)
| Jan | Feb | Mar | Apr | May | Jun | Jul | Aug | Sep | Oct | Nov | Dec | YTD | ||
|---|---|---|---|---|---|---|---|---|---|---|---|---|---|---|
| 2025 | Upslope | (2.2%) | 2.9% | (5.6%) | 6.8% | 0.3% | 1.7% | (0.3%) | 5.0% | 4.0% | — | — | — | 12.5% |
| 2025 | S&P Midcap 400 | 3.7% | (4.2%) | (5.5%) | (2.4%) | 5.4% | 3.6% | 1.6% | 3.4% | 0.4% | — | — | — | 5.5% |
| 2024 | Upslope | 0.1% | 2.3% | 3.0% | 0.9% | 1.5% | (4.8%) | 7.1% | (0.8%) | (2.0%) | 0.3% | (5.8%) | 9.4% | |
| 2024 | S&P Midcap 400 | (1.7%) | 5.9% | 5.6% | (6.0%) | 4.5% | (1.7%) | 5.8% | (0.1%) | 1.1% | (0.7%) | 8.9% | (7.2%) | 13.6% |
| 2023 | Upslope | (2.6%) | 1.6% | (0.3%) | 2.2% | (3.5%) | 0.1% | (0.6%) | (0.2%) | 0.3% | 2.4% | 6.6% | 6.1% | 12.4% |
| 2023 | S&P Midcap 400 | 9.3% | (1.9%) | (3.2%) | (0.8%) | (3.2%) | 9.2% | 4.1% | (3.0%) | (5.3%) | (5.3%) | 8.4% | 8.6% | 16.1% |
| 2022 | Upslope | (2.3%) | 0.8% | 1.3% | 3.1% | (1.5%) | (0.8%) | 1.5% | (4.0%) | (2.3%) | 3.0% | 5.7% | 2.1% | 6.5% |
| 2022 | S&P Midcap 400 | (7.3%) | 1.1% | 1.3% | (7.1%) | 0.8% | (9.6%) | 10.9% | (3.2%) | (9.2%) | 10.5% | 6.0% | (5.5%) | (13.3%) |
| 2021 | Upslope | (5.1%) | 0.3% | 3.2% | 2.4% | 0.4% | (0.0%) | 2.4% | 1.6% | (4.0%) | 3.9% | (3.2%) | 2.9% | 4.2% |
| 2021 | S&P Midcap 400 | 1.4% | 6.8% | 4.9% | 4.3% | 0.2% | (1.1%) | 0.3% | 2.0% | (4.0%) | 5.9% | (3.0%) | 5.2% | 24.6% |
| 2020 | Upslope | 0.0% | (2.3%) | 0.4% | 4.9% | (0.7%) | (2.9%) | 1.9% | 4.6% | 0.8% | 3.2% | 3.6% | 0.9% | 15.1% |
| 2020 | S&P Midcap 400 | (2.6%) | (9.4%) | (20.2%) | 14.1% | 7.2% | 1.3% | 4.7% | 3.5% | (3.3%) | 2.2% | 14.3% | 6.5% | 13.5% |
| 2019 | Upslope | 3.8% | 1.0% | 2.4% | 2.6% | 3.0% | 2.1% | 0.7% | 7.2% | (2.1%) | 0.7% | (0.2%) | (3.4%) | 18.9% |
| 2019 | S&P Midcap 400 | 10.3% | 4.3% | (0.6%) | 4.0% | (8.1%) | 7.8% | 0.9% | (4.1%) | 3.1% | 1.1% | 2.9% | 2.8% | 25.8% |
| 2018 | Upslope | (1.3%) | 1.6% | 5.5% | 0.4% | 2.0% | (1.1%) | (0.0%) | 1.2% | (0.4%) | 1.0% | (1.1%) | (2.9%) | 4.6% |
| 2018 | S&P Midcap 400 | 2.8% | (4.4%) | 1.0% | (0.4%) | 4.1% | 0.4% | 1.7% | 3.2% | (1.1%) | (9.6%) | 3.2% | (11.3%) | (11.3%) |
| 2017 | Upslope | 7.5% | (1.9%) | 0.7% | 4.0% | 2.6% | (0.4%) | 2.3% | 0.1% | 1.7% | (0.8%) | (0.7%) | 0.5% | 16.2% |
| 2017 | S&P Midcap 400 | 1.6% | 2.6% | (0.5%) | 0.8% | (0.5%) | 1.5% | 0.9% | (1.5%) | 3.9% | 2.2% | 3.7% | 0.2% | 15.9% |
| 2016 | Upslope | — | — | — | — | — | — | — | 0.0% | (0.8%) | (1.6%) | 2.7% | (1.8%) | (1.6%) |
| 2016 | S&P Midcap 400 | — | — | — | — | — | — | (0.4%) | (0.6%) | (2.7%) | 7.9% | 2.2% | 6.2% |
| Annualized Return | Total Return | Downside Dev. | Sortino Ratio | Corr.vs Upslope | ||
|---|---|---|---|---|---|---|
| Since Inception | Upslope | 10.7% | 151.2% | 5.5% | 1.57 | — |
| Since Inception | S&P Midcap 400 | 9.8% | 134.6% | 12.8% | 0.61 | 0.32 |
| Since Inception | HFRX Equity Hedge Index | 5.3% | 59.6% | 4.6% | 0.71 | 0.25 |
Source: Upslope, Interactive Brokers, Opus Fund Services, LICCAR, FactSet, Sentieo, Morningstar. Notes and disclosures: Returns from inception to May 2023 shown for composite of all separate accounts invested according to Upslope’s core long/short strategy. Returns from June 2023 onward shown for Class A interest in Upslope Partners Fund, LP. Performance for a composite of all accounts managed by Upslope from inception is available upon request. Performance for S&P Midcap 400 represented by total return for related exchange-traded fund (ticker: MDY). Individual investment performance may vary. Investors should always review statements for actual results. Data from inception (August 29, 2016) to June 24, 2017 based on portfolio manager’s (“PM”) performance managing the strategy under a prior firm (as sole PM). Thereafter, PM managed the strategy/accounts on a no-fee basis through August 11, 2017, after which Upslope became operational. PAST PERFORMANCE IS NO GUARANTEE OF FUTURE RESULTS.
Appendix B: Portfolio Company (Long) Descriptions
Bio-Rad Laboratories (BIO): Global producer of clinical diagnostic and life sciences products, serving hospital and other labs, as well as academic, government, and biopharma customers. Also owns 35%+ of Sartorius (SRT-DE), a global leader in bioprocessing tools, equipment, and consumables.
Chemring (CHG-LON): Niche, UK-based defense contractor focused on defensive flares, specialty explosives and cyber warfare. Setup for shares includes undemanding valuation, accelerating sector tailwinds, clean balance sheet, strategic assets, and an active buyback.
CME Group (CME): Leading operator of global derivatives exchanges; focused on rates, commodities, equities and FX. Attractive, durable business that should continue to benefit from global macro volatility. Competitive threat from upstart exchange continues to dissipate.
Diploma (DPLM-LON): U.K.-based specialty distributor focused on essential consumable products across life sciences, seals (machinery), and controls (aerospace wiring/harnesses). Unique model and conservative M&A strategy have historically enabled attractive free cash flow growth through the cycle.
FTI Consulting (FCN): Boutique consulting and advisory firm, with deep experience in restructuring, dispute/conflict advisory, and other practices. Challenges in a non-core segment have depressed expectations for shares despite an environment that should ultimately lead to strong and rising demand.
Hershey Foods (HSY): Dominant North American chocolate and salty snack business facing “headline” pressures due to recent surge in cocoa prices and GLP-1 worries. Likely overblown fears have allowed for a seemingly attractive entry price in advance of potential share gains and harvesting of recently elevated investment spend.
Holcim (HOLN-SWX): Switzerland-based, global cement, aggregates and building materials company. Anticipate executed spin-off of U.S. operations should continue to unlock shareholder value and that European operations should perform well as war in Ukraine eventually winds down.
Japan Exchange Group (8697-JP): Largest exchange operator in Japan with exposure to equities, derivatives, and information services. Key driver and beneficiary of ongoing efforts to reform Japanese equity market structure and corporate governance standards – as well as ongoing global market volatility.
MarketAxess (MKTX): Challenged member of fixed income/credit “exchange” duopoly. Given macro/geopolitical backdrop and depressed valuation, company appears likely to stabilize market share (or better) in the near-term and/or be acquired by a large exchange in the medium-term.
Korea Defense Industry ETF (KDEF): Concentrated ETF with exposure to South Korea’s leading defense and shipbuilding contractors. Beneficiary of elevated/rising geopolitical tensions significant cost advantages vs. US/Eur peers, heightened policy uncertainty, and government-backed pro-shareholder/-market reforms.
Sandvik (SAND-SE): Sweden-based provider of mining, metal-cutting, and other industrial equipment and tools. Dominant share in mining equipment and outsized exposure to gold miners, combined with modest valuation and elevated gold prices make for an attractive outlook.
Smiths Group (SMIN-LON): Historically sleepy UK-based industrial conglomerate focused on specialty industrial niches and security/detection. Recent activist pressure has led management to commit to transforming the business by shedding non-core units and focusing on the strongest legacy segments.
STERIS (STE): Leader in infection prevention, sterilization, and procedural solutions for healthcare providers, hospitals, pharmaceutical & bioprocess customers, and medical-device makers. Strong historic organic growth, despite majority of sales from service/consumables.
Teledyne Tech. (TDY): Producer of specialty electronics, components, and technologies – primarily focused on imaging sensors and cameras. Dinged by transformative 2021 FLIR acquisition, expectations and valuation have been reset, balance sheet is clean, and the company is positively exposed to reshoring trends and rising defense spending.
West Pharmaceutical Services (WST): Leading producer of packaging/components for injectable drug delivery devices with deep regulatory and technology-supported moat. In addition to GLP-1 tailwinds, should benefit long-term from advancements in drug development and broader reshoring efforts.
Appendix C: Terminology
Core Longs: Higher “quality” businesses (defined as low cyclicality, clean balance sheet, obvious and durable competitive advantages) managed with less valuation sensitivity (i.e. typically won’t exit a Core long solely because of valuation) and assuming a multi-year time horizon.
Tactical Longs: Traditional “value” investments of more modest quality (reasonably or very cyclical, currently experiencing operational, competitive or financial challenges) managed with greater valuation sensitivity (i.e. typically begin to exit if shares approach full valuation) and assuming a shorter time horizon (typically 6-18 months).
Starter Longs: Generally smaller, undisclosed longs that fall into at least one of the following groups:
- Ideas where I’ve completed enough work to establish a toehold, but still have more to do.
- Companies facing obvious short-term challenges where I believe the near-term path in shares is likely lower, but the stock is ‘cheap enough’ and outright attractive over the longer-term.
- ‘Counter-shorts’ – higher-beta longs with good risk/reward that trade more in-sync with Upslope’s shorts on a daily basis and can be used to manage overall net long exposure more effectively and tax-efficiently.
Alpha Shorts: Individual company short positions.
Hedges: Diversified index hedges (either long or short).
|
Important Disclosures General Upslope Capital Management, LLC (“Upslope”) is a Colorado registered investment adviser. Information presented is for discussion and educational purposes only. This presentation is not an offer to sell securities of any investment fund or a solicitation of offers to buy any such securities. Securities of the fund managed by Upslope are offered to selected investors only by means of a complete offering memorandum and related subscription materials which contain significant additional information about the terms of an investment in the fund (such documents, the “Offering Documents”). Any decision to invest must be based solely upon the information set forth in the Offering Documents, regardless of any information investors may have been otherwise furnished, including this presentation. Investments involve risk and, unless otherwise stated, are not guaranteed. The information in this presentation was prepared by Upslope and is believed by Upslope to be reliable and has been obtained from public sources believed to be reliable. Upslope makes no representation as to the accuracy or completeness of such information. Opinions, estimates and projections in this presentation constitute the current judgment of Upslope and are subject to change without notice. Any projections, forecasts and estimates contained in this presentation are necessarily speculative in nature and are based upon certain assumptions. It can be expected that some or all of such assumptions will not materialize or will vary significantly from actual results. Accordingly, any projections are only estimates and actual results will differ and may vary substantially from the projections or estimates shown. This presentation is not intended as a recommendation to purchase or sell any commodity or security. Upslope has no obligation to update, modify or amend this presentation or to otherwise notify a reader thereof in the event that any matter stated herein, or any opinion, project on, forecast or estimate set forth herein, changes or subsequently becomes inaccurate. The graphs, charts and other visual aids are provided for informational purposes only. None of these graphs, charts or visual aids can and of themselves be used to make investment decisions. No representation is made that these will assist any person in making investment decisions and no graph, chart or other visual aid can capture all factors and variables required in making such decisions. This presentation is strictly confidential and may not be reproduced or redistributed in whole or in part nor may its contents be disclosed to any other person without the express consent of Upslope. Investment Strategy The description herein of the approach of Upslope and the targeted characteristics of its strategies and investments is based on current expectations and should not be considered definitive or a guarantee that the approaches, strategies, and investment portfolio will, in fact, possess these characteristics. In addition, the description herein of the fund’s risk management strategies is based on current expectations and should not be considered definitive or a guarantee that such strategies will reduce all risk. These descriptions are based on information available as of the date of preparation of this document, and the description may change over time. Past performance of these strategies is not necessarily indicative of future results. There is the possibility of loss and all investment involves risk including the loss of principal. The investment targets described in this presentation are subject to change. Upslope may at any time adjust, increase, decrease or eliminate any of the targets, depending on, among other things, conditions and trends, general economic conditions and changes in Upslope’s investment philosophy, strategy and expectations regarding the focus, techniques, and activities of its strategy. Portfolio The investments or portfolio companies mentioned, referred to, or described are not representative of all investments in vehicles or SMAs managed by Upslope and there can be no assurance that the investments will be profitable or that other investments made in the future will have similar characteristics or results. Past performance of Upslope’s investment vehicles, investments, or investment strategies are not necessarily indicative of future results. Investors should be aware that a loss of investment is possible. No representation is being made that similar profits or losses will be achieved. Performance Results Performance results presented are for information purposes only and reflect the impact that material economic and market factors had on the manager’s decision-making process. No representation is being made that any investor or portfolio will or is likely to achieve profits or losses similar to those shown. Performance results are shown for the Fund’s Class A interests net of all fees, including management and incentive, Fund operating expenses, as well as all trading costs charged by the custodian, to the investor. Historical SMA composite performance calculations (inception – May 2023) have been independently verified by LICCAR, LLC. Subsequent returns based on Fund performance data from Opus Fund Services. Performance of individual investors may vary based upon differing management fee and incentive allocation arrangements, the timing related to additional client deposits or withdrawals and the actual deployment and investment of a client portfolio, the length of time various positions are held, the client’s objectives and restrictions, and fees and expenses incurred by any specific individual portfolio. Performance estimates are subject to future adjustment and revision. The information provided is historical and is not a guide to future performance. Investors should be aware that a loss of investment is possible. This presentation cannot and does not guarantee or predict a similar outcome with respect to any future investment. Upslope makes no implications, warranties, promises, suggestions or guarantees whatsoever, in whole or in part, that by participating in any investment of or with Upslope you will experience similar investment results and earn any money whatsoever. Indices Comparisons References to market or composite indices, benchmarks, or other measures of relative market performance over a specified period of time are provided for information only. Reference or comparison to an index does not imply that the portfolio will be constructed in the same way as the index or achieve returns, volatility, or other results similar to the index. Indices are unmanaged, include the reinvestment of dividends and do not reflect transaction costs or any performance fees. Unlike indices, Upslope’s investments will be actively managed and may include substantially fewer and different securities than those comprising each index. Upslope’s performance results as compared to the performance of HFRX Equity Hedge Index and S&P Midcap 400 (ticker: MDY) are for informational purposes only. HFRX Equity Hedge Index is an index that maintains positions both long and short in primarily equity and equity derivative securities. S&P Midcap 400 (ticker: MDY) is a stock market index that serves as a gauge for the U.S. mid-cap equities sector. The investment program of Upslope does not mirror the indices and the volatility may be materially different than the volatility of the indices. Direct comparisons between Upslope’s performance and the aforementioned indices are not without complications. The indices may be unmanaged, may be market weighted, and indices do not incur fees and expenses. Due to the differences among the portfolios of Upslope and the aforementioned indices, no such index is directly comparable to Upslope. Fund Terms The summary provided herein of the terms and conditions of the fund managed by Upslope does not purport to be complete. The fund’s Offering Documents should be read in its entirety prior to an investment in the fund. |
Original Post
Editor’s Note: The summary bullets for this article were chosen by Seeking Alpha editors.


