


")


REIT Performance
REITs averaged a modest decline in July (-1.17%), again falling short of the broader market, which saw positive returns from the NASDAQ (+3.7%), S&P 500 (+2.2%), and Dow Jones Industrial Average (+0.2%). The market cap-weighted Vanguard Real Estate ETF (VNQ) slightly outperformed the average REIT in July (+0.09% vs. -1.17%) and has dramatically outperformed year-to-date (+2.10% vs. -6.42%). The spread between the 2025 FFO multiples of large cap REITs (17.6x) and small cap REITs (13.0x) widened in July as multiples held steady for large caps but contracted 0.3 turns for small caps. Investors currently need to pay an average of 35.4% more for each dollar of FFO from large-cap REITs relative to small-cap REITs. In this monthly publication, I will provide REIT data on numerous metrics to help readers identify which property types and individual securities currently offer the best opportunities to achieve their investment goals.
Source: Graph by Simon Bowler of 2nd Market Capital, Data compiled from S&P Global Market Intelligence LLC. See important notes and disclosures at the end of this article
After badly underperforming in each of the first 5 months of 2025, micro-cap REITs (-0.20%) have now outpaced their larger peers in back-to-back months as mid-caps (-1.18%), small caps (-1.33%), and large caps (-1.55%) averaged deeper negative returns in July. During the first seven months of 2025, large cap REITs have outperformed small caps by 547 basis points.
Source: Graph by Simon Bowler of 2nd Market Capital, Data compiled from S&P Global Market Intelligence LLC. See important notes and disclosures at the end of this article
Only 6 out of 18 Property Types Averaged Positive Returns in July
66.67% of REIT property types averaged a negative total return in July. There was a 14.34% total return spread between the best- and worst-performing property types. Infrastructure (+5.08%) and Advertising (+4.07%) saw the strongest returns in July. Land (-9.28%) and Self Storage REITs (-6.85%) underperformed all other REIT property types.
Source: Table by Simon Bowler of 2nd Market Capital, Data compiled from S&P Global Market Intelligence LLC. See important notes and disclosures at the end of this article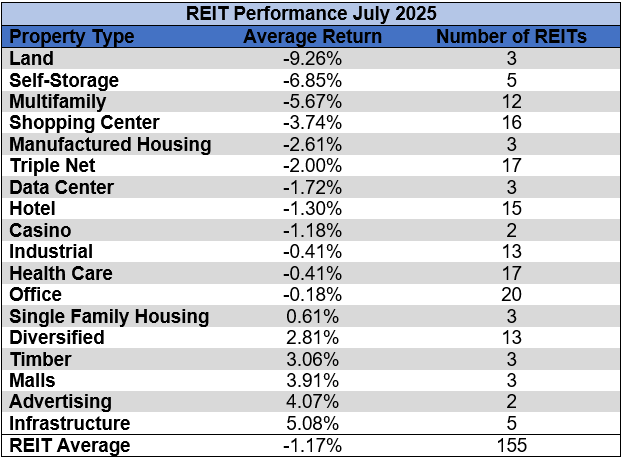

Hotel (-16.84%), Land (-14.92%), Office (-14.64%), Shopping Center (-14.57%), and Multifamily REITs (-10.90%) struggled over the first seven months of 2025 with double-digit average declines. Health Care (+8.56%), Infrastructure (+6.36%), Casino (+6.17%), and Advertising (+1.50%) were the only property types to average positive returns over the first seven months of the year.
Source: Table by Simon Bowler of 2nd Market Capital, Data compiled from S&P Global Market Intelligence LLC. See important notes and disclosures at the end of this article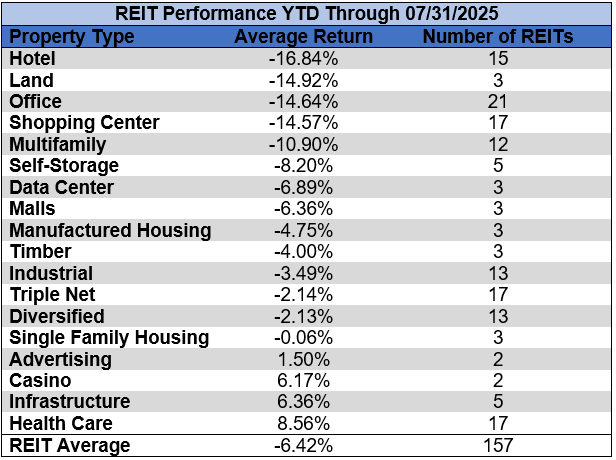

The REIT sector as a whole saw the average P/FFO (2025Y) remain unchanged at 13.7x in July. 44.4% of property types averaged multiple expansion, 50% averaged multiple contraction, and 5.6% saw multiples hold steady in July. Data Centers (26.9x), Single Family Housing (21.8x), Multifamily (21.8x), Land (20.7x), and Infrastructure (19.4x) currently trade at the highest average multiples among REIT property types. Hotels (6.3x), Office (8.7x), and Malls (9.4x) are the only property types that average single-digit FFO multiples.
Source: Table by Simon Bowler of 2nd Market Capital, Data compiled from S&P Global Market Intelligence LLC. See important notes and disclosures at the end of this article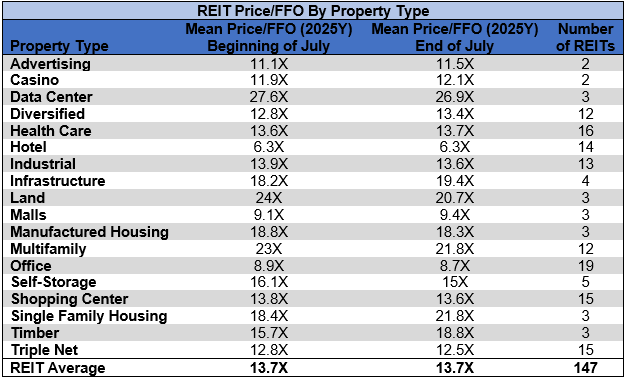

Performance of Individual Securities
City Office REIT (CIO) (+32.26%) surged in July after announcing on July 24th that they will be acquired by MCME Carell at a price of $7.00/share. The transaction is expected to close during the 4th quarter of 2025. CIO also announced that the July 24th dividend was the final common dividend distribution and that the common dividend will be suspended through the close of the acquisition.
After a rare month in the black in June (+52.26%), Wheeler REIT (WHLR) returned to freefalling in July (-43.73%) as it underperformed all other REITs. Over the first 7 months of 2025, WHLR has amassed a sector-worst -99.28% total return.
39.35% of REITs had a positive total return in July. REITs have averaged a -6.42% year-to-date total return in 2025, which falls far short of the +3.83% return for the REIT sector over the first seven months of 2024.
For the convenience of reading this table in a larger font, the table below is available as a PDF as well.
Source: Table by Simon Bowler of 2nd Market Capital, Data compiled from S&P Global Market Intelligence LLC. See important notes and disclosures at the end of this article Source: Table by Simon Bowler of 2nd Market Capital, Data compiled from S&P Global Market Intelligence LLC. See important notes and disclosures at the end of this article Source: Table by Simon Bowler of 2nd Market Capital, Data compiled from S&P Global Market Intelligence LLC. See important notes and disclosures at the end of this article
Dividend Yield
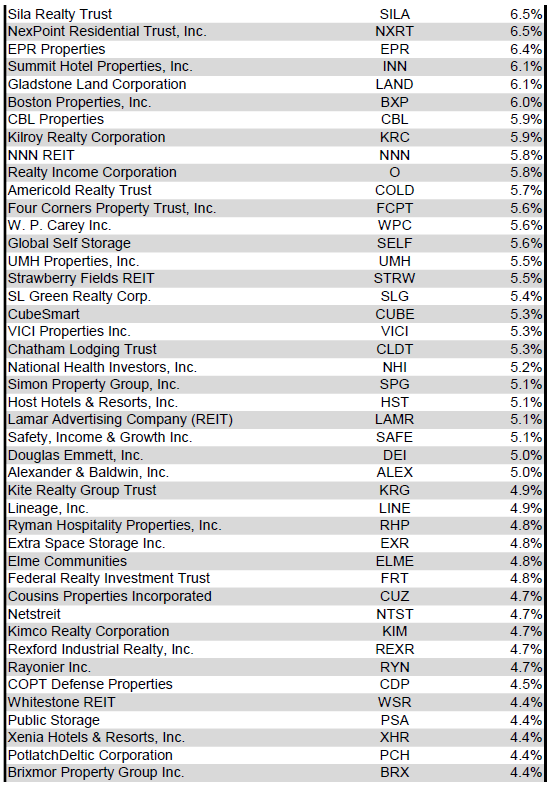
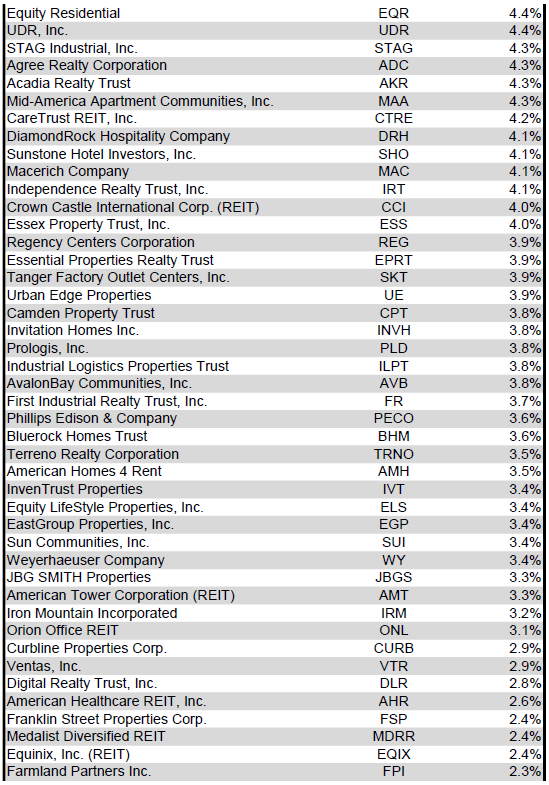
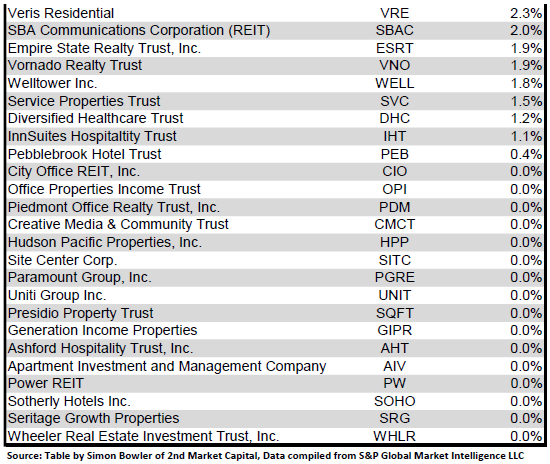
Dividend yield is an important component of a REIT’s total return. The particularly high dividend yields of the REIT sector are, for many investors, the primary reason for investment in this sector. As many REITs are currently trading at share prices well below their NAV, yields are currently quite high for many REITs within the sector. Although a particularly high yield for a REIT may sometimes reflect a disproportionately high risk, there exist opportunities in some cases to capitalize on dividend yields that are sufficiently attractive to justify the underlying risks of the investment. I have included below a table ranking equity REITs from highest dividend yield (as of 7/31/2025) to lowest dividend yield.
For the convenience of reading this table in a larger font, the table below is available as a PDF as well.
Source: Table by Simon Bowler of 2nd Market Capital, Data compiled from S&P Global Market Intelligence LLC. See important notes and disclosures at the end of this article Source: Table by Simon Bowler of 2nd Market Capital, Data compiled from S&P Global Market Intelligence LLC. See important notes and disclosures at the end of this article Source: Table by Simon Bowler of 2nd Market Capital, Data compiled from S&P Global Market Intelligence LLC. See important notes and disclosures at the end of this article Source: Table by Simon Bowler of 2nd Market Capital, Data compiled from S&P Global Market Intelligence LLC. See important notes and disclosures at the end of this article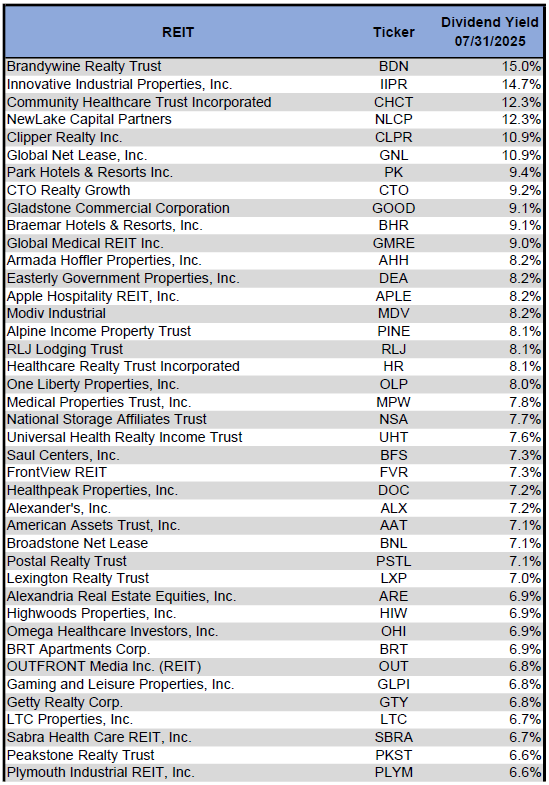


Although a REIT’s decision regarding whether to pay a quarterly dividend or a monthly dividend does not reflect on the quality of the company’s fundamentals or operations, a monthly dividend allows for smoother cash flow to the investor. Below is a list of equity REITs that pay monthly dividends, ranked from highest yield to lowest yield.
Source: Table by Simon Bowler of 2nd Market Capital, Data compiled from S&P Global Market Intelligence LLC. See important notes and disclosures at the end of this article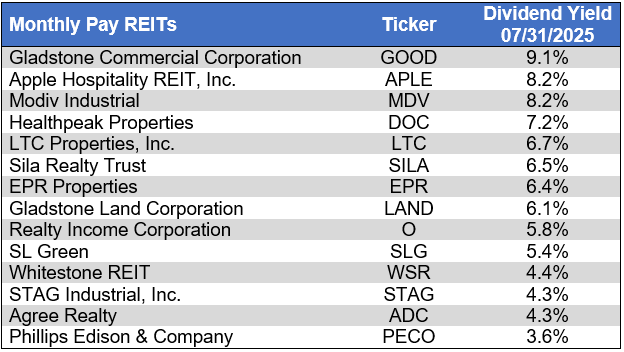

Dividend News
5 REITs announced quarterly dividend increases in July. The largest dividend increase came from Industrial Logistics Properties Trust (ILPT) (+400.00%), which quintupled their dividend. However, even after this hike, ILPT’s dividend is still 84.8% lower than it was at the end of 2019. In total, 49 REITs have raised their dividend during the first seven months of 2025.
Source: S&P Global Market Intelligence
Economic Health
The number of corporate bankruptcies rose month-over-month for the 4th straight month in July (after an upward revision to June’s figure) and reached the highest monthly total since July 2020 as elevated interest rates continue to strain heavily indebted companies. There were more filings year-to-date in 2025 than in the first 7 months of any other year since 2010.
Source: S&P Global Market Intelligence
Valuation
REIT Premium/Discount to NAV by Property Type
Below is a downloadable data table that ranks REITs within each property type from the largest discount to the largest premium to NAV. The consensus NAV used for this table is the average of analyst NAV estimates for each REIT. Both the NAV and the share price will change over time, so I will continue to include this table in upcoming issues of The State of REITs with updated consensus NAV estimates for each REIT for which such an estimate is available.
For the convenience of reading this table in a larger font, the table below is available as a PDF as well.
Source: Table by Simon Bowler of 2nd Market Capital, Data compiled from S&P Global Market Intelligence LLC. See important notes and disclosures at the end of this article Source: Table by Simon Bowler of 2nd Market Capital, Data compiled from S&P Global Market Intelligence LLC. See important notes and disclosures at the end of this article Source: Table by Simon Bowler of 2nd Market Capital, Data compiled from S&P Global Market Intelligence LLC. See important notes and disclosures at the end of this article Source: Table by Simon Bowler of 2nd Market Capital, Data compiled from S&P Global Market Intelligence LLC. See important notes and disclosures at the end of this article
Takeaway
The large cap REIT premium (relative to small cap REITs) widened in July, and investors are now paying on average about 35% more for each dollar of 2025 FFO/share to buy large cap REITs than small cap REITs (17.6x/13.0x – 1 = 35.4%). As can be seen in the table below, there is presently a strong positive correlation between market cap and FFO multiple.
Source: Table by Simon Bowler of 2nd Market Capital, Data compiled from S&P Global Market Intelligence LLC. See important notes and disclosures at the end of this article
The table below shows the average NAV premium/discount of REITs for each market cap bucket. This data, much like the data for price/FFO, shows a strong, positive correlation between market cap and Price/NAV. The average large-cap REIT (-5.32%) trades at a single-digit discount to consensus NAV, and mid-cap REITs (-12.36%) trade at a low double-digit discount. Small-cap REITs (-28.54%) trade a little below 3/4 of NAV, while micro-caps (-39.05%) trade at only about 3/5 of their respective NAVs.
Source: Table by Simon Bowler of 2nd Market Capital, Data compiled from S&P Global Market Intelligence LLC. See important notes and disclosures at the end of this article
Mixed July Inflation Data Leaves Potential Rate Cut Path Unclear
After declining nicely through the first half of 2025, the producer price index (PPI) spiked up sharply (+0.9% month-over-month) in July. It is not yet clear whether this sharp single-month increase in PPI reflects a full or partial tariff impact, so it will make the next few months of data all the more important to monitor.
Source: CNBC & U.S. Bureau of Labor Statistics
Consumers, however, are still not yet seeing any material tariff impact as the consumer price index (CPI) held steady at 2.7% in July and remains lower than the 3% inflation at the start of the year. The PPI is traditionally a leading indicator, so we have yet to see whether or to what extent the July PPI spike could pass through to consumers over the upcoming months.
Source: CNBC & U.S. Bureau of Labor Statistics
July 30th marked the 5th straight meeting at which the Fed Funds rate was left at 4.25% – 4.50%. However, it also marked the first meeting since 1993 in which two Fed governors dissented from a Fed decision. This dissent came from a preference from both dissenting governors for a rate cut. After seeing both the PPI and CPI data (as well as many other data points), FedWatch odds of a September rate cut have risen to over 90% (as of 08/16).
Source: CME Group FedWatch
FedWatch odds of at least one rate cut by year end are now over 99% (as of 08/16), with odds of a total of 75 basis points of cuts now at 41.8%. These odds will change with each new economic data point released, but currently suggest market expectations of multiple cuts beginning in September.
Source: CME Group FedWatch
The REIT sector got pummeled as the Fed rapidly raised rates in a sharp course correction after their “transitory” inflation theory proved inaccurate. If the Fed initiates a new rate-cutting cycle, however, it could have the opposite effect for REITs, as it could fuel cap rate compression and a lower cost of debt. Cap rate compression would raise the value of REIT assets, while a declining cost of debt would facilitate accretive refinancings and improve cash flow. Due to the greater impact that changes in interest rates have on the REIT sector relative to most other sectors of the markets, a robust rate-cutting cycle could drive REIT outperformance over upcoming quarters. However, the timing and magnitude of cuts will be heavily impacted by a litany of economic data points over the upcoming months, so active investors would be wise to closely follow both individual company-level reporting as well as economic data trends to identify opportunities to attain alpha.
Editor’s Note: This article covers one or more microcap stocks. Please be aware of the risks associated with these stocks.

")

")


")
