


Few articles have been published about Silvercrest Asset Management Group Inc. (NASDAQ:SAMG) over the last years, with the most recent one being published in August 2023. This is why I decided to write an article about this under-followed company that has significant upside potential in the foreseeable future.
Business Overview
I quote from the latest annual report:
We are a full-service wealth management firm focused on providing financial advisory and related family office services to ultra-high net worth individuals and institutional investors. In addition to a wide range of investment capabilities, we offer a full suite of complementary and customized family office services for families seeking comprehensive oversight of their financial affairs. As of December 31, 2023, our assets under management were $33.3 billion.
We were founded 21 years ago on the premise that if we staffed and organized our business to deliver a combination of excellent investment performance together with high-touch client service, we would differentiate our business from a crowded field of firms nominally in the wealth management business. We seek to attract and serve a base of individuals and families with $10 million or more of investable assets, and we believe we are well-positioned to offer comprehensive investment and family office service solutions to families with over $25 million of investable assets.”
A Key Point About SAMG
SAMG’s annual client retention rate has averaged 98% since 2006 and the compound annual growth rate, or CAGR, in our assets under management since inception is 27%, as quoted below (emphasis added):
As of December 31, 2023, we had 835 client relationships with an average size of $39 million that represented approximately 99% of our assets under management. Our top 50 relationships averaged $421 million in size, and such amount represented approximately 63% of our assets under management. As a boutique, we are large enough to provide an array of comprehensive capabilities, yet agile enough to coordinate and deliver highly personalized client service.
Our annual client retention rate has averaged 98% since 2006 and, as shown below, the compound annual growth rate, or CAGR, in our assets under management since inception is 27%. Our growth rate in any 12-month period ending on the last day of a fiscal quarter since inception ranged from (23%) to 1,142%, with a mean of 32%. We believe our record of growth is a direct result of our demonstrated record of delivering excellent performance together with highly personalized service to our clients.”
and:
Source: SAMG’s annual report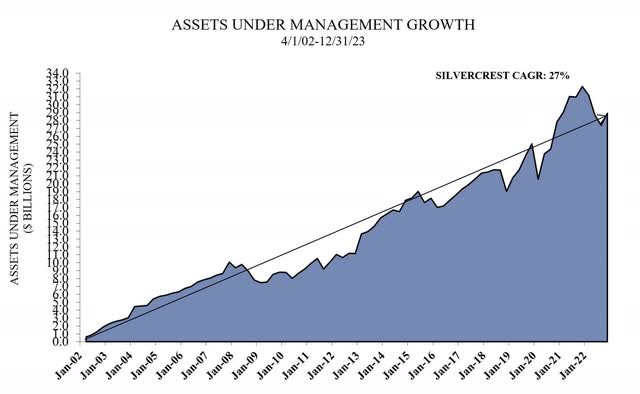

These are excellent figures and imply that the clients have been fully satisfied with the company’s investment strategies and the associated results.
Specifically, each of the company’s equity strategies has outperformed its benchmark since inception, as illustrated below:
|
PROPRIETARY EQUITY PERFORMANCE |
ANNUALIZED PERFORMANCE |
|||||||||||||||||||||
|
AS OF 12/31/23 |
INCEPTION |
1-YEAR |
3-YEAR |
5-YEAR |
7-YEAR |
INCEPTION |
||||||||||||||||
|
Large Cap Value Composite |
4/1/02 |
13.0 |
9.6 |
13.4 |
11.7 |
9.4 |
||||||||||||||||
|
Russell 1000 Value Index |
11.5 |
8.9 |
10.9 |
8.3 |
7.6 |
|||||||||||||||||
|
Small Cap Value Composite |
4/1/02 |
15.6 |
9.0 |
11.7 |
7.4 |
10.3 |
||||||||||||||||
|
Russell 2000 Value Index |
14.6 |
7.9 |
10.0 |
6.1 |
7.9 |
|||||||||||||||||
|
Smid Cap Value Composite |
10/1/05 |
9.6 |
6.4 |
9.6 |
7.0 |
9.2 |
||||||||||||||||
|
Russell 2500 Value Index |
16.0 |
8.8 |
10.8 |
7.1 |
7.6 |
|||||||||||||||||
|
Multi Cap Value Composite |
7/1/02 |
12.4 |
7.1 |
11.1 |
8.9 |
9.4 |
||||||||||||||||
|
Russell 3000 Value Index |
11.7 |
8.8 |
10.8 |
8.2 |
8.1 |
|||||||||||||||||
|
Equity Income Composite |
12/1/03 |
7.0 |
8.4 |
9.4 |
8.7 |
10.8 |
||||||||||||||||
|
Russell 3000 Value Index |
11.7 |
8.8 |
10.8 |
8.2 |
8.2 |
|||||||||||||||||
|
Focused Value Composite |
9/1/04 |
4.4 |
2.5 |
6.6 |
5.6 |
9.1 |
||||||||||||||||
|
Russell 3000 Value Index |
11.7 |
8.8 |
10.8 |
8.2 |
8.0 |
|||||||||||||||||
|
Small Cap Opportunity Composite |
7/1/04 |
18.1 |
5.1 |
12.6 |
10.1 |
10.8 |
||||||||||||||||
|
Russell 2000 Index |
16.9 |
2.2 |
10.0 |
7.3 |
8.0 |
|||||||||||||||||
|
Small Cap Growth Composite |
7/1/04 |
7.5 |
(1.0 |
) |
12.8 |
12.1 |
10.5 |
|||||||||||||||
|
Russell 2000 Growth Index |
18.7 |
(3.5 |
) |
9.2 |
8.1 |
8.2 |
||||||||||||||||
|
Smid Cap Growth Composite |
1/1/06 |
11.5 |
(5.3 |
) |
14.9 |
13.7 |
10.5 |
|||||||||||||||
|
Russell 2500 Growth Index |
18.9 |
(2.7 |
) |
11.4 |
10.2 |
9.2 |
||||||||||||||||
I believe that one of key reasons for the company’s consistently good performance is the fact that a significant part of its equity portfolio consists of small-cap stocks, as illustrated below:
Source: SAMG’s annual report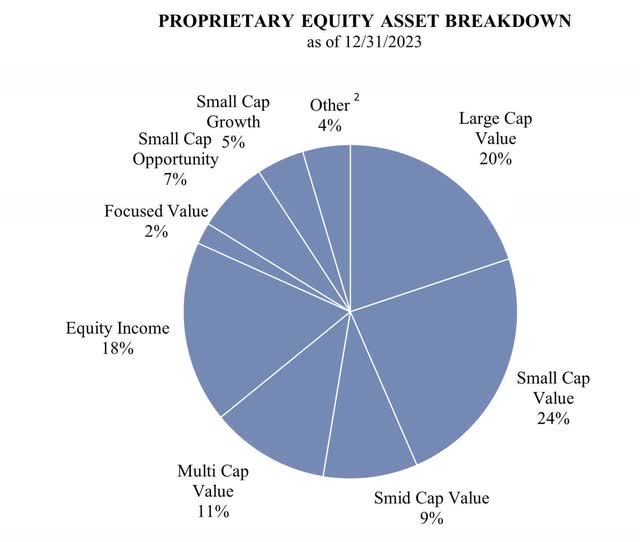

And the small caps have strongly outperformed the large caps over the last 25 years, according to Schroders plc (OTCPK:SHNWF) and JPMorgan Chase (JPM), as shown here and here.
Schroders is a British multinational asset management company founded in 1804 in England, and JPM is the largest bank in the U.S. and the world’s largest bank by market capitalization.
The Fortress Balance Sheet
Revenue breakdown for the years ended December 31, 2023, and 2022 is illustrated below:
|
For the Years Ended December 31, |
||||||||||||||||
|
(in thousands) |
2023 |
2022 |
2023 vs. 2022($) |
2023 vs. 2022(%) |
||||||||||||
|
Management and advisory fees |
$ |
112,794 |
$ |
118,725 |
$ |
(5,931 |
) |
(5.0 |
)% |
|||||||
|
Performance fees and allocations |
— |
2 |
(2 |
) |
(100.0 |
)% |
||||||||||
|
Family office services |
4,616 |
4,490 |
126 |
2.8 |
% |
|||||||||||
|
Total revenue |
$ |
117,410 |
$ |
123,217 |
$ |
(5,807 |
) |
(4.7 |
)% |
|||||||
As shown above, SAMG generates revenue from management and advisory fees, performance fees and family office services fees. And the higher the assets under management, or AUM, the higher the revenue. The reason is that most of the revenue comes from management and advisory fees, which are highly dependent on the AUM.
On that front, SAMG notes:
Its management and advisory fees are generated by managing assets on behalf of separate accounts and acting as investment adviser for various investment funds. Its performance fees relate to assets managed in external investment strategies in which it has a revenue sharing arrangement and in funds in which it has no partnership interest.”
That said, revenue have dropped slightly on a YoY basis since 2021, as illustrated below:
|
For the Year Ended December 31, |
||||||||||||
|
(in thousands except as indicated) |
2023 |
2022 |
2021 |
|||||||||
|
Revenue |
$ |
117,410 |
$ |
123,217 |
$ |
131,603 |
||||||
|
Income before other income (expense), net |
$ |
18,819 |
$ |
38,562 |
$ |
30,521 |
||||||
|
Net income |
$ |
15,183 |
$ |
30,793 |
$ |
24,946 |
||||||
|
Net income margin |
12.9 |
% |
25.0 |
% |
19.0 |
% |
||||||
|
Net income attributable to Silvercrest |
$ |
9,094 |
$ |
18,828 |
$ |
14,693 |
||||||
|
Adjusted EBITDA |
$ |
26,878 |
$ |
32,021 |
$ |
43,441 |
||||||
|
Adjusted EBITDA margin |
22.9 |
% |
26.0 |
% |
33.0 |
% |
||||||
|
Assets under management at period end (billions) |
$ |
33.3 |
$ |
28.9 |
$ |
32.3 |
||||||
|
Average assets under management (billions) |
$ |
31.1 |
$ |
30.6 |
$ |
30.1 |
||||||
The key reason for the revenue decline in 2022 compared to prior year period was the fact that we had a bloodbath in 2022, with many stocks collapsing and the S&P 500 suffering its worst year since the financial crisis in 2008, which created a negative market sentiment. Specifically, according to the statistics, the S&P 500 (SP500) was down 19%, Nasdaq (COMP.IND) was down 33%, the Dow Jones (DJI) was down 9%, and the Russell 2000 Index (RTY) for small-cap stocks was down 22%.
Moreover, the key reason for the revenue decline in 2023 compared to prior year period was the fact that:
Equity market gains were highly concentrated in a handful of large cap technology companies. As a result of such narrow leadership and economic uncertainty, during the third quarter 2023 earnings call, I stated we could face challenging market conditions at Silvercrest for another year. During the fourth quarter of 2023, company participation in equity market gains broadened significantly.”
Despite the YoY drop in revenue and net income in 2023, SAMG announced strong profitability for another year in a row. It must also be noted that it has generated positive operating cash flow and positive free cash flow over the last several years, as illustrated below:
|
Years Ended December 31, |
||||||||||||
|
(in thousands) |
2023 |
2022 |
2021 |
|||||||||
|
Net cash provided by operating activities |
$ |
20,975 |
$ |
23,383 |
$ |
44,278 |
||||||
|
Net cash used in investing activities |
(3,878 |
) |
(956 |
) |
(908 |
) |
||||||
The drop in operating cash flow in 2023 compared to prior year period is due to the aforementioned YoY revenue and net income decline. However, I project that 2024 will be better than 2023 on all fronts (revenue, net income, adj. EBITDA, operating cash flow), as shown in the next paragraph.
Last but not least, SAMG has maintained a pristine balance sheet. Specifically, as of Q4 2023, cash & cash equivalents & short-term investments are approximately $71 million, and interest-bearing debt is approximately $3 million, including finance lease liabilities, which are considered debt from an accounting standpoint. This means that SAMG has negative net debt (net cash position) of approximately $68 million, so it has zero leverage.
Outlook And Growth
SAMG has taken several growth initiatives, according to the latest annual report (emphasis added):
We built our company to take market share from financial services firms whose wealth management models we believe are flawed. Our growth strategy has been and will continue to be to grow our business organically, to complement our organic growth with strategic hires and acquisitions and to expand our presence in the institutional market. In support of each of these initiatives we plan to continue to invest in establishing our brand through continued selective advertising and public relations. “
Specifically:
1) Acquisitions: SAMG has completed several acquisitions since its inception with the latest one being the acquisition of Cortina. And thanks to its pristine balance sheet, I believe that SAMG could make another acquisition in the foreseeable future.
2) Brand Management: SAMG has invested in raising awareness about its brand by increasing media exposure, as quoted below (emphasis added):
We have invested heavily to build, maintain and extend our brand. We have done so in the belief that creating awareness of our company and its differentiated characteristics would support all aspects of our business, but most notably our growth.
With limited resources, we have created a focused national advertising campaign, which has drawn praise from clients, prospects and competitors alike. We have carefully chosen media outlets that reach our target audience efficiently. This effort has resulted in appearances on CNBC. We estimate that the new business that we get directly as a result of our advertising finances its cost.
Complementing our advertising strategy, and again, with limited resources, we have also invested in an effort to get media coverage of our company in some of the nation’s most prestigious national publications as well as in industry journals and newsletters. This effort has resulted in press coverage by the Wall Street Journal, Barron’s, Bloomberg, the Financial Times and The New York Times as well as various trade publications distributed within our industry. This public relations effort has proven very helpful in establishing our company as a leader in our industry. “
And it appears that these initiatives have started to bear fruit and have contributed to a positive outlook for 2024, based on the CEO’s recent statements below (emphasis added):
During the fourth quarter of 2023, company participation in equity market gains broadened significantly. Progress has continued into 2024, setting the stage for a better environment for our business.”
and (emphasis added):
Silvercrest’s pipeline of new business opportunities have significantly improved since the fourth quarter of 2023. While the institutional search environment remains slow, Silvercrest’s actionable institutional business pipeline has increased to $735 million. Silvercrest’s outsourced chief investment officer (OCIO) AUM has risen to $1.7 billion, which includes a new small college endowment. The OCIO pipeline has increased to $585 million, and our consultant relationships have strengthened.”
and (emphasis added):
Silvercrest has never been busier with new initiatives. We are focused on those new opportunities, as well as investments to drive future growth in the business, including value-added hires.”
Valuation
At the current price of $15 per share, the Silvercrest Asset Management Group Inc. market cap is approximately $208 million. As of Q4 2023, cash & cash equivalents & short-term investments are approximately $71 million, and interest-bearing debt is approximately $3 million (including finance lease liabilities, which are considered debt from an accounting standpoint). This means that SAMG has negative net debt (net cash position) of approximately $68 million, so it has zero leverage. Therefore, its Enterprise Value currently is approximately $140 million.
Revenue and adj. EBITDA in 2023 were $117 million and $26.9 million, respectively. As a result, EV-to-2023 Revenue and EV-to-2023 adj. EBITDA are 1.2 times and 5.2 times, respectively, so both ratios are low on absolute and relative valuation analysis.
Thanks to the aforementioned growth initiatives, I project that the company will increase its AUM, revenue and adj. EBITDA in 2024, so I forecast that EV-to-2024 Revenue and EV-to-2024 adj. EBITDA will be even lower than in 2023.
Dividend Sustainability
First, SAMG is not new in paying dividends. It has paid a quarterly dividend since 2013, while also consistently increasing it, as shown here.
Second, I project that operating cash flow will be at least $20 million in 2024 and the foreseeable future, based on the company’s news and growth initiatives.
Meanwhile, CapEx has been less than $5 million over the last years, according to the annual cash flow reports, and I don’t expect it to change in the foreseeable future. Therefore, I estimate that annual free cash flow will be at least $15 million in the foreseeable future.
The annual dividend payment is approximately $7 million, based on $0.76 per share annual dividend. In other words, I project that the annual free cash flow will continue to far exceed the annual dividend payment in the foreseeable future.
On top of this, SAMG’s cash & cash equivalents & short-term investments are approximately $71 million, which is a significant cash cushion that can support the annual dividend payment for several years if needed.
After all, I project that the dividend is sustainable in the next years, barring unforeseen events.
The Buyback Program
To-date, SAMG has repurchased its stock at an average price of $18.62 per share, as quoted below (amounts in thousands):
“On July 29, 2021, the Company announced that its Board of Directors had approved a share repurchase program authorizing the Company to repurchase up to $15,000 of the Company’s outstanding Class A common stock.
As of December 31, 2023, the Company had purchased 808,455 shares of Class A common stock for an aggregate price of approximately $15,057.”
Insider Ownership
Insiders own 8.3%, which is a significant stake, so their interests are aligned with those of shareholders, as shown here.
Risks
As presented in a previous paragraph, each of the company’s equity strategies has outperformed its benchmark since inception. But past performance is no guarantee of future results, and the fund managers have to continuously prove their investment skills by beating their benchmarks amid fierce competition in the asset management industry.
That said, SAMG’s portfolios could underperform in the next years due to a handful of reasons such as tough macro environment, geopolitical events (e.g., wars) that impact negatively the American economy, etc. And sustained underperformance could lead to net outflows in terms of the company’s AUM, with some clients turning to SAMG’s peers, which will weigh on the management and advisory fees that feed into the company’s top line.
Additionally, the major indices have hit all-time highs recently, and the rally has been largely fueled by AI exuberance. Market participants have ignored or downplayed the global geopolitical tensions (i.e., Ukraine, Israel, etc.). They have also shrugged off the latest hot CPI and PPI indices, as shown here and here.
However, both indices proved that inflation in the U.S. is stubborn and sticky, so higher interest rates for longer is a sure thing. And it appears that the Fed will wait for the first interest rate cut longer than initially anticipated. As a result, a reality check coupled with a market correction are likely in the next months. That said, the company’s AUM could fall due to a lasting market downturn, which will weigh on the management and advisory fees that feed into the company’s top line.
Takeaway
Silvercrest Asset Management Group Inc. has consistently grown its business, while also maintaining a fortress balance sheet with zero leverage. Its rich dividend is safe, so I believe that this stock deserves a place in every income portfolio. On top of this, its current valuation is low, and the outlook is positive, so I forecast that capital gains are very likely for long-term SAMG investors.


