

")


By Samantha McLemore
“It ain’t what you don’t know that gets you into trouble. It’s what you know for sure that just ain’t so.” – Mark Twain
Markets climbed the proverbial wall of worry in the third quarter. Risks, such as weak seasonals and China, transpired better than expected, powering the market higher. The best performers differed from earlier this year, with the Mag 7 and tech lagging while small and mid-caps outperformed. Opportunity Equity Strategy gained 5.8% in the quarter, slightly below the S&P 500’s 5.9% increase.
In markets and investing, it’s easy to get sucked into the vortex of short-termism. We could fill pages with the quarter’s market-moving jobs, inflation and Fed headlines. Investors must assess a constant stream of news. Only with hindsight can we see that most is noise.
We remain in a bull market. Since the low in 2022, the S&P 500 has advanced 61%, the fourth best 2-year plus cyclical bull market in the post-War period1.
Markets are up strongly for the year. The S&P 500’s 22.1% gain is its 16th best start to the year since 1927. The Nasdaq advanced 21.8%, while the Dow returned 13.9%. Small and mid-caps have lagged but still posted respectable returns with the S&P 600 up 9.3% and the Russell 2000 up 11.2%. Internationally, same story. The MSCI World Index notched a 19.3% increase.
Fortunately, plentiful caution accompanies the strong run. Money market funds recently hit an all-time high of $6.5T. According to UBS2, defensive stocks outperformed cyclicals in the quarter. Inflation is back below 50-year averages and economic growth remains solid. Recession fears have plagued the market’s entire advance.
Our returns have been strong, though we’d prefer stronger. Opportunity Equity’s 16.6% year-to-date return bested the Dow and smaller cap indices, but lagged our primary benchmark the S&P 500. Most investors are satisfied with high-teens annual returns, but we aim to outperform our benchmark.
Several factors weighed on our relative performance. The best year-to-date performers have been large cap, quality names with high momentum. As value managers focused on exploiting opportunities where market expectations diverge most from underlying intrinsic values, we tend to sell into strength and buy into weakness. Our all-cap and cyclical exposure also impacted us. Given the relative opportunity set, we have conviction our approach will benefit us long term.
Fortunately, our longer-term numbers remain strong. Since taking over sole management of Opportunity Equity3 at the end of 2022, it’s up 63.0% (32.1% annualized) vs. the S&P 500’s +54.1% (28.0% annualized).
We believe our investment process works and is differentiated. At Patient Capital, we are compounding evangelists. We want to maximize our investors’ wealth. Only dollars in the bank pay bills and improve living standards.
The US equity market, as measured by the S&P 500, has grown at an annual rate of 9.71% since the end of 1927. One thousand dollars invested at the beginning of the nearly 97-year period would be worth $7,881,300 today.
To reap those rewards, an investor had to do nothing. Just buy and patiently hold. Unfortunately, doing nothing can be exceedingly difficult.
During that period, we faced the Great Depression, a World War and other military conflicts, more than a dozen recessions, a Financial Crisis, pandemics, terrorist attacks, oil shocks, government dysfunction and other traumatic events, a point Warren Buffett likes to make. Each caused significant losses and triggered fear. Investors were frequently tempted to disrupt compounding’s magic by selling into weakness, and many did so.
There are other compounding-killers. Investors tend to chase what’s hot, and fund by selling what’s not, and myopically focus on avoiding losses.
At the height of the Tech Bubble in 2000, investors believed technology had fundamentally changed the economy and promised a whole new world. Retail and institutional investors piled in. At the climax of the housing bubble, people believed housing was immune to price declines representing unbeatable risk-adjusted returns.
Individual investors suffer a bad rap for poor timing, but professional investors face similar temptations due to short-term performance pressures. Bloomberg recently ran a story on Harvard endowment’s performance challenges4, attributing them to “a classic investment mistake: shifting strategies at inopportune times, chasing gains and, in short, buying high and selling low”.
The story notes treasurer Ron Daniel presided over “astonishing growth of the school’s endowment”. Over the past 20 years, since he left, things turned south. Harvard’s 8.8% annualized return ranked seventh of the eight Ivy League universities.
After poor performance in the financial crisis, Harvard “reduced risk”. It also added to natural resources, which did great in the 2000s and terrible in the 2010s. In hindsight, obvious errors. Yet, most investors would have followed a similar approach. When faced with underperformance, investors analyze sources of drag, then change those things.
A logical approach, except it mostly backfires for two reasons. 1) All our information is about the past, while returns are determined by the future. 2) The market is a discounting mechanism. Prices adjust along with our hopes, fears and knowledge.
The longer something has underperformed, the lower its embedded expectations and the bogey for future gains. And visa-versa. Market expectations are a key determinant in the future return equation.
The Financial Crisis destroyed portfolios and scarred investors. People feared a lost decade and more losses. PIMCO5, including Mohamed El-Erian who was coincidentally one of Harvard’s former CIOs, coined the term “a new normal” to describe a muted growth and return outlook. It advocated more active risk management.
At the lows, the market reflected abundant fear and grim expectations. This set the stage for one of stocks’ strongest decades. From the lows in March 2009, the S&P 500 gained 17.4% per year, a whopping 79% greater than the long-term average.
Many agreed with PIMCO’s counsel. Hedge funds got defensive6, and significantly underperformed. Since the end of 2014, hedge funds gained 5.0% on average per year[i] versus the S&P 500’s 13.0% per year. One thousand dollars invested in hedge funds over the period would be worth $1,606, half as much as what one earned in the S&P 500, $3,270.
To maximize wealth, one must tolerate the markets’ inevitable ups-and-downs. As the great economist John Maynard Keynes noted7, “It is the duty of the long-term investor to endure great losses with equanimity.”
Easier said than done. Julian Robertson8, the original Tiger fund, earned returns of nearly 32% per year from 1980 through 1998. That stellar track record didn’t stop clients from withdrawing most of their money when he underperformed in the late 90s. Robertson accurately predicted the Tech Bubble. His decision not to participate doomed his firm. Tiger closed in March 2000 at the peak of the Bubble.
Robertson’s final letter noted: “The tragedy is, however, that the only way to generate short-term performance in the current environment is to buy these (tech) stocks. That makes the process self-perpetuating until the pyramid eventually collapses under its own excess.” He was exactly right. He still went out of business.
Given the tech crash that came next, investors would have been well served by adding to their underperforming Tiger positions rather than redeeming. That’s often the case. Robertson’s letter observed, “The key to Tiger’s success over the years has been a steady commitment to buying the best stocks and shorting the worst.”
Which brings us full circle, as that’s exactly the approach that’s worked best year-to-date. According to Bloomberg9, momentum, size (larger cap), low volatility and quality are the best performing factors, while highest short interest and value are amongst the worst. Goldman Sachs10 recently noted an unusually wide spread between valuations for high and low-quality factors.
While we love compounding, the pervasive enthusiasm for “quality compounders” makes us nervous. It’s empirically well-founded. Arizona State’s Hendrik Bessembinder’s research11 shows that less than 1% of companies generated half the wealth creation of US stockholders since 1926. Charlie Munger convinced Warren Buffett (and the rest of us) that “a great business at a fair price is superior to a fair business at a great price.”
Unfortunately, Mae West’s claim that “too much of a good thing can be wonderful” is rarely the case in markets. As sentiment and valuation ratchet up, future returns tend to rachet down.
In Stocks for the Long Run, Jeremy Siegel12 compares the fundamentals and stock returns of IBM to Standard Oil of NJ from 1950-2010. IBM developed the first commercial computer and dominated technology while oil’s importance to the economy declined significantly. Oil stocks fell from 20% of the market to nearly half that.
IBM grew revenue per share and earnings per share 11% per year, while Standard Oil grew those same measures 8% per year. Yet, Standard Oil’s stock returned 14.5% while IBM’s returned 13.0%. Why? Valuation matters. IBM’s beginning P/E was 22.5x with a 2.2% dividend yield. Standard Oil traded for 12.9x with a dividend yield of 4.2%
Rising quality compounder valuations reflect widespread recognition of their merits. Below is a sample of some widely recognized compounders’ historical valuations. Their average forward P/E is ~35.5x, a 47% premium to the S&P 500’s 24.2x. In 2010, you only needed to pay a 3% premium for this basket, great starting conditions.
The compounders’ average multiple has grown 25% since pre-pandemic and 86% from 2010 to 2019. (vs. 20% and 63% respectively for the S&P 500). The S&P 600 Small Cap index, on the other hand, saw declining valuation multiples (by around 15%)!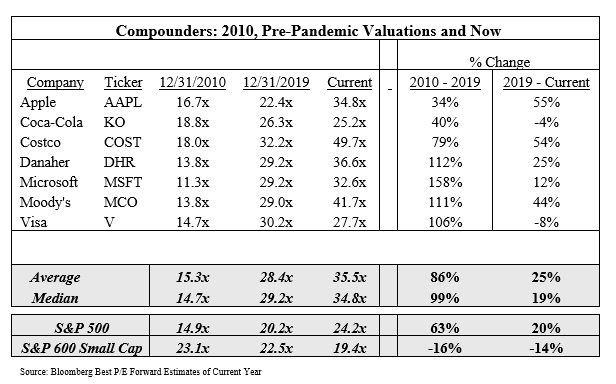

Investor sentiment, market performance and valuations rhyme. In December 1972, the Nifty Fifty peaked at 41.9x trailing earnings, a slight premium to the 36.3x trailing multiple for our compounder group. The Nifty Fifty returned 43% on average in the trailing twelve months before the peak vs. 38.1% for our compounder group. Over the prior five years, the Nifty Fifty’s 28% annual returns exceeded our compounder’s 21% returns.
While we aren’t quite yet at the extreme reached in 1972, it’s close enough to warrant caution. The Nifty Fifty lost half their value over the two years after the peak. This occurred despite not being significantly overvalued as Jeremy Siegel’s excellent analysis14 demonstrated. The Nifty Fifty went on to earn roughly market returns over the next 25+ years.
Investor crowding, along with a bear market were enough to trigger significant losses. The 1973-74 bear market included an oil shock, severe inflation and a nasty recession. Fortunately, similar conditions don’t appear imminent.
We prefer it when behavioral conditions favor our investments. Pessimism and fear are an investor’s friend. We agree on the merits of compounders, but believe the current environment calls for discretion and discrimination, in our view.
Our investment process entails careful analysis of intrinsic business fundamentals and market expectations. We want rock-bottom expectations, and superb and improving fundamentals. It’s never that easy. We spend vast hours trying to find the rare times the market gets it wrong.
As assets have flowed to compounders and tech away from value, international and small cap, we see greater opportunity in the latter. We encourage investors to embrace their underperformers!
In the quarter, we added two new holdings, QXO (QXO $15.77) and Dave & Busters (PLAY $34.05), both small-to-mid caps. We exited JPMorgan (JPM), Everi (EVRI) and some TCRT expired warrants (a company previously known as Ziopharm). JPMorgan is a fabulous company that we’ve owned since the financial crisis. At current levels, we think it’s fully valued and unlikely to outperform. Apollo announced a takeout of Everi.
QXO ended the quarter as our largest position, an unusual circumstance for a new holding. We purchased QXO in a PIPE15 transaction during the quarter. The stock is off to a good start, ending the quarter at $15.77, 73% above the $9.14 deal price, which took the position size to our top slot.
We follow proven money-makers, and paid attention when Brad Jacobs took over QXO. Jacobs had a successful track record driving results at numerous companies, including United Rentals (URI), United Waste, XPO Logistics (XPO), GXO and RXO. He’s best known for XPO, which went from $3 prior to his takeover in 2011 to the current $108, 36x as high, a compound rate above 30% per year!
His strategy at all his companies was to use technology to improve the customer value proposition. He plans to do the same again, this time in the building products space. Jacobs’ objective is to grow partner capital at 25% per year, or 10x over the next decade. Jacobs wanted long-term oriented partners. We never anticipated being “Patient Capital” could help with deal access, but it did. We are very early but see significant long-term compounding potential in QXO.
Dave & Busters is an entertainment attraction, offering games and food. It’s recently been pressured by low-end consumer weakness. It bought its prime competitor Main Event in 2022 with Main Event’s CEO, Chris Morris, assuming leadership. Morris’s strategic plan includes improvements in pricing, remodeling, cost savings, events and more. It estimates changes will improve EBITDA by $680-915M, a significant amount relative to the current 2024 estimated base of $528M. Early results are promising.
Dave & Busters has solid unit economics and attractive returns on capital. The company has been aggressively buying back stock, shrinking shares outstanding by 19% since the beginning of 2023. We see solid growth prospects and strong cash generation as the company exits its current investment cycle. We think Dave & Busters can earn $8-9 per share in free cash flow in 3 years. At a 10x multiple, we believe the stock would be worth mid-$80s, which implies a compound rate of ~35% per year.
We have conviction in our portfolio. We have a well-diversified mix of attractively valued compounders, classic value and early-stage businesses. The portfolio trades at a significant discount to the market (12x forward earnings vs. 22x) with better growth (26% 1-year growth vs. 14%), an attractive mix. We will continue to carefully assess company fundamentals along with market expectations to position the portfolio for maximal compounding.
|
1Ned Davis Research 2 Investing.com 3The Strategy was co-managed by William H Miller III and Samantha McLemore from 1/1/2014 to 12/31/2022. Samantha McLemore became the sole portfolio manager of the Strategy effective 1/1/2023. 4Bloomberg 5Pimco’s New Normal 6Hedge fund performance by strategy – latest data 7John Maynard Keynes’ Thoughts On Investing & Speculation | Investopaper 8Julian Robertson – Wikipedia; Keeping Perspective: Julian Robertson’s Last Letter to Investors – Sizemore Insights 9Stocks for the Long Run – Wikipedia 10Publishing.gs 11Bailliegifford 12Csinvesting.org 13Party Like It’s 1972: What Can the Nifty Fifty Teach Us About Today’s Market? | Bridgeway Capital Management 14Csinvesting.org 15Private Investment in Public Equity Data Sources: Bloomberg, Patient Capital Management The NASDAQ Composite Index is a market capitalization-weighted index that is designed to represent the performance of NASDAQ securities and it includes over 3,000 stocks. The Dow Jones Industrial Average (DJIA) is an unmanaged index composed of 30 blue-chip stocks, each with annual sales exceeding $7 billion. The DJIA is price-weighted, reflects large-cap companies representative of U.S. industry, and historically has moved in tandem with other major market indexes, such as the S&P 500. The Russell 2000 Index is a small-cap stock market index that makes up the smallest 2,000 stocks in the Russell 3000 Index. The S&P SmallCap 600 Index seeks to measure the small-cap segment of the U.S. equity market. The S&P 500 Index is a market capitalization-weighted index of 500 widely held common stocks. Investors cannot invest directly in an index and unmanaged index returns do not reflect any fees, expenses or sales charges. Magnificent 7 is a group of stocks made up of mega-cap stocks Apple (AAPL), Alphabet (GOOGL), Microsoft (MSFT), Amazon.com (AMZN), Meta Platforms (META), Tesla (TSLA) and Nvidia (NVDA). Sahm Recession Rule: Sahm Recession Indicator signals the start of a recession when the three-month moving average of the national unemployment rate (U3) rises by 0.50 percentage points or more relative to the minimum of the three-month averages from the previous 12 months. Leading Economic Indicators (LEI) is composed of 10 economic components whose changes tend to precede changes in the overall economy. Personal consumption expenditures (PCE), also known as consumer spending, is a measure of the spending on goods and services by people of the United States. The Nifty Fifty was a group of 50 large-cap stocks on the New York Stock Exchange that were most favored by institutional investors in the 1960s and 1970s. Capital Expenditures (capex) are funds used by a company to acquire, upgrade, and maintain physical assets such as property, plants, buildings, technology, or equipment. West Texas Intermediate (WTI) Crude Oil is the underlying commodity of the New York Mercantile Exchange’s oil futures contract and serves as one of the main global oil benchmarks. Purchasing Managers Index (PMI) is an indicator of the prevailing direction of economic trends in the manufacturing and service sectors. The information presented should not be considered a recommendation to purchase or sell any security and should not be relied upon as investment advice. It should not be assumed that any purchase or sale decisions will be profitable or will equal the performance of any security mentioned. References to specific securities are for illustrative purposes only. Portfolio composition is shown as of a point in time and is subject to change without notice. Portfolio holdings and portfolio discussion are for a representative Opportunity Equity account. Holdings discussed may or may not be included in all portfolios subject to account guidelines. Investors should carefully review and consider the additional disclosures, investor notices, and other information contained elsewhere in this document as well as the Offering Documents prior to making a decision to invest. All historical financial information is unaudited and shall not be construed as a representation or warranty by us. References to indices and their respective performance data are not intended to imply that the Strategy’s objectives, strategies or investments were comparable to those of the indices in technique, composition or element of risk nor are they intended to imply that the fees or expense structures relating to the Strategy or its affiliates, were comparable to those of the indices; since the indices are unmanaged and cannot be invested in directly. The performance information depicted herein is not indicative of future results. There can be no assurance that Opportunity Equity’s investment objectives will be achieved and a return realized. Returns for periods greater than one year are annualized. The views expressed in this commentary reflect those of Patient Capital Management portfolio managers as of the date of the commentary. Any views are subject to change at any time based on market or other conditions, and Patient Capital Management disclaims any responsibility to update such views. These views are not intended to be a forecast of future events, a guarantee of future results or investment advice. Because investment decisions are based on numerous factors, these views may not be relied upon as an indication of trading intent on behalf of any portfolio. Any data cited herein is from sources believed to be reliable, but is not guaranteed as to accuracy or completeness. Click for the Opportunity Equity Strategy Composite Performance Disclosure. ©2024 Patient Capital Management, LLC Opportunity Equity Annualized Performance (%) as of 9/30/24
Related Content Christina Malbon’s 3Q 2024 Quarterly Investment Review |
Original Post
Editor’s Note: The summary bullets for this article were chosen by Seeking Alpha editors.


")


")


