








Introduction To The Tema Space Innovators ETF
The Tema Space Innovators ETF (NASA) started trading on the 30th of March 2026 and has about $1 billion in AUM. It has an expense ratio of 0.75% and belongs to Tema ETFs LLC, an asset management firm that was set up in 2022. This ETF doesn’t offer any distributions.
NASA’s Structure and Purpose
NASA is an actively managed ETF that focuses on global equities that are involved in the space-related business. This could encompass activities such as space exploration, rockets and propulsion systems, satellite equipment and communication systems, orbital and suborbital platforms related to rockets and satellites, space-related data collection (which is typically used for intelligence and imagery), GPS navigation activities, etc. Note that NASA typically focuses on businesses where at least 50% of their revenue comes from the above-mentioned activities; however, it also makes room for aerospace and defense companies that don’t generate the majority of their revenue from these space-related activities but manufacture systems and hardware that are still oriented around space.
Investors should also note that unlike most of the ETFs in the competitive landscape that typically seek to mirror the performance of third-party indices, NASA’s return outperformance is tied to the stock picking capabilities of a couple of individuals. Currently, the portfolio managers are Yuri Khodjamirian and Hong Yi Chen; both these individuals are graduates from the University of Cambridge, have completed their CFAs [Chartered Financial Analyst], and have combined investment management experience of roughly 35 years.
TEMA ETFs
TEMA ETFs
What Are The Main Features Of NASA’s Portfolio?
NASA sets out to own a portfolio of stocks ranging from anything from 15 stocks to at least 100 (this will vary over time, based on which stocks meet the portfolio managers’ specific criteria), but as of October 2026, it owns a total of 36 stocks.
While stocks are sourced from across the globe, this portfolio is still heavily concentrated in the US, which alone provides 54% of the portfolio. All other regions only contribute a single-digit percentage to the overall portfolio. Investors should also note that NASA does not seek to devote more than 25% of its portfolio to stocks from the emerging markets.
Country Breakdown(Tema ETFs)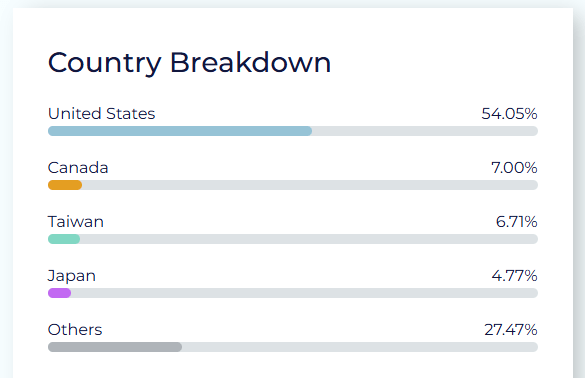

From a market-cap perspective, NASA is not centered around giants or large caps (a little over 20% in aggregate) and tilts more towards mid-caps (36% of the portfolio). NASA’s minimum market-cap threshold of only $100 million also ensures that a pretty meaningful small-cap stake of 27%. Note that the median market cap of this portfolio ($2.1 billion) also suggests that this is more of a small-cap/mid-cap portfolio.
TEMA ETFs
While this is a space portfolio, investors may also be interested in the fact that as far as traditional sector classification is concerned, most of the stocks here are sourced from the industrials sector (37% of the portfolio). Stocks from the technology sector as well have a meaningful weight of over 25%.
Industry Breakdown(Tema ETFs)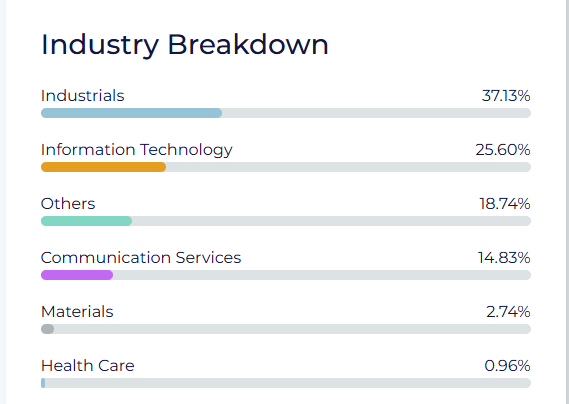

What Are The Risks Associated With NASA ETF?
Unlike portfolios that focus on established industries, NASA focuses on an industry (space) that is still in a developing phase and is dominated by incumbent technologies that have not yet matured and are still seen as largely speculative.
Given that this is an actively managed portfolio and not one that passively tracks an index, NASA’s success is heavily dependent on the intellectual capital and mental dexterity of two individuals. Active portfolio management is also generally more expensive (NASA’s expense ratio of 0.75% is 25 bps pricier than the ETF median) and transaction-heavy, which tends to adversely impact net returns (since this ETF hasn’t completed a year in existence at the time of writing, its annual portfolio turnover ratio is yet to be measured).
Investors who pursue ETF vehicles typically do so because they want some element of diversification in their pursuit of returns. NASA may not be the best representation of diversification, and one could also argue that it could be susceptible to idiosyncratic risks. We say this because, just one stock alone, Space Exploration Technologies Corp. (SPCX), accounts for 27% of the entire portfolio, or almost 3x the stake of the next biggest stock, Rocket Lab Corporation (RKLB), at the time of writing.
Top 10 Holdings(Tema ETFs)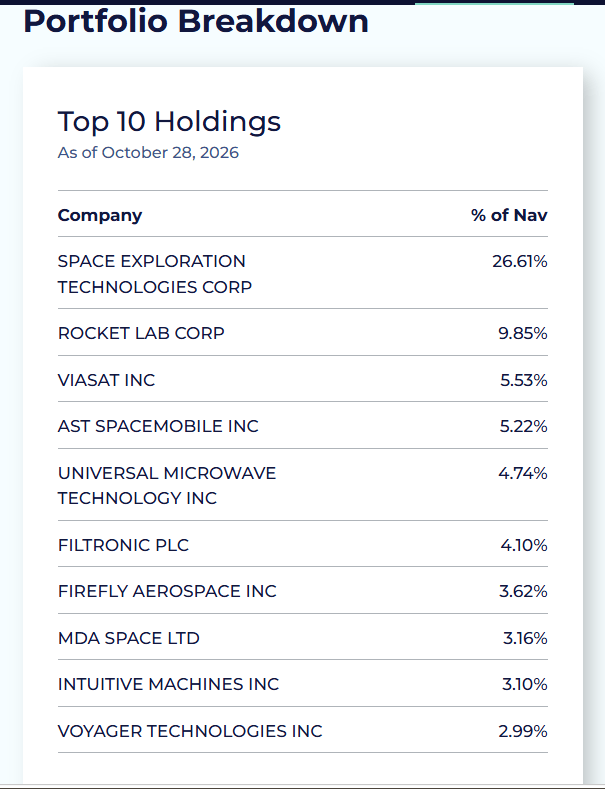

Also consider that SpaceX is not a cheap stock to own right now; on a 1-year forward P/E basis, its multiple works out to 61x. Stocks with high valuation multiples usually generate high expectations from the market, and when those expectations are not met, sell-offs typically tend to be swift and brutal.
SpaceX’s pricey valuations also leave a mark on NASA’s overall valuation quotient and make it come across as an unappealing prospect for value-conscious investors. While these multiples won’t remain stagnant over the years, as of October 2026, NASA is priced at steep earnings and cash flow multiples of 24x and 26x, respectively. In contrast, global stocks are priced at lower corresponding multiples of 16x and 11x, respectively. The wide differential between the cash flow multiples of NASA and global stocks also tells us that this is a portfolio of businesses where cash burn rates are typically higher, with a lower cadence of free cash flow [FCF] generation. Also consider that all of NASA’s current top 4 stocks- SpaceX, Rocket Lab, Viasat Inc. (VSAT), and AST SpaceMobile (ASTS)-are not profitable at the GAAP level. Relatively low implied FCF and lack of profitability make this portfolio come across as an unappealing vehicle for those who emphasise quality.
Recall that 55% of NASA’s portfolio is from the US; the remaining 45%, which is denominated in non-USD terms, could be vulnerable to foreign currency translation risk if the USD appreciates meaningfully.
Who Is NASA For?
NASA is an ideal product for those looking for an actively managed satellite holding that focuses on an ecosystem whose innovations and technological benefits are likely to be increasingly leveraged by various other industries, particularly agriculture, weather management, defense and security, communication, etc., over the next decade.
TEMA ETFs
NASA will also appeal to growth-chasing investors who are on the lookout for an investment theme that is expected to gain meaningful traction over the next decade. For added context, note that the World Economic Forum believes that through 2035, the space economy could grow at a CAGR of 9%, which is double the pace of GDP growth. NASA’s tilt towards mid and small-caps (over giant and large-caps) also make it come across as a product whose holdings have a longer growth runway.
World Economic Forum
NASA also feels suitable for investors who want to profit from an industry that was previously largely government-led (who can otherwise be slow to drive progress with an emphasis on social objectives) but is now increasingly being dominated by private participation and superior commercial momentum.
Given that some of NASA’s key holdings aren’t yet profitable and are also incurring relatively high cash burn and capital expenditures, this product feels preferable for someone who isn’t overly focused on the current fundamentals and is prepared to stay patient and subscribe to a longer-term investment horizon.
NASA’s Peers
ETF investors who want to look beyond the NASA ETF for procuring exposure to the space economy may also take note of two other alternatives.
The first one- the MARS Space & Technology ETF (MARS)—is similar to NASA in that it is also actively managed and is also priced at a similar expense ratio of 0.75%. MARS, which is backed by Roundhill Financial, is also heavily exposed to SpaceX (which is 1 of 30 holdings), although its exposure is 300 bps lower than NASA’s exposure. Unlike NASA, MARS tilts more towards large caps and stocks from the communication sector.
The second alternative, the VanEck Space ETF (WARP), is also more of a large-cap and communication services-based portfolio. Note also that it is very US-centric (84% of total holdings). However, what’s key to note is that WARP is the only passively managed ETF from this lot (it tracks the MarketVector Space Index), and this also makes it come across as the most cost-efficient (an expense ratio that is on par with the ETF median). Even though WARP offers the lowest coverage of space economy stocks (only 22), its exposure to SpaceX is still the lowest (of the three), even if it is the top holding here as well.
Investors should also consider that even though all these products got listed only in 2026, the AUMs of the two alternatives are still a pittance compared to NASA. Also be mindful of the wide bid-ask spreads (8-9x more than NASA), which may generate slippage risks (the risk of buying and selling these products at prices that are meaningfully different from what was initially planned).
Prepared by the writer, sourced from Seeking Alpha and ETF Landing Pages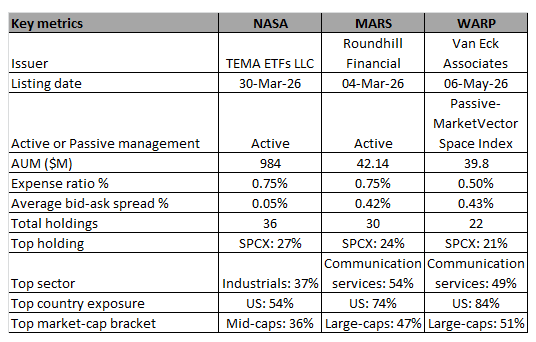

Summary
NASA, which is actively managed by two individuals (with combined investment management experience of 35 years), is a mid and small-cap centric portfolio of innovative stocks from the space economy. NASA is likely to be prone to idiosyncratic risks and may not appeal to value-conscious investors who emphasize quality and sound fundamentals.
This article answers three main questions about NASA:
- What are the key features of NASA’s portfolio?
- What type of investor is NASA suitable for, and what are the risks associated with it?
- What are some of the other active and passive ETFs that focus on the space economy?
Editor’s note: This article is intended to provide a general overview of the ETF for educational purposes only and, unlike other articles on Seeking Alpha, does not offer an investment opinion about the ETF.
