


")


Canada is the tenth largest economy in the world, and of those ten economies, its Per Capita GDP ranks second, marginally in front of Germany. With a Market Cap of USD 3.26 trillion as at the end of 2023, the Toronto Stock Exchange is also considered to be the tenth largest in the world, only marginally behind the London Stock Exchange, which had a Market Cap of USD 3.55 Trillion at that time. However, Canadian investors looking for a diversified portfolio have always faced the issue of concentration risk, as have international investors who have also wished to invest in Canada. In 2000, Northern Telecom was one of the most valuable tech companies in the world, and it represented 35 percent of the TSX’s market cap. Ten years later, it no longer existed. During the first decade of this century, Blackberry invented the smart ‘phone and could have bought and sold Apple every day of the week, twice on Sundays. Now it’s a shadow of its former self. Shopify’s 2,300% return since its listing in 2015 is spectacular, but its current market cap of USD 67 billion is only 40 percent of its peak in 2021. And for decades, Canada’s five largest banks, with a virtual oligopoly, delivered outsized profits and returns for investors. In the Credit Crunch, they remained profitable, and the Canadian banking system was one of the only ones in the world that didn’t require a government bailout. Although Canadian banks continue to perform well operationally, and punch above their weight globally, as investments, they have badly lagged the overall market for the last ten years. Through all of these ups and downs, there have been two constants. Canada’s population has grown faster than those of most advanced economies, especially in recent years when there has been a surge, and, Canadians have to eat.
Graph 1: Population – Annual Rate of Growth – US versus Canada

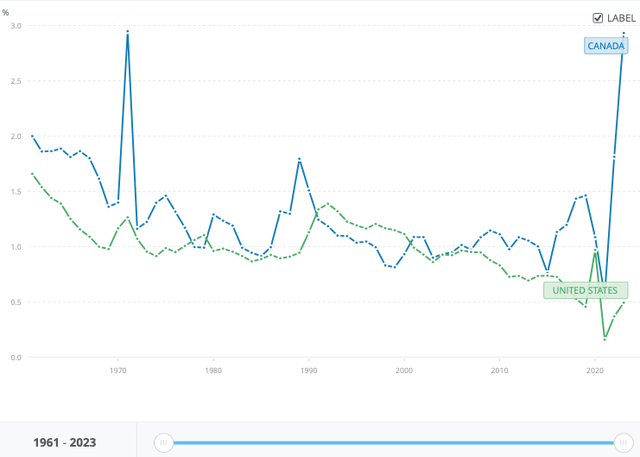
World Bank Open Data
Loblaws (TSX:L:CA) (OTCPK:LBLCF), which has been in existence since 1917, and which can trace its roots back to 1884, is Canada’s largest grocery chain, and it should be a core holding for Canadians and any international investors looking for exposure to Canada. However, it is trading at an all-time high, has substantially outperformed the TSX, and arguably, should have a large minority discount applied to its valuation. I rate it as a Hold.
Discussion of Ownership and Minority Discount
The history of Loblaws is intertwined with the history of the Weston family. In 1884, American born George Weston established a bakery in Toronto, and from that beginning, the family has thrived, as family members regularly show up on lists of the richest people in Ireland, the UK, and Canada.
Loblaws Corporate Structure is as follows. The Garfield Weston Foundation is one of the UK’s largest charitable organizations. It was established in 1958, with a grant of 79.2% of the shares of Wittington Investments, the Weston family’s private holding company. The remaining 20.8% of Wittington continues to be owned by the Weston family. Wittington, either directly or indirectly, owns or controls a number of Canadian and UK companies, primarily in the food or retail sectors. One of these companies is George Weston Limited (WN:CA) which as of December 2020, owned 52.6% of Loblaws. Today, insiders own 53.6% of Loblaws. I haven’t been able to verify how much is owned by senior management, and how much is owned by GWL, but in its annual report, GWL states that it controls Loblaws, and it consolidates Loblaws’ financial results with its own results.
GWL’s second operating segment, apart from Loblaws, is Choice Properties Real Estate Investment Trust (OTC:PPRQF), which, according to GWL’s website, is “Canada’s largest and preeminent diversified REIT.” Choice was formed on July 15, 2013 when Loblaws transferred 426 properties representing 75% of its real estate holdings into a new vehicle for CAD 7 Billion of consideration. Loblaws retained 83.1% of the new entity, and GWL owned 5.6% of Choice’s units. Over the next five years, both GWL’s and Choice’s stakes in Choice were reduced through new capital raises. On November 1, 2018, Loblaws sold its entire 61.8% stake in Choice to GWL.
Charity is a good thing, but shareholders care more about profit maximization and long-term Return on Equity, and these goals are not always aligned with those of a wealthy family that may be more interested in creating a source of stable long term income to support its charitable works. So, the issue of an appropriate Minority Discount has to be considered.
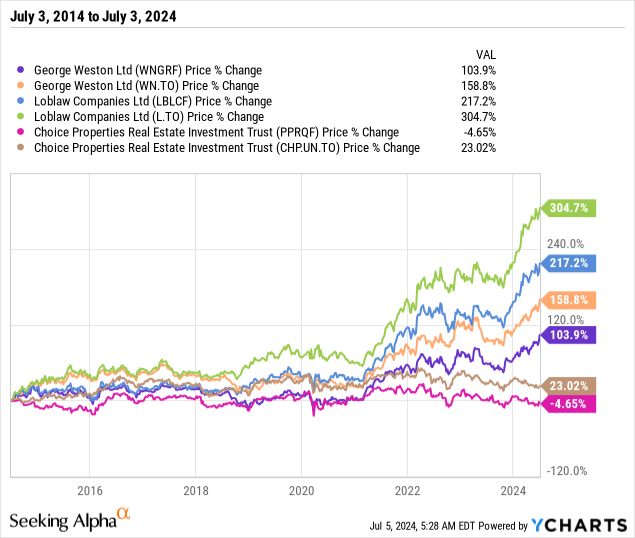
Graphs 2 and 3 show the performance of all three entities’ TSX Listed common shares and / or their ADRs over the past 10 years. Note the negative effect a weak Canadian dollar has had on the returns of the ADRs.
An examination the total Price Changes of Choice REIT, Loblaws, and GWL over a 10-year period allays concerns about profit stripping.
Graph 2: Price Return Loblaws, Choice REIT, and George Weston Ltd.

As does a comparison of the respective 10-year Total Returns. If the Westons are trying to transfer economic value from Loblaws to either Choice REIT or to George Weston Limited, they are doing a poor job of it.
Graph 3: Total Return Loblaws, Choice REIT, and George Weston Ltd.

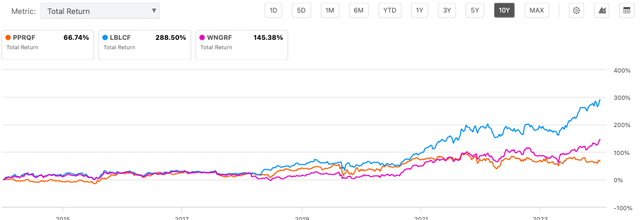
Seeking Alpha
Two other issues of concern with family owned businesses are nepotism and the absentee landlord phenomenon. After a series of poor results and sustained underperformance of its equity, Galen Weston Junior became the President of Loblaws in October 2006, and he also succeeded his father as Chairman of the Board at that time.
Graph 4: Loblaws versus the TSX – October 1, 2001 to October 1, 2006
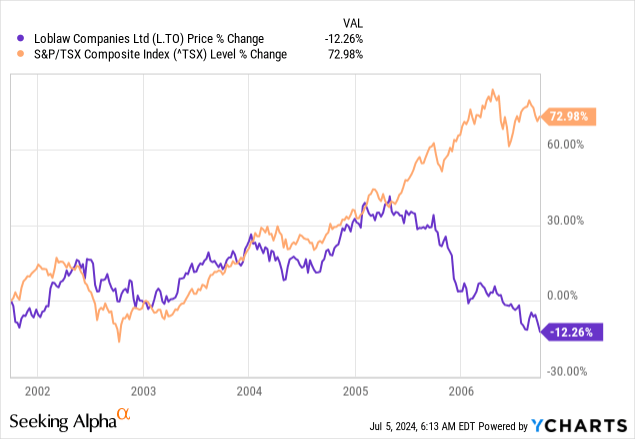
Despite being only 33 years old at the time, he did a good job, and he became the company’s spokesperson.
Graph 5: Loblaws versus the TSX – October 1, 2006 to December 31, 2023
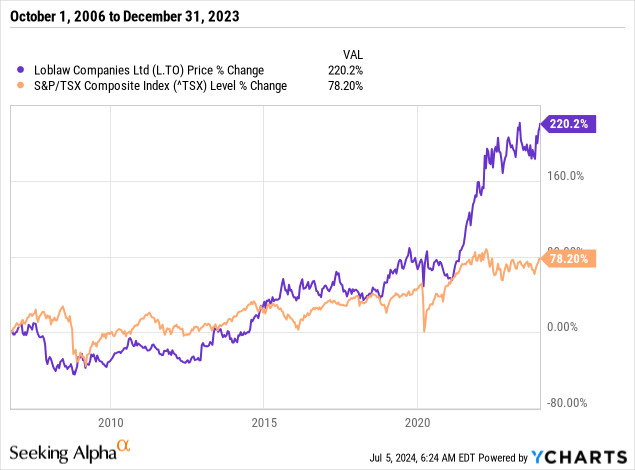
In 2024, Weston retired as the President (he never had the title CEO, though others did) of Loblaws. He remains the Chairman of both Loblaws and of GWL. So far the market appears to be happy with the direction Loblaws’ new President and CEO, Danish retail executive Per Bank, is taking the company in.
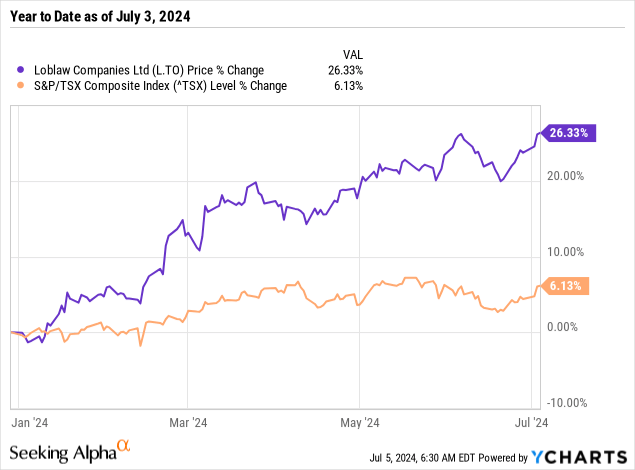
Graph 6: Loblaws versus the TSX – Year to Date as at July 2, 2024
So while I believe that a minority discount is always warranted when there is a controlling shareholder, in this case, I don’t think it needs to be in the standard range of 25 to 40 percent, or even more.
Market Position And Competitive Advantages
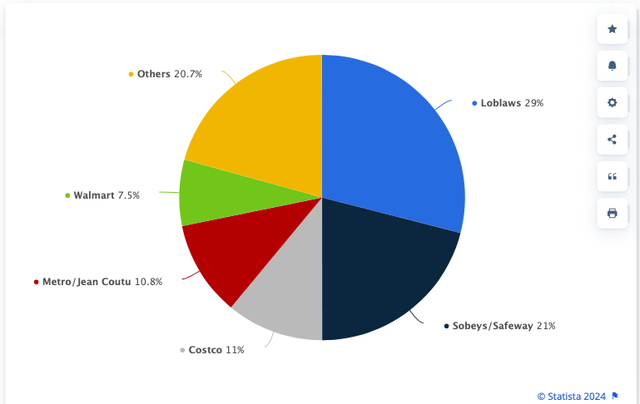
With a 29% Market Share, Loblaws is the largest retailer of groceries in Canada. Canada’s market is extremely concentrated – the five largest retailers have a 79.3% share. The United States provides an interesting comparison, as it is a much more competitive market; its top ten retailers only have a 60% aggregate market share. In 2022, Walmart held the top position in the US, with a market share of 25.2%, followed by Costco (7% market share).
At one time, there were concerns about the entrance of large big box American retailers into the Canadian market, but that has already occurred and been dealt with long ago. Walmart first entered Canada in 1994, and CostCo entered the Canadian market in 1985.
Chart 1: Leading Grocery Retailers In Canada, By Market Share, 2022

Statistica
As well as spinning out its real estate holdings, Loblaws made another transformative move during the past decade. In 2013, Loblaws purchased Shoppers Drug Mart, which at the time was Canada’s largest pharmacy chain and retailer of beauty products. The strategic rationale mentioned at the time was the location of many Shoppers Drug Mart pharmacies.
Canada is much more urbanized than the United States. The Greater Toronto Area, for example, contains approximately 17% of Canada’s population, whereas America’s largest metropolitan area, New York, has only 5.8% of its population. Canada has also experienced a general move from the suburbs (where many of Loblaws stores are located), to the central areas of cities such as Toronto, Montreal and Vancouver. A large proportion of Shoppers Drug Mart’s 2300 stores and 1800 pharmacies are in the centre of Canada’s cities, where the majority of population growth has occurred, and where it is forecast to continue to occur. To date, none of Loblaws’ competitors have been able to duplicate this move.
As well as the favourable location of its stores, the Shoppers Drug Mart purchase has produced two other benefits.
- First, many Shoppers pharmacies are open 24/7, 365 days a year. Loblaws is now able to offer many high margin products through Shopper Drug Mart stores at an increased premium, due to the convenience of being able to buy toilet paper at 3:00 AM, or a prepared meal on Christmas Day.
- Second, Shoppers Drug Mart had one of Canada’s largest loyalty programs. In 2018, it was combined with Loblaws’ own program, and now 16 million Canadians (roughly 40% of the population) pay a subscription of $119 per year for access to PC Optimum. Revenue is not the only benefit of this program. The data Loblaws is able to collect regarding consumer behaviour is invaluable, and, it has helped to drive the growth of PC Financial, as PC Mastercard, and PC Money Account are linked to PC Optimum.
Valuation and Peer Comparisons
Loblaws’ closest competitor is Sobeys / Safeway, which is owned by Empire Company. Empire is a private company, with over 98% of its shares owned by members of the Sobey family, so the only other pure Canadian grocery play that is investible is Metro/Jean Couctu. Metro is a regional player, with 197 of its 328 stores located in its home province of Quebec, and the remainder in Ontario. Given the lack of other Canadian peers, I have also presented data regarding similar companies from other countries in the tables below.
As per Table 1, Costco (COST) has been the best performer over every period considered, followed by Loblaws, although in 2024, it has also underperformed Walmart (WMT) by 9%.
Table 1: Market Cap (USD) and Total Return in USD
| Loblaw Company Limited | Metro Inc. | Costco Wholesale Corporation | Walmart Inc. | Tesco PLC | Marks & Spencer Group plc | |
| Market Cap | $33.6 billion | $12.8 billion | $382.5 billion | $548.9 billion | $26.9 billion | $7.4 billion |
| Return 1 Month | 1.8% | 3.9% | 6.2% | 4.4% | 10.5% | -6.3% |
| Return YTD | 25.2% | 12% | 34.6% | 34.2% | 19.5% | 9.5% |
| Return 1 Year | 34.4% | 3.64% | 68.5% | 34.8% | 38.2% | 55.20% |
| Return 3 Years | 105% | 27% | 132% | 57% | 49% | 79% |
| Return 5 Years | 154% | 66% | 269% | 103% | 70% | 47% |
| Return 10 Year | 293% | 224% | 826% | 237% | 11% | -29% |
At first glance, Loblaws Debt/Equity ratio seems to indicate that it is heavily geared. Closer inspection of other ratios, which are consistent with those of its peers, reveals that this is an anomaly. A large proportion of Loblaws’ paid in capital consists of equity that was purchased by the Weston family in the early and middle parts of the Twentieth Century, so its valuation on the Balance Sheet is artificially low, and the Debt/Equity ratio is artificially inflated. Further evidence that Loblaws’ credit quality is comparable to its peers’ is the fact that S&P Global Ratings raised Loblaws credit rating to BBB+ in May 2024. This compares favourably to S&P’s BBB rating of Metro Inc.
Table 2: Financial Leverage and Credit Quality
| Loblaw Company Limited | Metro Inc. | Costco Wholesale Corporation | Walmart Inc. | Tesco PLC | Marks & Spencer Group plc | |
| Total Debt / Equity | 160.5% | 64.4% | 43.7% | 75.4% | 127.2% | 110.7% |
| Current Ratio | 1.28 | 1.12 | 0.94 | 0.80 | 0.81 | 0.86 |
| Cover Ratio | 5.47 | 8.42 | 51.27 | 10.10 | 3.49 | 10.49 |
| Debt to Free Cash Flow | 6.62 | 13.06 | 8.80 | 21.13 | 43.38 | 10.87 |
With the exception of ROE and ROA, where the two American retailers dominate, Loblaws is at or near the top of its cohort for most operational metrics.
Table 3: Operational Ratios
| Loblaw Company Limited | Metro Inc. | Costco Wholesale Corporation | Walmart Inc. | Tesco PLC | Marks & Spencer Group plc | |
| Gross Profit Margin | 31.84% | 19.65% | 12.50% | 24.50% | 6.84% | 34.19% |
| EBITDA Margin | 8.52% | 8.40% | 4.43% | 6.05% | 5.80% | 8.98% |
| Net Income Margin | 3.56% | 4.64% | 2.83% | 2.88% | 1.74% | 3.31% |
| ROE | 19.53% | 14.55% | 31.64% | 23.46% | 14.77% | 15.43% |
| ROA | 7.46% | 8.04% | 9.77% | 8.12% | 2.60% | 5.18% |
| Revenue 3-Year CAGR | 5.03% | 8.02% | 7.75% | 5.68% | 4.39% | 9.29$ |
| EBITDA 3-Year CAGR | 10.40% | 1.36% | 11.60% | 0.08% | 12.55% | 33.97% |
| EPS Diluted 3-Year CAGR | 26.70% | 9.12% | 14.88% | 17.40% | -40.37% | N/A |
I was unable to find a good survey of analysts’ forecasts for all six companies across all metrics, so Table 4 is a mixture of backward looking historic comparisons, and forward looking future comparisons. When one considers Loblaws P/E Ratio using the Trailing Twelve Months (TTM), Loblaws looks expensive. But when when forward looking ratios, like EV to EBITDA and Sales, are considered, Loblaws’ valuation looks more reasonable.
Table 4: Valuation Ratios
| Loblaw Company Limited | Metro Inc. | Costco Wholesale Corporation | Walmart Inc. | Tesco PLC | Marks & Spencer Group plc | |
| P/E (TTM) | 24.14 | 18.03 | 53.48 | 29.29 | 12.63 | 14.02 |
| Price / Book (TTM) | 4.55 | 2.54 | 17.57 | 6.76 | 1.85 | 2.10 |
| Price / Sales (TTM) | 5.47 | 8.42 | 51.27 | 10.10 | 3.49 | 10.49 |
| EV / Sales (FWD) | 1.08 | 1.04 | 1.49 | 0.91 | 0.45 | 0.59 |
| EV / EBITDA (FWD) | 9.45 | 11.08 | 33.37 | 14.57 | 6.77 | 5.57 |
Conclusion
Loblaws should be a core holding for any investor putting money to work in Canada. It has a long history, brand equity, a 29% market share, and a number of competitive advantages that can’t be replicated. Currently, its equity looks fairly valued, perhaps even cheap, if one does not believe a minority discount should be applied to its valuation, as I do. However, the Weston family has acted in the interests of shareholders as a whole, and it has not tried to disadvantage them as a class. So, reasonable people can disagree on how large of a discount, if any, should be applied.
Although Canada’s population will likely continue to grow faster than other countries’ populations will, meaning that Loblaws’ sales will grow faster than other retailers confined to a single country, it is hard to see how Loblaws will grow faster than the overall Canadian market.
Given that is has outperformed the TSX by a multiple of three over the past ten years, and that its shares are at an all time high, investors should wait for a pull back in Loblaws’ shares, or for the overall market to catch up to it, before committing new money to Loblaws. But given its unique position in the Canadian retail landscape, and its various competitive advantages, Loblaws is not a sale.
I rate Loblaws as a HOLD.
Editor’s Note: This article discusses one or more securities that do not trade on a major U.S. exchange. Please be aware of the risks associated with these stocks.


")

