


Prefatory Note 1: The Market Many in Service of the Long-Term-Investor Few – It’s a Real Thing
Almost no thing in the financial markets is permanent—even permanence defined as only a few years. A thing like the popularity of an industry sector or investing style. A great exception is the behavior of crowds, the predictability of which is immortal beyond any lifetime. It is a force that makes mountains, that begot the mass preoccupations with—pick an interlude—biotech (the mid-80s and again in the early 2000’s); growth conglomerates (1960’s); small-cap stocks; Under construction – Awesome site in the making! tech; today’s AI-IT phenomenon; REITs (2000-2008); junk bond investing (1980s and the GFC), the energy sector (1998-2002 and again from 2007 onwards), gold (late 70’s to early 80’s )…. Surely, no need to go on.
These all failed after their moment in the sun, despite lavish assistance from: the confirmation bias of rising prices; the fear of missing out; the imperative to not underperform; and every other cognitive impetus to join, like the affirmation of Wall Street research growth projections.
Source: Factset, Bloomberg, Morningstar, Chicago Booth Center for Research in Security Prices (Conglomerate)
At the end of the day, the “market” is just a crowd milling about in a marketplace, each constituent acting with a different analysis, expectations and vested interests, all of them moving money. This goes on every day and is usually fairly random.
Once in a while, though, some plurality of buying interest begins to push money in one particular direction. Like water, it takes on an increasingly organized flow, and elements of the crowd begin to notice and add to the flow. Eventually, the professional monetizers of these flows add their self-reinforcing influence. But it can’t last.
What is a permanent feature of bubble behavior is the collateral effects. There’s only so much capital available at any given time, so when money moves en masse to a greener pasture, there must be capital outflows from other sectors, eventually creating a deficit. These valuation discounts are inadvertently created by the crowd itself. If it can move mountains, it can create the abyss at mountain’s edge.
Train Riders Don’t Look Back


Importantly, those discounts—often as dramatic in their way as the related bubble—are not a function of fundamental attributes or analysis. The crowd isn’t aware of these opportunities they create—because they’re what it left behind in their tracks, and that train has no rear-view mirror.
One set of past abandonment discounts is still benefiting our portfolios today. For a decade, from about 2011-2014 onward, there was negative market interest in the gold sector, or copper, iron ore, oil or other important inflation-beneficiary hard commodities. Their index weightings fell toward or to historical lows.
The early 2010s was the then-historical peak for most hard commodities. They’d been the targets of excessive capital inflows to expand tangible reserves and output, largely to supply rapid economic expansion in “ BRICS ” countries, a term coined by Goldman Sachs in reference to Brazil, Russia, India and most notably China. That drew in the stock market capital flows to expand financial asset values. Lots of stocks doubled and tripled. Then, Chinese growth slowed and most of those same stocks declined by 50% to 90%, effacing the prior gains.
Source: FactSet. Composites are based on an equal weighted portfolio with the below constituents, rebalanced monthly.
Investors didn’t look back; the fund flows from those sectors were redirected to indexed investing, particularly to the IT sector.
There was a good reason indexation was the choice and had already become the predominant mode of investing. An awful lot of investors were truly jarred, some ruined, by the collapse of the Internet Bubble between mid-2000 and 2003. With the distance of time, it might seem less dramatic; one could say the dot.com stocks went up for two or three years, then they went down for two or three years. Even Steven, as the idiom goes.
But, it’s one thing to say that the surviving companies ended up just where they started. It’s another to know that most investor money bought in near the top, not the bottom or middle. And to know that Cisco Systems (CSCO), the networking company, celebrated a 41 st anniversary last year, and Intel (INTC) did the same last week. They were two of The Four Horsemen of Nasdaq—the Dot.com Bubble’s version of the S&P 500’s Mag 7. The occasion for the anniversary celebration: Cisco finally reattained its peak price of March 2000. From 1994 onward, the share price rose by 420+%, to a $550 billion market cap. It then collapsed by 86%. Apple (AAPL), which peaked at a $20.7 billion market cap, lost 80% of that value. Even Microsoft (MSFT), the bluest chip of all, lost 60% of its peak price after rising 9-fold in just five years. Lost to memory are a raft of formerly household names that fared far worse.
Financial losses aside, there was cognitive shock. People who’d believed in these companies’ profitability and Wall Street growth projections found their beliefs and understanding were wrong. Even professional investors now feared individual stock selection. You could be right on the sector, but wrong on the company. The newly deregulated utility sector, with Enron and its disastrous finale as its apotheosis, was also part of that bubble.
Source: Factset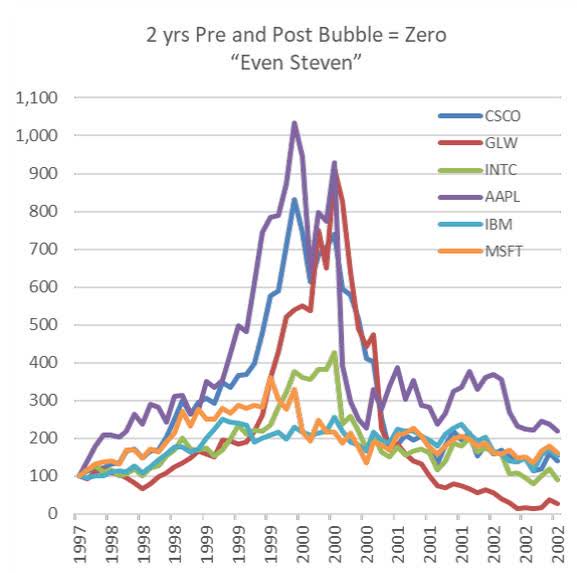

Indexation was an antidote to selection error. It could effortlessly diversify across an entire sector or the entire market. And ETFs were a better mousetrap: unlike mutual funds, they could be traded mid-day like stocks, cheaper and with no sales commissions.
It was a right-place-right-time moment for the iShares family of ETFs, which had been introduced only a few years earlier in mid-2000. Money began leaking, then pouring out of actively managed mutual funds and right into indexed ETFs. Some $5 trillion of AUM is now amassed in the various iShares ETFs.
The collapse of commodity prices in the post-China-growth period was one of those madness-of-crowds-made opportunities if you could figure out how to make use of it. The recovery was oh so predictable: the excess production capacity of those commodities would eventually be shed by the producers, and supply would come into equilibrium with demographically inexorable rising global demand. There are volumes of repetitive Quarterly Commentaries and Compendium research about it.
The problem was the waiting. The supply/demand balance could not be restored in a year or two; the reward would be a half-decade or decade in the future. Way, way beyond the operating time horizon of most investors. You had to be willing to bide your time in a rejected, deeply discounted industry sector. That was one challenge.
The other challenge was the same one that the bubble investors gave up on when they defaulted to indexes: how to select the right companies? Yes, the capital-intensive miners and drillers traded at deep discounts to a normalized valuation level; the crowd had tossed them aside. But that didn’t mean they would be good investments. As operating businesses, it was easily envisioned that the index-representative energy and mining companies would not be very profitable over a full business cycle. In the end, they weren’t. Because they are “normal” business models, which pair lots of operating baggage—lots of fixed assets and equipment, and lots of employee compensation and capital expenditure—with cyclical demand and even more volatile profits. With all that baggage to carry, they cannot compound their long-term financial value at a high level.
One can then properly appreciate the rarity of a business that persistently sustains high profitability and financial compounding. That anomaly must be a property of its business structure—otherwise, it could not persist; because managements change, economies change…and so on. That’s the challenge, to find a business like that. So you can practice value-added waiting.
If you’ve got a Horizon Kinetics equity portfolio, then you likely know that these were the asset-light royalty companies that simply take a cut of their customers’ revenue without having to do any heavy lifting—literally— themselves. They just put up cash in exchange for a share of the eventual expense-free revenues. In a business like that, you could be positively exposed to and await the eventual commodity demand and pricing recovery, no matter how long the wait. With a constantly profitable and compounding business, time is a friend, not the enemy. Fortunately, because we wish to continue buying, royalty companies are neither a mainstream nor indexed asset class. Not being an object of crowd attention, they are typically undervalued.
It was not until last year that the cyclical reversal in commodities began. It was first visible in gold and silver, copper, and fertilizer. In our royalties holdings, it’s visible in, among others, Wheaton Precious Metals (WPM) (silver and gold), Texas Pacific Land Corp. (TPL) (oil, natural gas, and much more), and Altius Minerals (ATUSF) (copper, fertilizer and electricity, among others).
The salient points are that:
- – Meaningful valuation opportunities don’t exist as a norm. They are made episodically or cyclically by others—the market.
- – There is a business structure element to the anomalously high, persistent profitability of royalty companies, securities exchanges and other asset-light businesses.
- – And there is a market structure or preference element to both episodically and to persistently undervalued companies and securities (like a non-conventional business model, the absence of institutional research, and zero or near-zero index weightings).
Income investing is no exception to this phenomenon, because income investors have their own biases, limitations, and behavioral reflexes. I mention this, because we’ve been fielding more calls from clients inquiring about income strategies. And there’s a reason for their renewed interest.
Prefatory Note 2: Crowd Behavior & Market Structure Biases Also Create Income Opportunities
The lost decade for income investors started in 2008, during the Great Financial Crisis, when the Federal Reserve began its zero-interest rate policy. To avoid having negative yields, money market fund managers had to waive their fees. September 2008 was the last time, until relatively recently, that a 1- or 2-year Treasury paid as much as 2%.
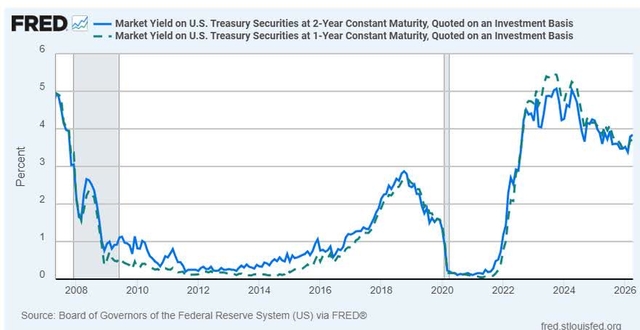

This period lasted 14 years, long enough for existing normal-coupon bonds of the 5% and 6% variety to eventually be called or mature. For over 60% of those 3,455 trading days until July 2022, the 1-year Treasury yielded less than 0.5%. The 2-year Treasury wasn’t much better.
This slow erosion wasn’t flashy like the collapse of the IT bubble, but it might have been more damaging. Someone with a million-dollar fixed income portfolio might have relied upon the $60,000 annual income that had been acquired in the prior decade or two of more normal yields. They could have seen that income shrink by half, two thirds, three-quarters. Here at Horizon Kinetics, we dubbed it The Great Yield Famine, though the appellation didn’t take elsewhere.
A lot of those maturing bond proceeds and money-fund balances shifted to the stock market. Odd as that seems, there was a rationale. The S&P 500 dividend yield was more than twice as high as short-maturity Treasuries and comparable to 10-year Notes. Much of that money probably didn’t want to be in stocks, so to speak, but people faced with a devastating decline in their investment income might default to the stock market if it helped pay the rent.
The stock market yield advantage eventually faded away, too. The S&P 500 dividend yield, which had been 3%, then 2% for much of that time, has been declining throughout the near-one-decade build-up of the IT bubble. The S&P 500 now yields 1.1%. ¹ It last got this low during the Internet Bubble.
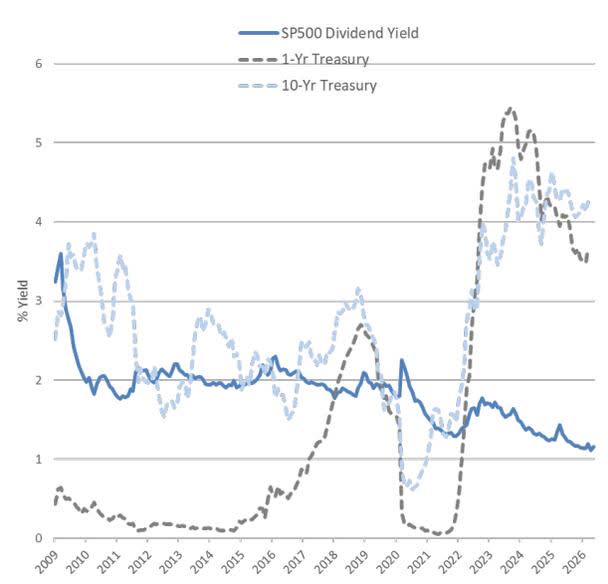

Which is why it’s not surprising that with 5- and 10-year Treasuries now at and above 4%, more than a few clients have been inquiring about different or better ways to get more income. There are.
The best ways, though, can’t be the crowd’s way. If you think about it, how can it be? The bond indexes are designed to faithfully represent the market yields of each sector. So how can you get enough of a yield premium or price discount to make a difference? It’s impossible inside the index structure.
Some Different Means and Methods of Income Investing

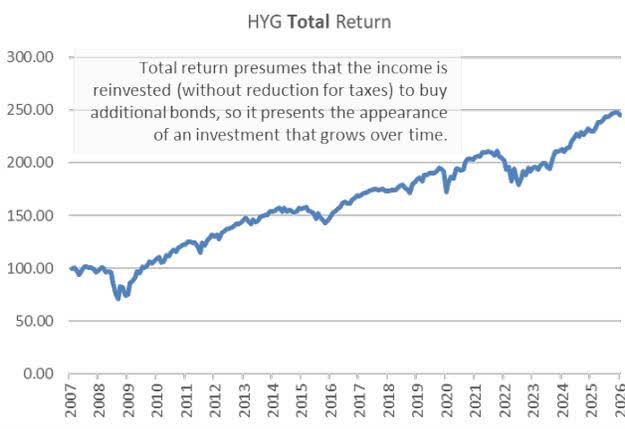
The essential deficit of bonds is the unprotected exposure to inflationary value erosion. If the income is spent and not reinvested, the owner doesn’t get the “total return” by which the institutional investment world benchmarks its results. Total return presumes that the income is reinvested (without reduction for taxes) to buy additional bonds, so it presents the appearance of an investment that grows over time. No one who spends that income, though, gets anything like total return; they get something quite different. If the income is consumed, the ostensible total return is re-defined by a bifurcated set of figures: how the principal behaves over time; and how the income stream behaves over time.
- For the principal, buy a $100,000 lot of 5-year bonds, and that’s what it will be worth at maturity, though you might have paid more or less than that. Since it can’t appreciate, in purchasing power terms it must be a wasting asset. At least so long as prices increase and/or the money supply expands faster than the economy. Your fixed amount of capital becomes an ever-smaller proportion of the total money in the economy.
- Then there’s the starting coupon or income level, which doesn’t increase either, unless the bond has an adjustable rate coupon. Even if adjustable, the coupon is ultimately anchored to the face amount of principal. It can wax and wane with the interest rate cycle, but there’ll be no serial increase in the way that dividends from a growing company can increase, just variation around some average cost of money. The income stream, too, buys an ever-smaller proportion of rent or other goods and services.
It is in recognition of this unfortunate reality that our version of income investing differs from common practice. Our formative professional years were centered on individual clients and families, subject to taxes, most of whom did not reinvest all their income. Our version—eccentric or even taboo in the institutional investment world—is to not invest unless or until there is a sufficiently obvious advantage that could confer some counter-inflationary principal increase or income increase.
There are many forms of inflation-hedged or purchasing-power-centered income investing.
Event-Based Opportunities (in the Public Markets)
One type is an opportune moment of severe mispricing. It might be in a particular industry sector or a type of security. Discounts like this can pay off for many, many years. For the briefest sampling of the variety of possibilities, here are two close-to-home examples.
Cheniere Energy (LNG) , a low-yielding stock (0.9%), is familiar to many clients, because it has become a large equity position in some strategies. Many might not recall that it was originally bought as a Convertible Note in early 2016. With a 4.25% coupon, it was priced at roughly 53% of face value, so the current yield was 8%. Ultimately, there would also be almost 2% annual principal accretion to the 100% face value, so there you had the 10% long-term stock market return benchmark in hand, but with the protections of a bond.
The Notes were discounted for a reason. Cheniere’s credit rating was a steep couple of steps below investment grade. That was about to start changing because a few months before we purchased them, the company completed the infrastructure to begin making and exporting liquid natural gas. It was the only company with completed facilities and the only one with Dept. of Energy authorization to export LNG. It was thus about to start generating the substantial revenues from 20-year, assured-margin “take or pay” supply contracts necessary to repay its excessive debt. The balance sheet repair had yet to start and wouldn’t be complete for many years, so the credit rating agencies could not upgrade Cheniere for a long time.
Plus, rather little of the enormous amounts of money in indexed bond funds can, by policy, go into a single-B credit.
A few years later the underlying shares had appreciated enough that the Notes were converted into the common stock that HK clients own today. The company is still receiving credit rating upgrades. Yet, even without the equity convertibility feature, the Notes would have served the intended purpose: the built-in modicum of principal accretion matched the era’s inflation rate.
Hawaiian Electric Industries (HE) , also a familiar holding in our portfolios, is an example of opportunistic income investing but that is not obvious, since the company doesn’t pay a dividend. It won’t show up in a yield-sorted database or income fund. That’s only because it is still early in its recovery phase from the Maui fire disaster of 2023 and the monetary liability it has to pay, so the company has yet to reinstate the dividend. But its recovery—the future credit upgrades and earnings—is even more predictable (certainly directionally, if not precisely) than Cheniere’s was, because Hawaiian Electric is a regulated utility. Its ultimate dividend yield—on our cost—will be well into the double digits. It only requires patience.
Persistent Market Structure Discounts in Publicly Traded Securities
Another class of inflation-hedged income investing is in sectors or securities that exhibit persistent discounts because of artificial market segmentation or constraints—meaning that the higher yield doesn’t reflect fundamental risks like debt leverage or mismanagement but, rather, self-imposed investor policy limitations or preferences.
One example is royalty trusts that distribute all their royalty income rather than reinvest them. They are not generally eligible for or on the radar of institutional and index-based investors because they are usually smaller cap, certainly non-standard securities, albeit debt-free and extraordinarily high margin.
Another example is publicly traded limited partnerships, which can provide diversification across the financial, energy, and natural gas pipeline sectors, among others. Yes, agreed: K-1 income is an irritant. So much so, and to so many, that their prices decidedly reflect that active disdain. One can now find 7% and 8% yields in highly profitable and stable companies, with every reason to expect at least inflation-level book value and income growth above that yield. That solves the bond wasting-asset challenge, with the likelihood of achieving or surpassing the equity 10% return challenge. If one is truly allergic to K-1s ² , there is even an ETF of pipeline LPs (AMLP – Alerian MLP ETF (AMLP)) that doesn’t issue a K-1, because you only own shares of the ETF itself, not a look-through link to its holdings.
That ETF, though, does not contain worthwhile investments in other sectors, such as this last and elegant example of an inflation-hedged income security that can be employed within an ordinary investment advisory account for some portion of their equity allocation:
Take the standard mix of large-cap growth, mid-cap value, global equity, emerging markets, ETFs and so forth. That won’t pay as much as a 2% dividend yield. Someone who desires to rebuild their income stream could redeploy some of that ETF portfolio into just one security which, paradoxically, is far more diversified and yields 8%.
In addition, this security also includes exposure to varied classes of fixed income, real estate and other alternatives, and a spread of both passive and actively managed products.
That security is Alliance Bernstein LP (AB) , the well regarded asset manager. But rather than paying management fees to an ETF manager, as a part owner of Alliance Bernstein, you would be a fee collector for your pro-rata portion of the fees Alliance Bernstein earns. Including performance fees on many of the alternative asset funds. Just a modicum of asset growth over time, 2% or 3%, is a low hurdle to get to a total return of 10%.
This equity is too cheap because it issues a Schedule K-1. Also, the dividend is not fixed; it varies with operating results, which is another undesirable feature for many investors. A long-term holder is in the enviable position of pocketing—as a quarterly cash distribution—the high discount rate resulting from other parties’ K-1 avoidance choices.
There are limitations to this form of investing. It usually can’t be fully deployed rapidly, but will be populated over time as opportunities arise. Many of these securities lack the important contractual rights of bonds to enforce payment of income and principal.
There are more readily investable income strategies that aren’t limited to episodic entry points, yet most of our clients are unaware of them because unlike Cheniere or Hawaiian Electric, they can’t be implemented within individual accounts. Unless we broadly advertised them, which is not something we’ve done, you wouldn’t know about them. For reasons that will be plain shortly, they can only be deployed in a fund format, where focused attention and scale are advantageous or even required.
Persistent Market Structure Discounts—Private Investments
Here are three examples of private market income investing. The last will be highlighted at greater length, because it falls squarely in the more familiar bond investing universe: it has an explicit investment grade credit rating, a fund-based portfolio structure, and regular, assured above-market interest income, yet unlike conventional bonds is protected from upward moves in interest rates.
- Our first private real estate fund is the first example of a market-structure based discount. The fund had its 10-year anniversary this past November. It produced just over a 10% annualized return for the decade, with an average annual distribution of over 7%. In 2025, the total return was over 14%, of which income was just over 9%. The persistent advantage in this case is the interest rate premium that a time sensitive borrower is often willing to pay. This price-insensitivity arises when the time frame to close—or lose—a deal is shorter than the ponderous review and approval process of a conventional lender. Or the time frame for repayment is shorter than the lender finds worthwhile. Or both. That’s an age old mismatch, which puts the bargaining power with a niche lender/investor who can solve the time risk, like our fund. There can be any number of reasons why a developer needs a short-term loan in a hurry. It could be an $800,000 first-mortgage bridge loan for three months to acquire a commercial property. Or a two-year, $3 million construction loan for a residential mixed-use redevelopment project. Our interest rate might be well above market, but from the borrower’s perspective—aside from being necessary—it’s for a limited duration. That is, the rate is high, but in the context of the project, the cumulative dollar cost is modest. These loans will typically be secured by a first or second position mortgage, pledge of shares, preferred equity and/or personal guarantee of the borrower’s principal. The investments are only in properties we would otherwise own. The active day-to-day manager of the fund is a highly qualified gentleman by the name of Sholom Jacobs.
- A private royalty and mineral rights fund is example number two. It got brief mention in our 2026 Founders’ Letter ³ and should begin making tax-advantaged and growing income distributions later this year. The description will seem at first like a more-of-the-same exposure as a Horizon Kinetics account might already have, albeit with one of the most successful such investment teams in the country, with whom we’ve had a long and close relationship. But there’s a world of difference, and it resides in the term “private.” In contrast to the heavily saturated private market for leveraged buyouts, direct lending and real estate, the private market for various niche real assets remains largely inefficient with respect to information and pricing. It’s possible for an informed buyer to have exclusive knowledge of an intriguing property, one that is not on a database, with no investment bankers marketing it, thatis not even practicable for any but a strategic, highly knowledgeable and capable operator. It will change hands at the kind of low clearing prices that can’t be replicated in the public market. Much will be explained by two investments the fund has made.
- The initial anchor investment in this Horizon Kinetics fund is a Permian Basin oil-focused royalty partnership with an existing and attractive asset portfolio. In late 2024, this partnership made a very significant acquisition: a block of over 7,000 net royalty acres in the Delaware Basin available for over $200 million, and developed through a dial-the-phone type of lead. A family wished to close on a sale of the entire property on an exceedingly short time frame: 30 days, with a 10% deposit at signing. The management team was able to coordinate this with a large publicly traded minerals company and secure a nearly 50% interest for itself. About half the assets are in proven-undeveloped reserves. Given the permitting activity since then, the operators/royalty payors will have wells coming on line late this year. Being largely undeveloped, this property has optionality to deliver increasing production and cash flow for a very long time. Another recent acquisition is an 11,000-acre natural gas royalty position within the rapidly growing Haynesville Basin on the Texas-Louisiana border. There are almost no pure natural gas producers or royalty companies in the public sphere, the majority of extraction companies focusing on more valuable oil assets, while there are dedicated natural gas producers. Gas prices are inherently volatile by virtue of the difficulty to move it, whether by pipeline or LNG carrier, after an expensive liquefaction process. This makes it difficult for producers to effectively hedge their production between delivery points, even within the same state: Separate from localized weather-pattern-influenced demand volatility, there can be vast differences in localized supply, irrespective of the ordinary influence of price. This is because an increasing amount of U.S. gas is produced as an associated byproduct (that is, involuntarily) during oil drilling, often in locales with insufficient take-away capacity. Due to all of these anomalies unique to the natural gas market, despite its otherwise being a standard commodity, much long-term optionality inheres in pure natural gas production, which is greatly underpriced relative to oil. It is still in oversupply, yet is experiencing burgeoning demand both from AI datacenter electric power needs and LNG export growth. At some point demand and supply come into balance. The majority of the mineral rights was purchased when natural gas prices were $1.80 to $2.50/mcf ⁴ . Translated through the discounted acquisition price, though, the fund paid about $1.00/mcf for these reserves. At current natural gas prices, which are more than two and a half times that level, the rate of return on that investment could be in the 20% range, even unlevered. But there is active value enhancing management after the purchase, too. One of the most effective ways to create value in minerals is by acquiring acreage “ahead of the drill bit”—before development and production begin. Executing this strategy requires strong relationships, deep experience, forward-looking insight, and, at times, a measure of luck. The partnership’s typical strategy—which favors a lower going-in price and a larger follow-on production growth experience—is to acquire portfolios that are, say, 90% undeveloped and 10% already producing. Over the last 12 months, an additional 10% of this natural gas portfolio has transitioned into production, bringing total producing assets to 20%. Activity on the acreage has accelerated significantly since purchase. In the past month, the number of active rigs increased from six to fourteen. More than 30% of all rigs in the Haynesville Basin are now operating on this 11,000-acre property—an impressive concentration given that the Haynesville spans roughly 5.7 million acres. Those transactions reveal the vast differences in range of opportunity, clearing prices, yield, and income growth that private market investing can manifest—a good couple of floors beneath the concourse level— I envision the main hall of Grand Central Station— of the public markets.
- Our CLO strategy, example number three, is the focus of this Commentary. CLO is the acronym for Collateralized Loan Obligations. Before you make a judgment, if you have a vague notion about what CLOs are, this strategy probably looks and acts very differently than you think.
![]()

As an aside , I should mention that it was back in March that a kick-off discussion was had about the direction this Commentary would take. Specifically, the challenge of income generation, including highlighting our CLO approach. (Different funds can be reviewed in the future, if there’s interest in it, play on words not initially intended.)
Later that month, while having dinner with Murray, I mentioned that I needed to get started on preparing the next Quarterly Commentary. He asked why, wasn’t that a ways off? I replied that I require some number of weeks to write the thing. Whereupon he lowered his chin to look at me over his glasses.
That look was a reminder of another of Murray’s remarkable faculties: he wrote in a continuous flow in one-pass drafts with rare cross-outs or re-writes. It greatly impressed even the impressive Jim Grant, the uber-veteran journalist, economics scholar, and author. In fact, we are touched and appreciative that Jim honored Murray by devoting the first two-plus pages to him in last week’s Grant’s Interest Rate Observer ⁵ , one of the few subscriptions Murray maintained.
As to writing, I’m a slow-poke, but we had complementary skills that served us well. At Bankers Trust, despite not being in the same department, Murray and I found ourselves working together on newinvestment strategies that no one asked us for in the first place. And in the second place, when the powers that be did find out, they weren’t so thrilled at our crossing-the-lane-markers initiative. We did ultimately persuade them of the benefits of two of the strategies we presented, which eventually became in-house mutual funds to serve the particular economics of trust accounts. Would you be surprised to learn that they were inflation-hedged bond substitute funds?
Back to the writing issue, here is a visual demonstration, from the archives, of the foregoing anecdote: a side-by-side comparison of the first page of research reports that Murray and I had written about 20 years ago. One of them, coincidentally, had to do with non-standard income generation. One of those pages has no editing adjustments whatever; the other, well…


If it seems odd that we composed with pen on paper, not with fingers on keyboards, it wasn’t just out of habit. Murray had convinced me that composing on a computer was both distracting (all the neat things you could do instead of writing, like formatting the font and adjusting the margins) and, more importantly, too easy. You can cut and paste and rearrange at will, so you needn’t arrange your thoughts in advance. Having once earned my living by typing term papers, I could produce a stream of words and sentences well before I knew what I was going to say. So, I took Murray’s approach and endeavored to make it harder to compose, to raise the cost of writing before thinking, by writing with pen. Ball point pens suffered from the same problem, though—it was still too easy. Eventually, I settled on fountain pens—that really slows you down.
![]()
Back to the focus of this Commentary: CLOs. A person only passingly familiar with the term or who recalls a past article about it is unlikely to know what they really are and how well they can be used to your advantage. They can be used advantageously because CLOs are likewise subject to persistent market structure and policy choices that other investors make. It requires learning a few definitions, but it is intriguing once you see what it does and how it works.
A nutshell version of it: the CLO structure allows one to own a diversified portfolio of floating-rate first lien corporate loans. The CLO raises different tranches of capital for these purchases in a manner that further enhances the credit quality available to someone who, say, wants only AAA and AA credit exposure, while allowing other investors who prefer a higher yield the ability to invest in a lower-rated CLO tranche such as A, BBB, BB or B. As a class, the AAA and AA tranches have never experienced a default. Today, at a roughly 1.25% and 1.60% higher yield than three-month Treasury Bills, respectively, the AAA tranche would have a coupon rate of about 4.90% and the AA tranche would have a 5.25% coupon. With coupons that reset every three months, a CLO is protected from the price risk that bonds suffer in a rising interest rate environment.
Before delving into the mechanics of CLOs, it is important to understand the incentives system: the borrower (who needs capital), the active CLO managers (who securitize, that is bundle and tranche out the underlying loans), and the investors (capital provider).
Borrowers are publicly or privately-owned companies with non-investment grade ratings, and these loans are part of what is referred to as the leveraged loan market, which in aggregate is currently about $1.4 trillion in size. These companies are cash flow positive, and CLOs will typically purchase their first-lien, floating-rate debt, which provides a meaningful first line of protection. These secured senior loans typically have a credit spread of between 2.5% to 4.0% above the short-term funding rates, depending on creditworthiness. Over the past 25 years, the average annual default rate for first lien loans was approximately 2.7%.
Enter the CLO active managers, who in the mid-1990s saw a business opportunity to package these loans into a diversified portfolio, typically 200 to 350 positions across 20 to 30 industries. In portfolio form, the loans could be grouped together into one CLO structure. The CLO could then finance these purchases by issuing different rated debt tranches and an equity tranche so as to create features that appeal to investors with differing credit quality and yield preferences.
An important mechanism for accomplishing this was establishing contractual cash flow covenants that would apply different cash flow priorities to different CLO tranches as well as different amounts of over collateralization to each CLO tranche. In this way, even though the CLO investment portfolio had a weighted average of debt rating of B, an AAA CLO credit tranche could be created, along with lesser rated CLO debt tranches ranging down to B, and below the CLO debt tranches an equity tranche. In return for actively managing these CLO portfolios, the managers would earn ongoing fees. Given the scalability of a CLO platform for these managers and the ability to refinance existing CLOs, the prospect of managing long-term assets and growing AUM was quite attractive.
As to investors in these CLO tranches, they could earn a yield premium over short-term rates ranging from about 1.25% (AAA), up to 6.0% (BB). Currently, the AAA and AA tranches offer coupons that are comparable to 5-year corporate bonds of similar credit ratings, yet, because of the floating-rate coupons, without the associated price risk. The U.S. CLO market is now at about $1.0 trillion and is an important source of capital for the growing leveraged loan market, representing about 70% of its investor base.
There are additional safeguards embedded in the CLO structure that are reflected in the CLO tranche ratings. These include principal over-collateralization (again, higher for the AAA and AA tranches than the other tranches) and interest coverage tests likewise favoring the AAA and AA tranches. The AAA and AA tranches are over collateralized and together account for up to 75% of a typical CLO capital structure. Any CLO losses are incurred in reverse credit rating order, with the equity layer absorbing such losses first, followed by the lowest-rated junior debt tranches and so on, if the losses exceed the equity outstanding. There are other safeguards, as well.
One such safeguard is that if interest or over collateralization coverage ratios fail, a ‘self-curing’ mechanism contractually dictates the diversion of cash flows from the equity tranche (and junior debt tranches, if needed) to the senior debt tranche in ratings order, specifically the AAA followed by the AA and so on.
Since their establishment in the 1990’s, no U.S. AAA CLO debt tranche has defaulted. For the AA tranche, there was one technical default ⁶ that resulted in no loss of principal or interest due. Collateral aside, CLOs are actively managed and subject to their indenture’s covenant terms, which in addition to interest and over collateralization provisions, include ongoing concentration limits and collateral quality test requirements. The CLO is also overseen by an independent trustee who monitors ongoing compliance. Due to the role of the CLO manager and these additional indenture safeguards, CLO debt tranches have had default rates that have historically been lower than similarly rated corporate debt.
Another differentiating feature is that CLOs are structured as cash-flow-based, not market value based, investments. Accordingly, CLO managers can generally continue to carry their investments at face value during periods of market volatility, which helps avoid the forced liquidation of assets that might accompany daily market pricing.
CLOs are another example of a persistent market structure anomaly. Because they are only quasi-public, since only institutional buyers can purchase them directly, retail investor participation is unavailable on a direct basis. Retail investors can only access the CLO market through CLO fund vehicles. There is untapped demand for CLOs as an income solution. With an active secondary market and pricing transparency, liquidity is available and improving.
The Horizon Kinetics CLO strategy to date has focused on the AAA and AA rated CLO tranches which, statistically, would require a far deeper credit crisis than any that has been experienced since the inception of the CLO market in the 1990s to even approach a potential loss of interest or principal. Since they have a pristine default score card, the experienced credit quality of this group is superior to a AAA and AA corporate bond. Despite this highly selective credit quality choice, the yield is comparable to a 5-year AAA and AA corporate bond, respectively, yet with the duration risk of a 3-month instrument. The number of high quality investment options among CLO debt tranches also allows for more diversification, with the objective of investing typically in 20 to 75 CLO investments.
In summary, we find that investing in CLO senior tranches (AAA and AA) offer an attractive risk adjusted return without taking undue credit, interest rate, and liquidity risks. It is a suitable place for investors looking for a high-quality fixed income investment with floating rate exposure.
The CLO strategy fund manager is Darryl Monasebian. He joined Horizon Kinetics about 4 years ago, though we’ve known him for 20+ years. Curricula-vitae-wise, he’s been a fixed-income investor for about 35 years, primarily in the corporate loan and CLO markets.
Final Income Comments
Before leaving this topic to give mention to a couple of other items, all the foregoing discussion of the means and methods of income investing could be summarized in a few observations.
If you need to spend your income, it is impossible to secure sufficiently higher yield or principal growth to be truly relevant on an after-inflation basis in mainstream funds and ETFs, because there is no meaningful differentiation in the generic securities in which they traffic. That is not a failure, from their perspective, it is by design. They intend to, and do in fact track their indices. To try to meaningfully outperform their indexes would be to simultaneously open themselves to meaningful underperformance risk, which is active management, not indexation.
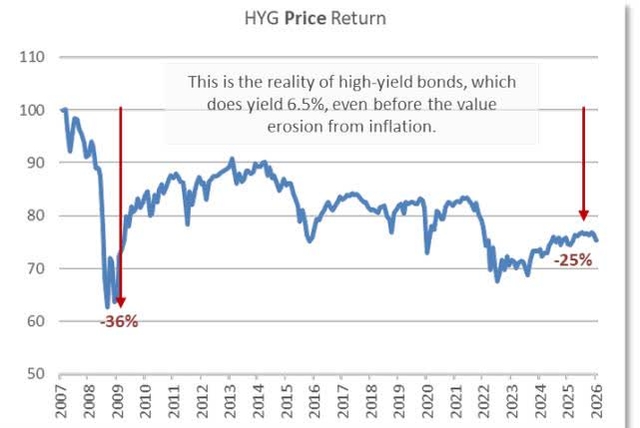
One might think that the high-yield corporate bond index, which does yield 6.5% ⁷ , could serve, by providing enough extra yield to reinvest. First, though, maybe take at least 1% point away for default losses over time. Then there’s the price loss when the inevitable default environment occurs.
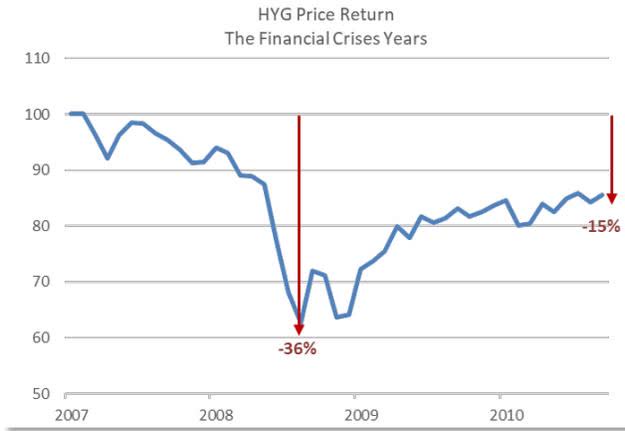

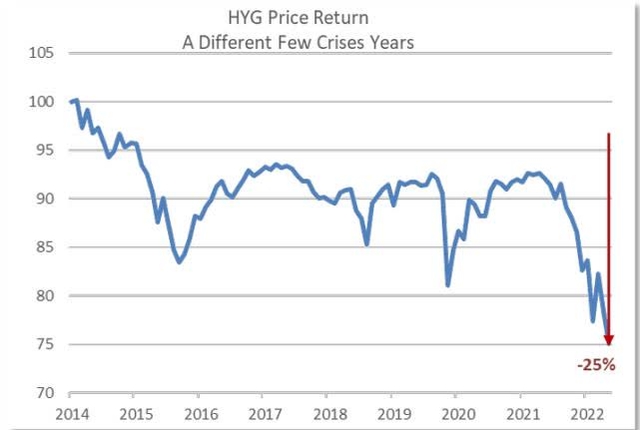

On a pure price basis, the high yield index is lower today than it was in 2007, which itself was 25% below its inception price. Here, again, in chart-picture form, is the difference between the total-return-calculated high-yield index, which is relevant only for those who don’t pay taxes or need the income, and the price-only reality of high-yield bonds, even before the value erosion from inflation.


![]()

And a final note
About where ideas come from at Horizon Kinetics after Murray Stahl, with his uncanny and rich amalgam of profundity and inspired investment fecundity. It turns out that he had that covered, too. Like so much of what he thought through, there was more than one purpose in mind. There’s an observable layer, and a deeper one.
Observably, our portfolios have never been in a stronger position. It’s one thing to have excellent, even superior investments. It’s another to hold strategic investments. How to tell the difference? A simple comparison will do.
We believe Hawaiian Electric will be a superb investment. If it’s established as a large core position, it won’t be because of how high it might go, but because of how low the risk of permanent capital loss is in a recovery-stage regulated utility. Yet, because it can be a large position, its portfolio impact will also be large, even if it’s not a “moonshot.” The “but” is that after the company achieves its financial goals several years from now, it will just be an ordinary utility company with state regulated growth and returns on equity. At that point, the return profile will be largely a function of interest rates as opposed to operational achievements.
The comparison: Almost any of the securities exchanges qualifies as, call it, a Level 2, strategic investment. That’s because, to the limit of predictability, their business longevity is perpetual. With operating profit margins among the highest in the operating business universe and little cyclicality, they can compound financially for decades. That has strategic value. It’s for owning, not trading.
Our portfolios now incorporate enough strategic holdings that they now essentially characterize our accounts. This wasn’t possible 20 years ago, before the exchanges and many of the royalty companies were public. They should prosper for many years.
But portfolios now also include Level 1 strategic investments. Those are part of the legacy that Murray left, along with the culture he patiently cultivated in our research and investment teams. Level 1s are businesses in which we have significant investments and direct relationships established over many years. The most obvious is TPL, which importantly is also a hard-asset company.
Direct engagement with a company naturally puts one in communication with other people. Being in communication, puts one in the flow of ideas and business developments that occur below the concourse level of the public market. To an inquiring mind, one communication, one relationship, one idea leads to another. Newer portfolio positions like Miami International Holdings, LandBridge (LB) and WaterBridge grew out of engagement with their pre-public selves and this crucible of relationships and ideas. Likewise for private investments like Bolt Energy and Land.
Last week, James Davolos, one of our analysts and fund managers, reviewed a few more such business developments and properties in our weekly Investment Committee. He’s been engaged with them through our association with TPL related activities. They are in various stages of coming to fruition—or not—and possibly being suitable for our portfolios or private funds.
This week, another of our analysts, Eric Sites, made a similar presentation. Eric tends a bit more toward securities exchange relationships, Miami Int’l Holdings among them; it is another Level 1 strategic investment. One of those percolating projects has the possibility of becoming a straight-up land-secured mortgage fund, structured to provide a 10% income distribution. It might not turn out, since the due diligence phase is yet to come, but the point is that it’s there.
This is a way of describing a working engine—an entrepreneurial layer—of idea generation, if that’s the question to answer. We have no shortage of creative ideas.
Murray put us on the firmest foundation imaginable in our line of business. True to our first strategic business planning meeting in 1994, at our first conference facility (a table at a Burger King down the block from our employer, Bankers Trust Company, hard by the World Trade Center), we built a fortress balance sheet that immunizes us from the vagaries of the markets and from having to make inopportune decisions under time pressure. Also true to that plan—as fanciful and distant as it seemed, sitting in that conference facility—we ultimately established strategic business investments that stand apart from the systemic risks and tempests of the public markets to which we never wanted to be beholden. It took a little time, but Murray Stahl, bless him, brought us here.
The opening of this Commentary observed the impermanence of that which so many investors over time—at least for awhile—thought to be inherently special or in permanent great demand. It’s societally impossible that great demand won’t incite more supply and competition. What is initially special devolves to just a commodity.
The strategic assets we own are special because they are as close to permanent as can practically be, and because they are rare.
- Land and water, for the hard asset companies that control them, are forever. The crowd can’t produce more land or water, so the supply is finite. In fact, per capita supply is in constant decline, since the global population is in constant increase. For commodities for which the supply can increase, like iron ore, it is the hard asset companies themselves that are in short supply. If the market does ever want them, there’s not enough market cap to go around. There’s a thought (or two). They’ll be on the right side of the iron law of supply and demand.
- Regulated securities exchanges are rare, too; you can’t go out and manufacture them. Unlike almost every other business, they aren’t bound by the zero-sum limitation in a battle for market share. A new venue, a new product or variation on a product actually has the opposite effect: it provides more trading and arbitrage possibilities between venues, volumes increase, and the trading market becomes deeper and more attractive.


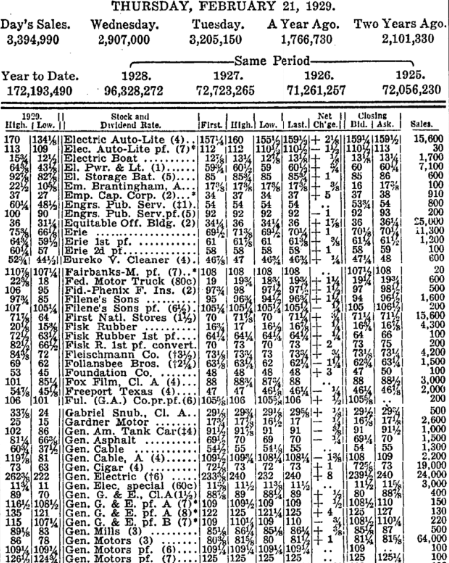
For most of human history, people kept their wealth in tangible assets: from money stones in Micronesia to precious stones everywhere else, precious metals, land, coins, art. Especially assets that generated income, like farmland. In 18 th and 19 th century England, wealth wasn’t quoted as the value of one’s stocks and bonds, but as the income the capital earned. One wasn’t worth £100,000; one was worth £6,000 a year. Scan the stock quotations in the daily paper in the early decades of the 20 th century. Aside from a much greater presence of raw materials producers, a good quarter to a third of the listings were preferred stocks. People liked their income; plus, most of the return came up front as cash dividends.

That preference for tangible assets began to change when investments commenced their long migration to intangible assets: to financial wealth and the financialization of the economy; and to telecommunications and the digitization of the economy.
The latter started with the first telephone poles that went up to hold the wires that transmitted a modulated electron stream. Other communications and data services advanced and ramified from there. From telephone wires to the over-the-air electromagnetic waves of radio and television, then from analog to digital data transmission. From coaxial to fiberoptic cable to broadband telecommunications, and from mainframes to desktops, then laptops, and from cell phones to smartphones, then to the cloud and then to cloud AI.
From a user’s point of view, it all got lighter and lighter and more insubstantial: what is a text message or photo in the cloud? It weighs nothing (or almost nothing). But, that’s a mirage that users see. Providers know the seemingly weightless intangible world of digital communication as very, very physical.
To house a photo in the cloud requires extraordinary quantities of basic materials. Pick just a single constituent of that massive infrastructure: embedded in every semiconductor chip is not only the silicon and precious and rare earth metals that comprise them, but enormous amounts of the ultra-pure water required in the manufacturing process, and the natural gas required to melt sand and quartz into electronics-grade silicon.

Once the photo is in the cloud, energy is required to support and retrieve the digital data that represents that photo in its electromagnetic environment. That electric power must always be on. With each additional photo, there’ll be more energy need, and that need just expands and expands.
Chip makers’ resource needs pale beside the requirements of AI-scale datacenters. Datacenter power demand has energized (yeah) electric utilities to expand output at a 3% annual rate. They underinvested in their transmission grids for generations and output hasn’t changed for 20 years. On a replacement basis the aged grid system comprises many trillions of dollars of investment, much of which is in the form of steel and copper.
The AI-IT companies that won’t or can’t wait in line are building their own power supply. Their requirements for physical stuff is not only for huge quantities of steel and cement and copper for the plant and equipment—but for land and mind-boggling volumes of natural gas and water to operate—which are limiting factors. You can build a data center without them, but you can’t run it without them.
Moreover, that land-water-natural gas trinity must be logistically proximate to one another while being remote from population centers. The solution set of locations for those parameters is limited. The Delaware basin is one of them.
In the full circle macroeconomic sense, the world seems to be in re-wind toward a time when there was no illusion about the undergirding place of tangible assets in the economy and technology. It’s migrating right back there as we speak.
Decades ago, Murray foresaw this very pattern and believed that with enough decades of compounding, TPL could one day be one of the largest companies in the world. Without explanation, it seemed a terribly naïve, baseless notion. It was not. It was a model.
Thirty years ago, we made an early rough working draft of that model, which may be viewed in the From the Archives section appended hereto. So far, that model has held amazingly close to reality.
We are where we need to be.
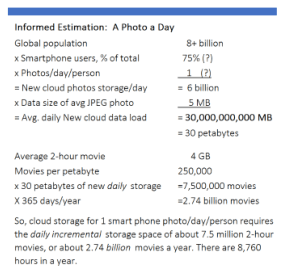
So, cloud storage for 1 smart phone photo/day/person requires the daily incremental storage space of about 7.5 million 2-hour movies, or about 2.74 billion movies a year. There are 8,760 hours in a year.
From the Archives
What’s old is new again—or can be, in the true strategic asset universe.
At HK central, we’ve been preparing to move for well over a year, since our lease is expiring. Very near the bottom of the to-do list is making the keep/discard decisions for the many, many drawers of research records. For younger people unfamiliar with old technology, these were in the form of individual sheets of paper media, often stapled or “paper-clipped” with small metal fasteners to keep the data from becoming disorganized, and themselves kept in paper folders that were labeled with plastic tabs so they could be visually scanned and alphabetically sorted. Very analog, since the entirety can now reside in my thumb drive (which much of it does).


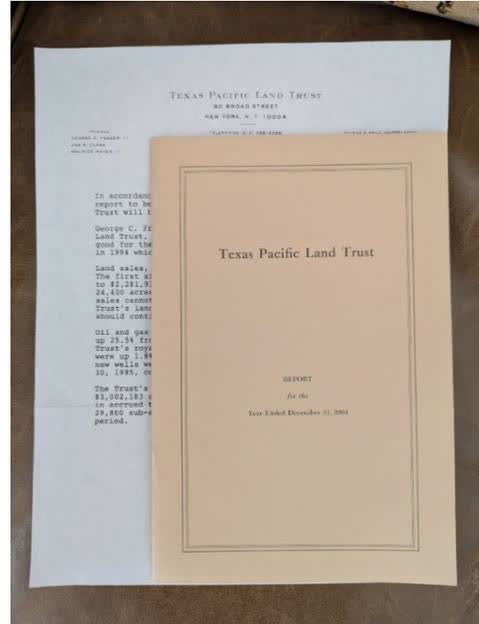
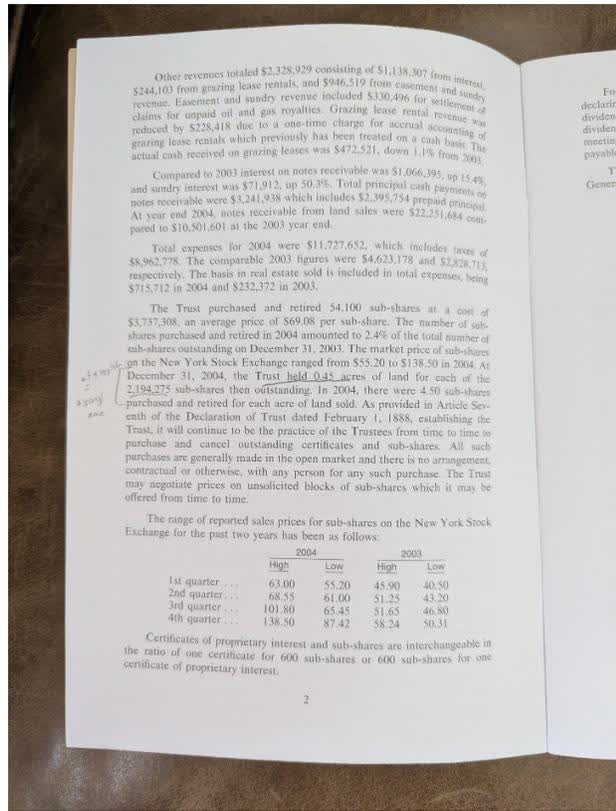
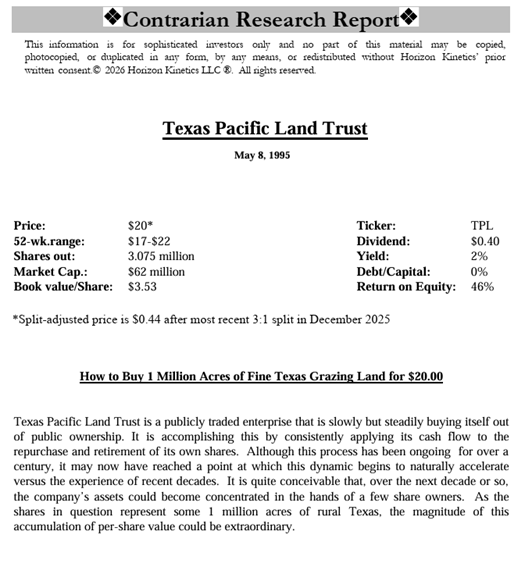
Recovered from the keep pile of research files is the very first financial statement issued by the Texas Pacific Land Trust. Dated June 1995 to all the sub-shareholders. ⁸ It is a single sheet of paper, with plenty of room for the management letter on the front of the page and all the financial data on the back. This advancement in shareholder communications was in accordance with an “SEC suggestion,” as can be read in the senior trustee’s letter. There was no scrolling in paper media; the word “more” at the bottom of the first page instructs the reader to turn the page over to access all further data. The senior trustee indicated that future reports would be issued every six months.
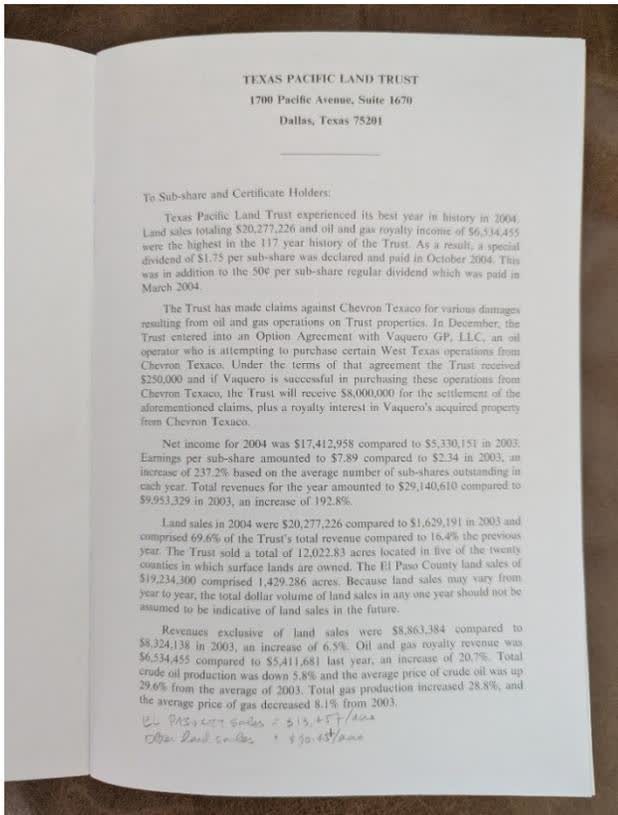
By 2004, the annual report had graduated to booklet sized. One will espy some analytical scribblings on pages 1 and 2, which cleverly compared two anomalous figures: the stock market value of TPL amounted to a price of $309 per acre of land, while various surface land sales in El Paso County averaged over $13,000 per acre.


An abridged excerpt from our 1995 buy recommendation included this 15-year scenario of continued share repurchases, based on 3% annual revenue growth, a constant share price, and funded through free cash flow. The Trust would have repurchased 95.9% of its shares. That astounding result, rendered in finance jargon, which we ordinarily eschew, would be: compounding, baby!

That figure suggested that, all else equal, the remaining 4.1% of the shares would own, tontine-like, all of the property, all 1.1 million acres. The amount of acreage per share and, perforce, the value of each would be calculated as 100% / 4.1%, which is 24x greater. The reality, 15 years later in 2010, was that the shares were only 10x higher. Still, over 16% a year. Not bad, really, for a static, unadjusted model.
The projected 24x value expansion projection would have worked out to just under 25% a year.
As of 2025, 31 years later, the shares are 937x higher, which is just under 25% a year.
References
- Source: iShares Core S&P 500 ETF’s 30 Day SEC Yield as of Mar 31, 2026
- A K-1 form, or Schedule K-1, is a tax document used to report an investor’s share of income, deductions, and credits from a pass-through entity such as a partnership or S corporation. The information is used to prepare investors’ separate tax returns to allow the income to be taxed at the individual level rather than at the entity level, helping to avoid double taxation. Accountants have many entries to make, which raises the preparation cost to their clients, and often communicate their dislike of K-1s. It is not uncommon that a K-1 arrives too late for the April 15th tax filing deadline, requiring a filing extension, an extremely unattractive feature to many.
- https://horizonkinetics.com/app/uploads/Founders-Letter-2026_Final.pdf
- Million cubic feet, the standard volume measure for pricing natural gas.
- Grants’ Interest Observer on the Late Murray Stahl: His Stream of Mind Was Perpetual
- The one default of a CLO AA tranche (Landmark II CDO Ltd.), which occurred in 2010, had its ratings lowered from AA to D by S&P Global Ratings in 2010. The default occurred when the CLO’s trustee escrowed the AA debt tranche’s interest payments (causing a missed interest payment), after the trustee filed an interpleader action with U.S. courts. The AA debt investors did not suffer any economic loss, as the ratings were subsequently upgraded from D to AA in 2011, after AA debt investors received all interest owned as well as interest on interest. The principal due on the AA debt tranche was paid off in full shortly thereafter.
- Source: iShares. 30 Day SEC Yield as of Apr 22, 2026.
- There were not common shares at the time, but sub-shares in the Trust’s Certificates of Proprietary Interests
Original Post
Editor’s Note: The summary bullets for this article were chosen by Seeking Alpha editors.
Editor’s Note: This article discusses one or more securities that do not trade on a major U.S. exchange. Please be aware of the risks associated with these stocks.

")

")

")

