


After falling in the first quarter of 2024, earnings of Flushing Financial Corporation (NASDAQ: NASDAQ:FFIC) will likely recover the remainder of the year on the back of loan growth. I’m expecting the company to report earnings of $0.79 per share for 2024 and $1.01 per share for 2025. The year-end target price suggests a high upside from the current market price. Further, FFIC is offering a very attractive dividend yield of 6.7%. However, there is a small threat of a dividend cut. Based on the total expected return, I’m adopting a buy rating on Flushing Financial Corporation.
Margin Likely to Stabilize
Flushing Financial Corporation’s earnings have faced pressure of late because of net interest margin contraction. The margin dipped by 23 basis points during the first quarter of 2024. Further, the average margin for 2023 was 87 basis points below the average margin for 2022. The margin compression was largely attributable to the shifting of the deposit mix towards interest-bearing accounts and away from non-interest-bearing accounts.
SEC Filings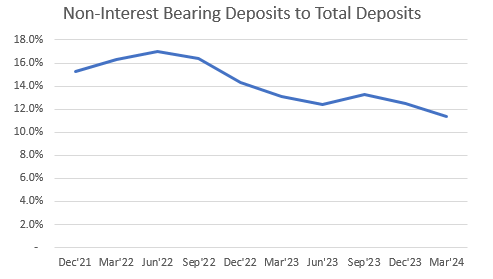

Going forward, I’m expecting the deposit migration to pause because I’m anticipating interest rate cuts, which will reduce the attractiveness of interest-bearing accounts relative to non-interest-bearing accounts. As a result, I’m expecting the pressure on the margin to wane.
Holding the balance sheet constant, the anticipated interest rate cuts will have a negligible direct impact on the margin. This is because of the characteristics of loans and deposits, which make the balance sheet slightly liability-sensitive. The results of the management’s rate-sensitivity analysis given in the 10-K filing show that a 100-basis point rate cut could reduce the net interest income by just 0.07% over twelve months.
2023 10-K Filing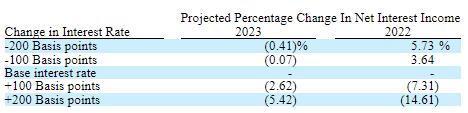

Considering the Federal Reserve’s latest projections, I’m anticipating a 25-basis points rate cut later this year, and 100-basis points rate cuts in 2025. Based on my interest-rate outlook and the balance sheet’s rate sensitivity, I’m expecting the margin to remain mostly unchanged through the end of 2025.
Expecting Loan Growth Improvement
Flushing Financial Corporation’s loan portfolio declined by 1.2% during the first quarter, after dipping by 0.4% in 2023. I’m not too worried because the portfolio has declined in the first quarters of the last two years as well and then recovered in the remainder of the year. Therefore, the first quarter’s decline appears to be more seasonal than the part of a negative trend.
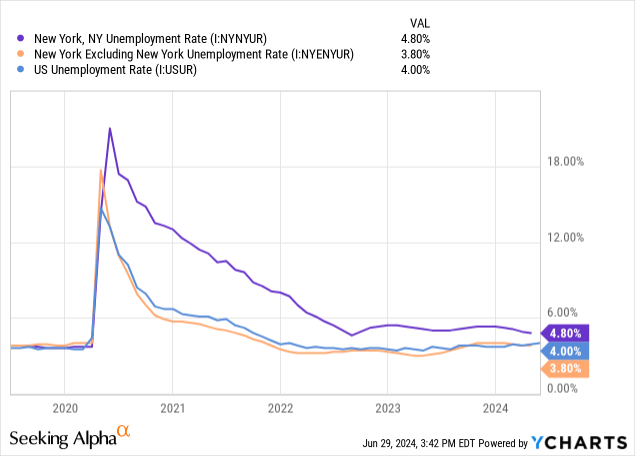
The company operates in the New York City Boroughs of Queens, Brooklyn, and Manhattan, and in Nassau and Suffolk County, New York. As shown below, the gap between the unemployment rate of New York City and the national average unemployment rate has significantly declined over the last few months.

Moreover, economic activity in the state of New York appears to have improved this year, as can be deciphered from the slope of the coincident economic activity index shown below.
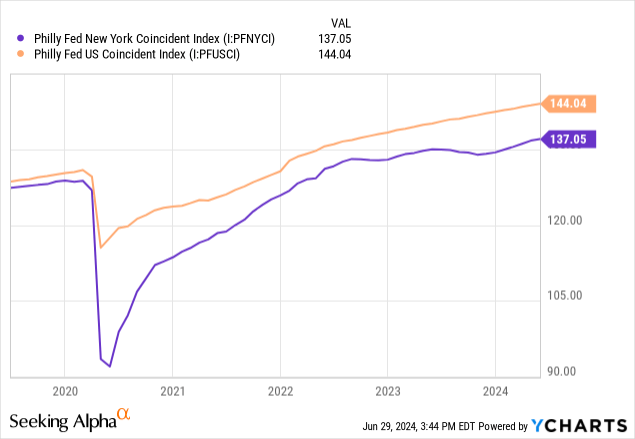
As a result, I’m confident that loan growth can improve in the last three quarters of 2024. I’m estimating the loan portfolio to have grown by 0.75% in the second quarter of this year. Further, I’m expecting the portfolio to grow by 0.75% every quarter till the end of 2025. Moreover, I’m expecting other balance sheet items to grow in line with loans. The following table shows my balance sheet estimates.
| Financial Position | FY19 | FY20 | FY21 | FY22 | FY23 | FY24E | FY25E |
| Net Loans | 5,750 | 6,660 | 6,601 | 6,894 | 6,867 | 6,935 | 7,145 |
| Growth of Net Loans | 4.0% | 15.8% | (0.9)% | 4.4% | (0.4)% | 1.0% | 3.0% |
| Other Earning Assets | 831 | 706 | 835 | 809 | 948 | 1,277 | 1,316 |
| Deposits | 5,022 | 6,091 | 6,334 | 6,437 | 6,765 | 7,334 | 7,556 |
| Borrowings and Sub-Debt | 1,237 | 1,021 | 816 | 1,147 | 841 | 687 | 708 |
| Common equity | 580 | 619 | 680 | 677 | 670 | 670 | 674 |
| Book Value Per Share ($) | 20.2 | 21.1 | 21.5 | 22.3 | 22.6 | 22.5 | 22.6 |
| Tangible BVPS ($) | 19.6 | 20.4 | 20.9 | 21.6 | 21.9 | 21.9 | 22.0 |
| Source: SEC Filings, Author’s Estimates(In USD million unless otherwise specified) | |||||||
Expecting Earnings to Improve from the First Quarter’s Level
After plunging in the first quarter of 2024, I’m expecting earnings to recover in the remainder of the year on the back of loan growth. Meanwhile, the margin will likely remain stable. Further, I’m making the following assumptions:
- I’m expecting the provisioning expense for loan losses to continue at the first quarter’s level through the end of 2025.
- I’m assuming non-interest income will grow at a low and conservative rate of 0.5% every quarter till the end of next year.
- I’m expecting the efficiency ratio (calculated as non-interest expenses divided by total revenue) to gradually improve and return to the 2023 level over the next year and a half.
Based on these expectations, I’m estimating earnings of $0.79 per share for 2024 and $1.01 per share for 2025. The following table shows my income statement estimates.
| Income Statement | FY19 | FY20 | FY21 | FY22 | FY23 | FY24E | FY25E |
| Net interest income | 162 | 195 | 248 | 244 | 179 | 172 | 178 |
| Provision for loan losses | 3 | 23 | (5) | 5 | 11 | 4 | 4 |
| Non-interest income | 9 | 11 | 4 | 10 | 23 | 12 | 13 |
| Non-interest expense | 115 | 138 | 147 | 144 | 151 | 150 | 147 |
| Net income – Common Sh. | 41 | 35 | 82 | 77 | 29 | 23 | 30 |
| EPS – Diluted ($) | 1.44 | 1.18 | 2.59 | 2.50 | 0.97 | 0.79 | 1.01 |
| Source: SEC Filings, Earnings Releases, Author’s Estimates(In USD million unless otherwise specified) | |||||||
Risks Appear to be Low
The loan portfolio is geographically concentrated in the state of New York. This lack of geographical diversity is a source of risk. Otherwise, the company’s risk level is low, as discussed below.
- Office property loans made up just 3% of total loans at the end of March 2024, according to details given in the latest earnings presentation. Moreover, non-performing loans were zero percent of total office loans. Therefore, the risk from the work-from-home culture is limited.
- Gross unrealized losses on the Available-for-Sale securities portfolio amounted to $81.7 million at the end of March 2024, which is around just 12% of total equity book value.
- Uninsured and uncollateralized deposits totaled $1.2 billion at the end of March 2024, which is only 16.8% of total deposits.
FFIC is Offering a Dividend Yield of 6.7%
Flushing Financial Corporation is offering an attractive dividend yield of 6.7% at the current quarterly dividend of $0.22 per share and the June 28 closing market price of $13.15. However, there is a risk, albeit small, that FFIC could cut its dividend because my estimated earnings and dividend estimates imply that the payout ratio will go above 100% in 2024.
Nevertheless, for the purposes of this investment thesis, I’m not expecting any dividend cut because I think FFIC can manage to pay a dividend that’s greater than earnings in 2024. This is because the company had excess tier I capital of $388.5 million at the end of March 2024, which is much higher than the total annual dividend amount of $26 million.
Further, the implied payout ratio will fall to 87.6% in 2025, which is better than the payout ratio of 91% for 2023. Therefore, I think FFIC is likely to ride out 2024 without cutting its dividend because the earnings outlook is positive.
Adopting a Buy Rating
I’m using the historical price-to-tangible book (“P/TB”) and price-to-earnings (“P/E”) multiples to value Flushing Financial Corporation. The stock has traded at an average P/TB ratio of 0.90x in the past, as shown below.
| FY19 | FY20 | FY21 | FY22 | FY23 | Average | |
| T. Book Value per Share ($) | 19.6 | 20.4 | 20.9 | 21.6 | 21.9 | |
| Average Market Price ($) | 21.6 | 13.7 | 22.3 | 21.8 | 14.7 | |
| Historical P/TB | 1.10x | 0.67x | 1.07x | 1.01x | 0.67x | 0.90x |
| Source: Company Financials, Yahoo Finance, Author’s Estimates | ||||||
Multiplying the average P/TB multiple with the forecast tangible book value per share of $21.9 gives a target price of $19.8 for the end of 2024. This price target implies a 50.4% upside from the June 28 closing price. The following table shows the sensitivity of the target price to the P/TB ratio.
| P/TB Multiple | 0.70x | 0.80x | 0.90x | 1.00x | 1.10x |
| TBVPS – Dec 2024 ($) | 21.9 | 21.9 | 21.9 | 21.9 | 21.9 |
| Target Price ($) | 15.4 | 17.6 | 19.8 | 22.0 | 24.1 |
| Market Price ($) | 13.2 | 13.2 | 13.2 | 13.2 | 13.2 |
| Upside/(Downside) | 17.1% | 33.7% | 50.4% | 67.0% | 83.6% |
| Source: Author’s Estimates |
The stock has traded at an average P/E ratio of around 11.8x in the past, as shown below.
| FY19 | FY20 | FY21 | FY22 | FY23 | Average | |
| Earnings per Share ($) | 1.44 | 1.18 | 2.59 | 2.50 | 0.97 | |
| Average Market Price ($) | 21.6 | 13.7 | 22.3 | 21.8 | 14.7 | |
| Historical P/E | 15.0x | 11.6x | 8.6x | 8.7x | 15.2x | 11.8x |
| Source: Company Financials, Yahoo Finance, Author’s Estimates | ||||||
Multiplying the average P/E multiple with the forecast earnings per share of $0.79 gives a target price of $9.3 for the end of 2024. This price target implies a 29.2% downside from the June 28 closing price. The following table shows the sensitivity of the target price to the P/E ratio.
| P/E Multiple | 9.8x | 10.8x | 11.8x | 12.8x | 13.8x |
| EPS 2024 ($) | 0.79 | 0.79 | 0.79 | 0.79 | 0.79 |
| Target Price ($) | 7.7 | 8.5 | 9.3 | 10.1 | 10.9 |
| Market Price ($) | 13.2 | 13.2 | 13.2 | 13.2 | 13.2 |
| Upside/(Downside) | (41.2)% | (35.2)% | (29.2)% | (23.2)% | (17.3)% |
| Source: Author’s Estimates |
Equally weighting the target prices from the two valuation methods gives a combined target price of $14.5, which implies a 10.6% upside from the current market price. Adding the forward dividend yield gives a total expected return of 17.3%. Hence, I’m adopting a buy rating on Flushing Financial Corporation.
")


")


