


")


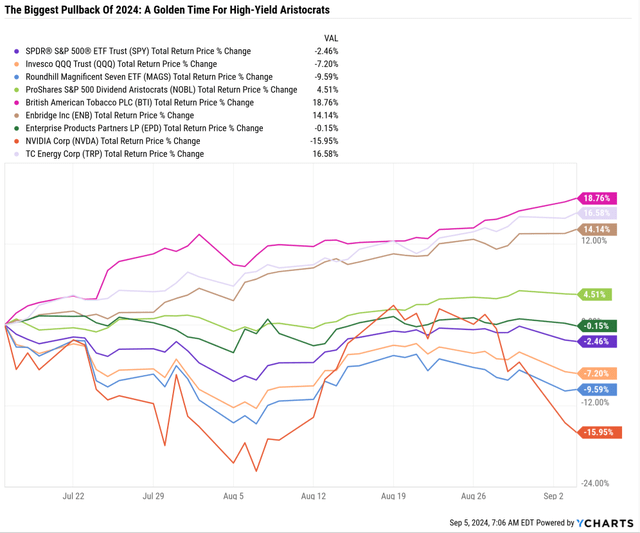
Market volatility has returned, with Nvidia (NVDA) plunging 9.5% in a single day (11.5% including after hours), wiping out $280 billion in market cap in one day.
For context, that equals Chevron’s (CVX) value being wiped out in hours.
Bloomberg reports that Jenson Huang’s net worth fell by $10 billion, the worst single-day decline since they began tracking him in 2016.
Always And Forever A Market Of Stocks, Not A Stock Market

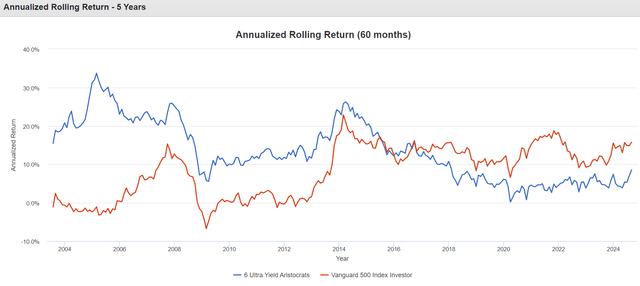
Ycharts
Big tech is suffering, and dividend aristocrats are thriving. High-yield aristocrats are soaring in a mini-repeat of the tech crash when high-yield value soared, and the tech got wrecked.

Ycharts
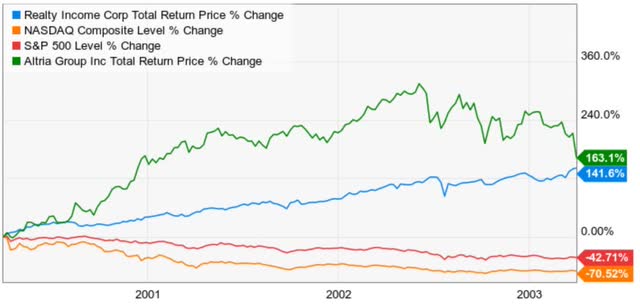
This is what can happen when valuations become the most extreme in history.
March 2000: Peak of the Tech Bubble
- Realty Income (O) 11% yield and 7X FFO (50% historical discount)
- Enterprise Products (EPD) 13% yield and 5X cash flow (55% historical discount)
- British American (BTI) 16% yield (65% historical discount)
- Altria (MO) 43% yield and 2X earnings (84% historical discount)
These companies were not broken in March 2000. It was a value bear market inspired by the tech bubble’s collective speculative mania and madness.
How This Time Is And Isn’t, Likely Different
It’s not a tech bubble. Anyone who tells you this is lying, ignorant, or trying to sell you something (sometimes it’s all three).
Back in the tech bubble, companies like Pets.com and thousands of small caps with no business models were IPOing to raise money to buy things like Cisco (CSCO) routers.
Cisco would lend to these companies on credit, allowing them to boost sales even more.
Today, the mega capex spending?

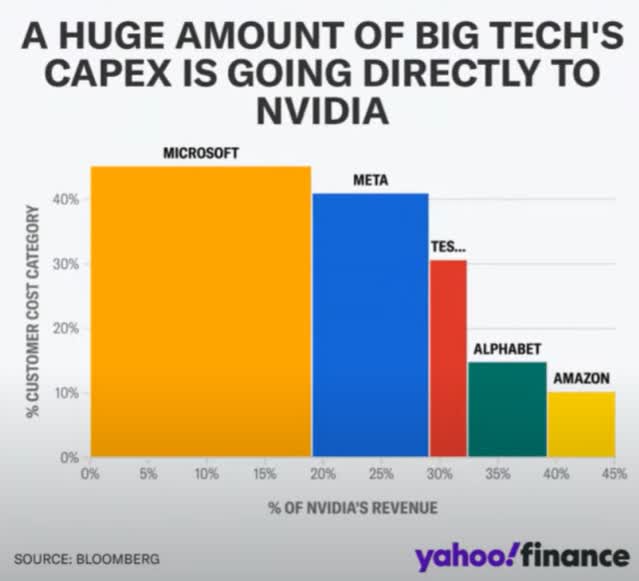
Yahoo Finance
Today, the mega spending comes from the richest companies on earth, which have $1.2 trillion in cash on their balance sheets.
Another $10 billion in NVDA sales (8%) comes from sovereign governments like Japan, Singapore, and France.
Big Tech Valuations Are Not In A Bubble

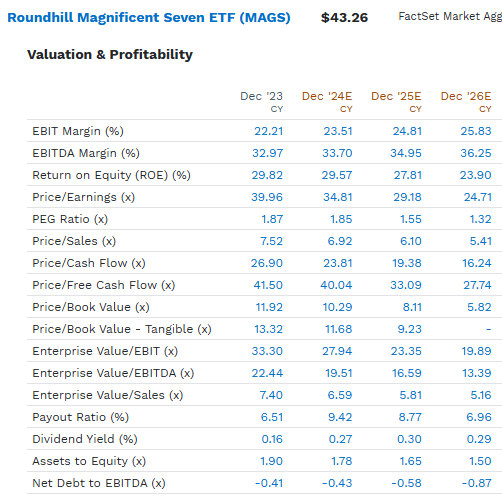
FactSet
The Mag 7 trades at 16.6X 2025 EV/EBITDA (cash-adjusted earnings).

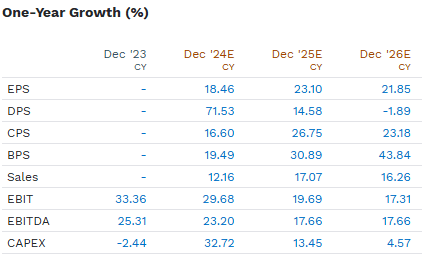
FactSet
Big tech is expected to grow its earnings by 23% next year and 22% more in 2026.
In 2027, Goldman expects AI to start accelerating US economic growth by 1.5% (0.3% to 2.9%) and EPS growth by about 6%.
16.7X EV/EBITDA divided by 23.1% growth is a cash-adjusted PEG of 0.72. That’s not just growth at a reasonable price; it’s ultra-quality hyper-growth at a wonderful price.
According to Morningstar and FactSet, 18.1X forward EV/EBITDA for ultra-wide moat companies grows earnings at 18.4% long term.
- Cash-adjusted PEG of 0.98.
If big tech can achieve the expected growth rates (which are not guaranteed by any means), then mathematically speaking, it’s not in a bubble.
But It Might Be Value’s Time To Shine

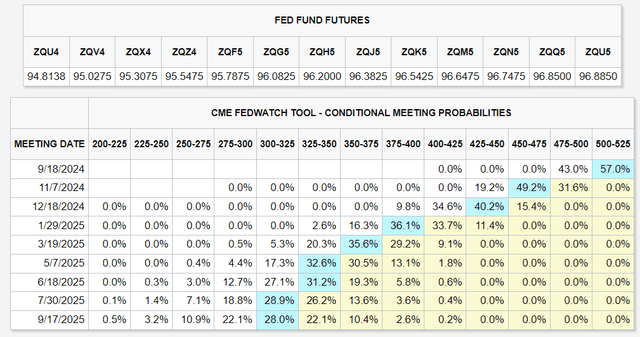
CME Group

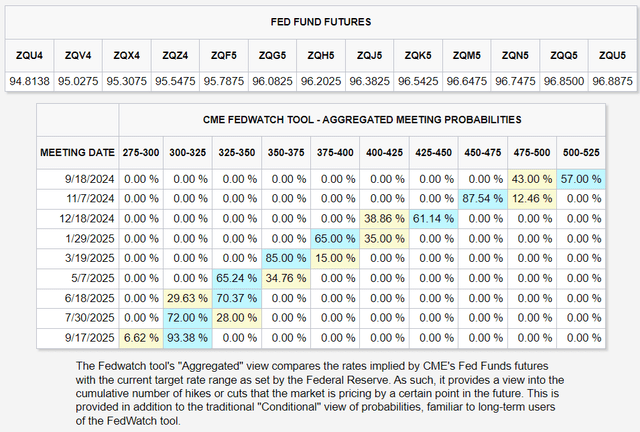
CME Group
The bond market is now pricing in 2.25% worth of rate cuts by July 2025, with a 22% chance of a 2.5% cut by September.
There’s now a 93% probability of 2.25% cuts by September 2025.
If the economy slows below 1.8% long-term expectations, rates could fall even lower.
How much lower?

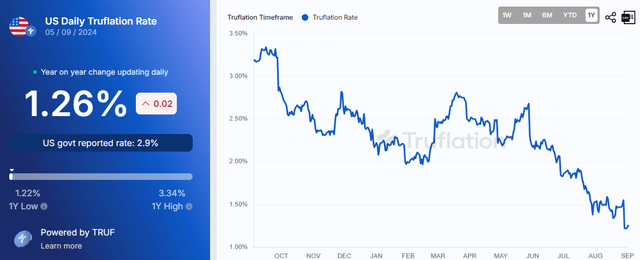
Truflation
Truflation is a useful proxy for where the Fed might end up with rate cuts.
Since 2012, it has been 97% correlated with CPI and 0.5% above Core PCE.
In other words, Core PCE is likely to be at 0.76%, compared to the Fed’s 2% target.
The Fed would be fundamentally justified in cutting to 1.25% to stimulate the economy and bring core PCE back up to target.
That’s not a forecast that the Fed will cut rates to 1.25%. It means, “If and only if today’s inflation trends remain in place indefinitely, the Fed would be fundamentally justified in cutting rates to 1.25%.”
How Ultra-Yield Aristocrats Benefit From Falling Rates
Falling rates don’t directly help the likes of Realty Income or Altria.
These companies have long-term debt that is tied to 10-year Treasury yields.
Meanwhile, 10-year yields are down significantly from their 5.5% highs in October of 2023 (3.73% on Sept. 4). The benefits of lower rates are more indirect.
For example, falling Fed funds rates cut credit card rates (slowly) and help consumers’ spending, which is why BTI and MO management have said that falling rates should help their volumes stabilize.
Pipeline aristocrats like EPD or REITs like Realty Income (O) don’t benefit directly from consumer spending.
Thanks to their utility-like business models, they benefit indirectly from a more robust economy.
However, after multi-year bear markets, extremely low valuations have turned high-yield aristocrats like these into coiled springs.
And all it takes is sentiment to get a little better for the hatred of the market to become a wild-eyed love affair.
At this point, momentum traders, whose only loyalty is to technical analysis, pick up the baton, start buying, and keep the momentum going in a self-perpetuating cycle.
Every investor needs a story to justify buying a stock, even if the story is overly simplistic and wrong. And “rates down, high-yield stocks up” is a simplistic story that worked for most of the last decade.
In other words, momentum traders who don’t care about valuation or yield are why high-yield aristocrats can go into bubbles.
Momentum Traders Can Drive High-Yield Aristocrats Into Bubbles

FAST Graphs, FactSet
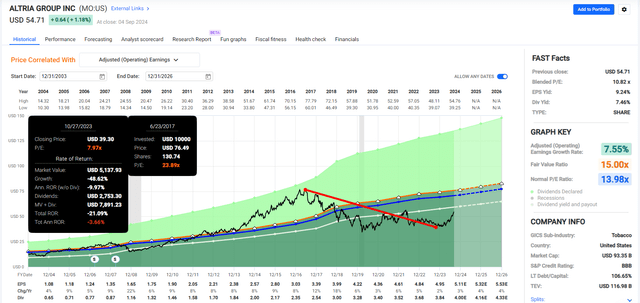
In 2000, Altria hit a PE of 1.6 and a peak yield of 43%.
2017, it hit a PE of almost 24, a 70% historical premium.
From an 84% discount to a 70% premium in 17 years.
In 2000, it seemed ludicrous to bearish investors to believe that Altria would ever return to its historical 14X earnings and 20-year average.
In 2017, bullish investors thought MO could not survive a strong bear market, strong enough to bring it back to its 14X historical fair value.
But that’s how Mr. Market’s psychology works.
Why This Matters To Ultra-Yield Aristocrat Investors
When MO hit its peak 2017 highs, powered by record low-interest rates (at the time) and the “there is no alternative” or TINA “bond alternative” story (100% incorrect but plausible-sounding enough at the time), its yield fell to 3.14%.
That’s compared to a historical (20-year) 5.6% fair value yield.
Why would anyone buy Altria at 24X earnings and a yield of just 3%?! Didn’t they know that was crazy? Momentum traders weren’t buying MO for the long term.
They were buying it as a “carry trade.”
A carry trade is your income if an asset’s price stays flat for a year. Altria’s 3% yield is crazy to long-term investors.
But to a momentum trader? “I can earn 3% yield while collecting capital gains if the momentum holds and Altria keeps running higher.”
Why would Altria keep rising if it were already overvalued in 2017?
“TINA investors will be suckers, and as long as interest rates keep falling, TINA suckers will keep buying MO, and I can sell at a higher price to them.”
Speculators Buying MO at High Valuations Earned 20% Annual Returns For Five Years

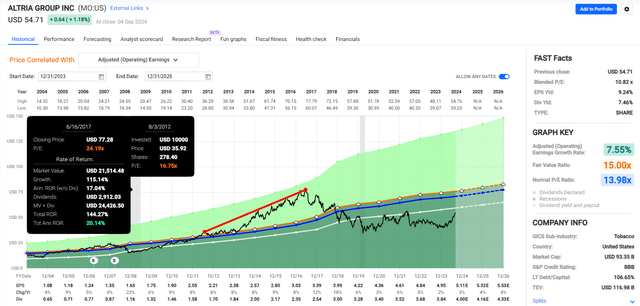
FactSet
The TINA carry trade in Altria worked for five years, generating Buffett-like 20% annual returns from an overvalued blue chip in plain sight.
The multi-year bear market was the inevitable reckoning that inevitably came when the TINA trade failed, as it would eventually.
A Warning To Ultra-Yield Aristocrat Investors
This walk down Wall Street memory lane has a purpose. To warn income investors that markets can seem irrational for many years.
“Seem” irrational is critical because the market isn’t crazy.
Traders in 2017 were buying MO because the trend was its friend.

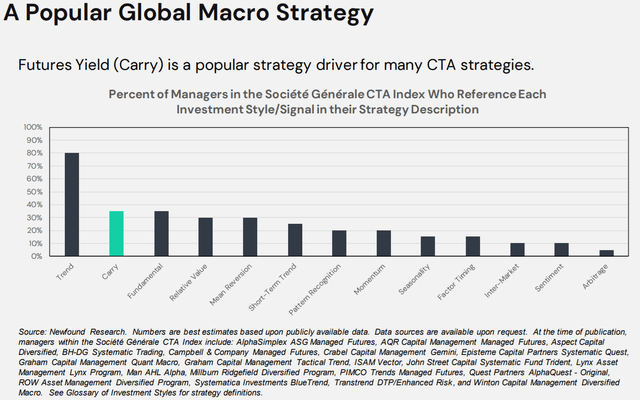
Resolve Asset Management
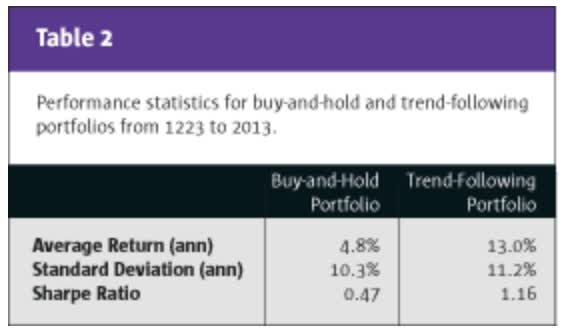
Trend following is a strategy used by 80% of hedge funds.

Alpha Simplex

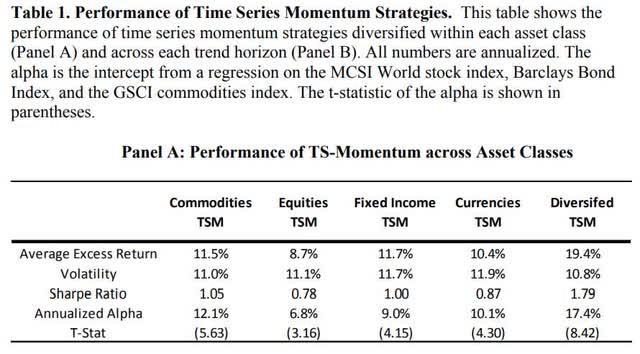
AQR
It’s a beautiful long-term statistical, rules-based strategy.
But it means that individual stocks, positions, or asset classes can be driven to both upside and downside extremes.

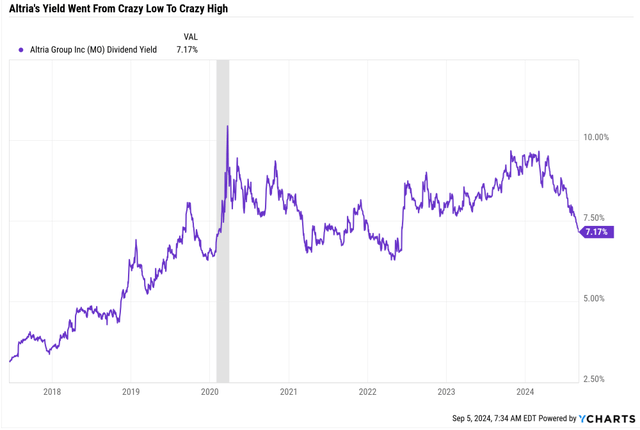
Ycharts
Given the company’s fundamentals at these yields, the 3% yield on MO was insanely low, and the 10% yield was insanely high.
Yet investors, driven by traders, were able to take advantage of mispricing in MO if they remembered the principles of disciplined financial science, safety, and quality first, and reasonable valuation and prudent risk management always.
In other words, ultra-yield aristocrats will always cycle between absurd over and undervaluation periods.
Right now might be the last time Ultra Yield aristocrats offer attractive valuations for several years.
So it’s time to buy the best ultra-yield aristocrats... while we still can.
How To Find The Best Ultra Yield Dividend Aristocrats For September
I start this screen by screening for the dividend champions, all companies with 25–plus year dividend growth streaks.
- I added BTI and TRP to the dividend champion list (they become champions this year).
- So members can find them on these screens before they potentially become overvalued.
The difference between aristocrats and champions is the aristocrats are only S&P companies with 25-plus year streaks.
Any company that is too small to be in the S&P, an MLP (like EPD), or foreign stocks will never be an official aristocrat.
All that means is that NOBL won’t own it. However, the benefits of aristocrats, including higher quality, lower fundamental risk, and superior dividend dependability, are the same for champions as aristocrats.
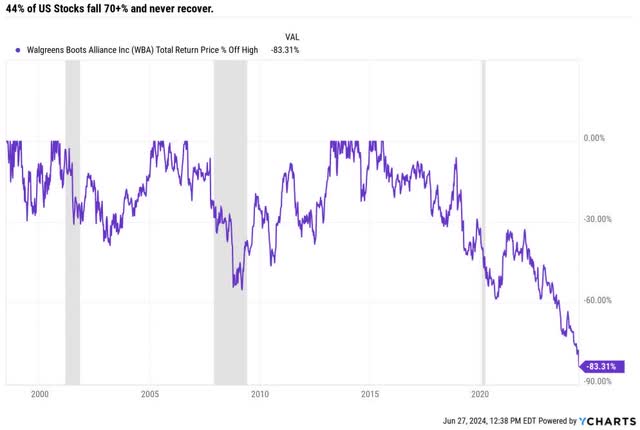
I next screen out speculative companies.
Speculative companies can be three kinds of companies.
- Junk bond-rated companies (their debt is “speculative” by definition).
- Companies in complex turnarounds (like 3M, WBA, VFC, INTC).
- New IPOs with highly uncertain valuations.
With ultra-yield aristocrats, you want to avoid speculative companies for obvious reasons.

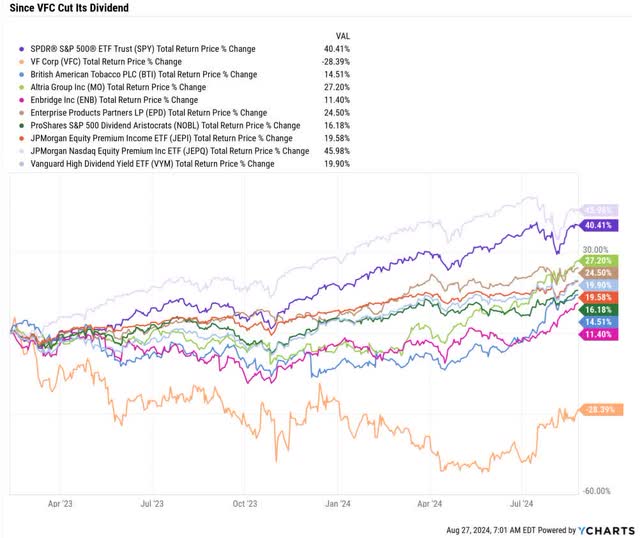
Ycharts
Ycharts
When the dividend is cut, it means “The fundamentals of our company are the worst they’ve been in decades.”
Management might not say it, but the historical data is clear. If the dividend is cut, selling is the lowest-risk strategy.

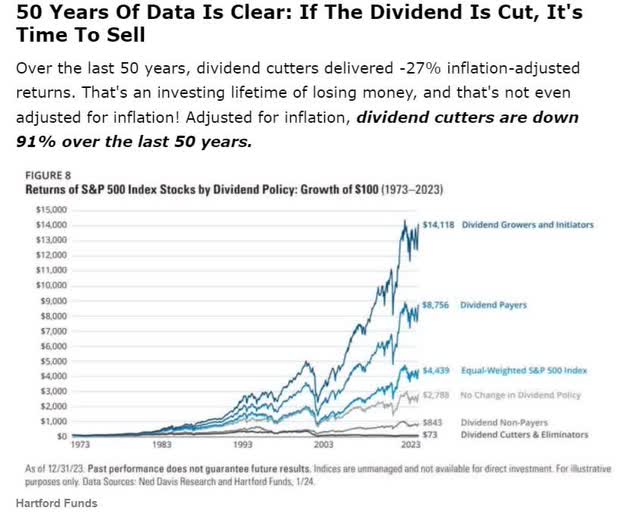
Hartford Funds
If an aristocrat cuts its dividend for the first time in 25-plus years, it means “our fundamentals are worse than during the Pandemic, Great Recession, tech crash, etc.”
Let’s imagine you’re a pure aristocrat income investor. You buy only dividend aristocrats.
There are 129 dividend champions, and their number has been rising gradually.
Why would you want to roll the dice that “this time is different” and an aristocrat that had to cut due to catastrophic fundamental deterioration will be one of the few companies to defy the odds?
As a data-driven investor, I will never forget what Keynes said.
When the facts change, I change my mind. What do you do, sir?” – John Maynard Keynes
The only loyalty investors should show a company is loyalty to the truth, fundamentals, and dependable income.
So once we have our non-speculative dividend champions screened for fair value or better (something great is always on sale, so why overpay), we end up with six ultra-yield dividend aristocrats.
The best Ultra Sleep Well at Night (Ultra SWN) ultra-yield aristocrat values left in September.
The 6 Best Ultra Yield Aristocrats To Buy While You Still Can

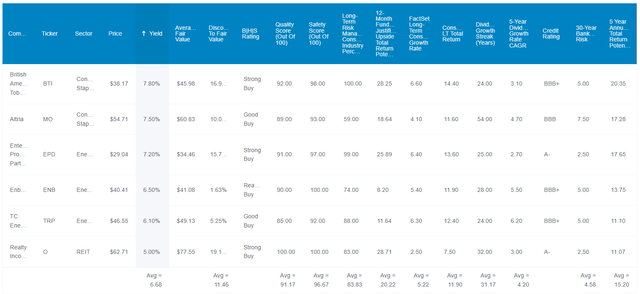
(Source: Dividend Kings Zen Research Terminal)
Fundamental Summary
These six ultra-yield aristocrats range from a 5% yield to a 7.8% yield with an average of 6.7%, more than twice the 3% yield of Vanguard’s high-yield ETF (VYM).
That’s 4X the yield of the S&P.
While the S&P is now 4% overvalued, these aristocrats are 11.5% historically undervalued.
- Aristocrats are historically fairly valued.
Their overall quality is 91% Ultra Sleep Well At Night, i.e., “wide moat aristocrats quality, as close to perfect quality companies as can exist.”

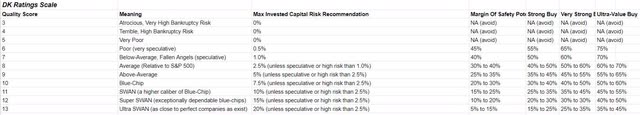
DK
Their safety score is 97%, which indicates very low dividend cut risk, even in severe recessions like the Great Recession and the Pandemic.
| Rating | Dividend Kings Safety Score (Over 1,000 Metric Model) | Approximate Dividend Cut Risk (Average Recession) | Approximate Dividend Cut Risk In Pandemic Level Recession |
| 1 – unsafe | 0% to 20% | over 4% | 16+% |
| 2- below average | 21% to 40% | over 2% | 8% to 16% |
| 3 – average | 41% to 60% | 2% | 4% to 8% |
| 4 – safe | 61% to 80% | 1% | 2% to 4% |
| 5- very safe | 81% to 100% | 0.5% | 1% to 2% |
| 6 Ultra Yield Aristocrats | 96% | 0.5% | 1.15% |
| S&P Risk Rating | 84% Percentile, Excellent | BBB+ stable outlook credit rating = 4.58% 30-year bankruptcy risk | 20% or Less Max Risk Cap (each) |
(Source: Dividend Kings Zen Research Terminal)
S&P rates their risk management (see risk section) as 61% optimal and 84th percentile in the world or the top 16% of all global companies.
The growth rate is 5.2%, the growth of cash flow and dividends.
According to analysts and management guidance, combined with a nearly 7% very low-risk yield, that’s 11.9% long-term total return and income growth potential.
That’s 4X the yield of the S&P and 20% better long-term return potential than the S&P’s historical returns.
The discount to fair value, good growth, and an 11% discount mean 20% upside potential in the next 12 months.
- Not a forecast.
- Fundamentals justify a 20% rally within 12 months.
- And then 12% annual returns after that.
In other words, if these stocks went up 20% in the next year and then 12% annually for the next four years, today’s fundamentals would 100% justify it.
- 89% of the total return within five years would be 100% justified by fundamentals.
Those living off the dividends (almost 7%) would likely experience 5% to 6% dividend growth above 2.3% long-term inflation expectations.
Those reinvesting dividends and rebalancing annually could expect 11% to 12% long-term income growth.
- 11.9% long-term income growth consensus.
- 9.6% inflation-adjusted income growth.
- Doubling every 7.5 years.
- 150% inflation-adjusted income growth over ten years.
- 16.8% consensus inflation-adjusted yield on today’s cost in 2034.
6.7% yield today, and potentially 17% yield on today’s investment in a decade.
Historical Returns Since 1998

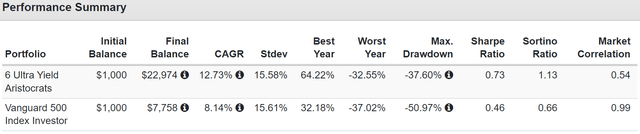
Portfolio Visualizer
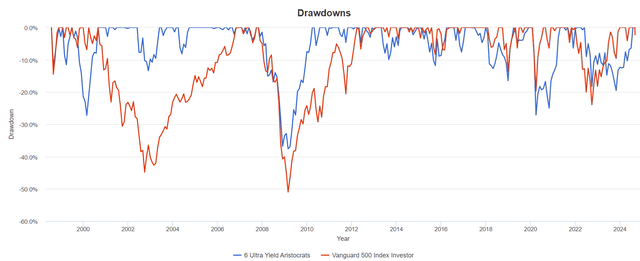
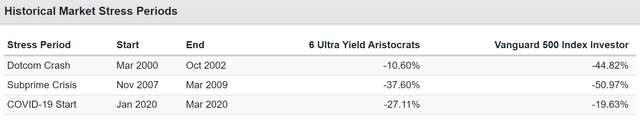
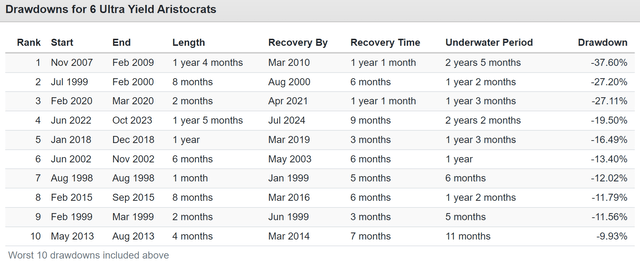
Over the last 26 years, these aristocrats, just six companies in three sectors, were as volatile as the S&P, though less volatile during the Great Recession, falling just 38%.
They delivered almost 100% better volatility-adjusted returns.
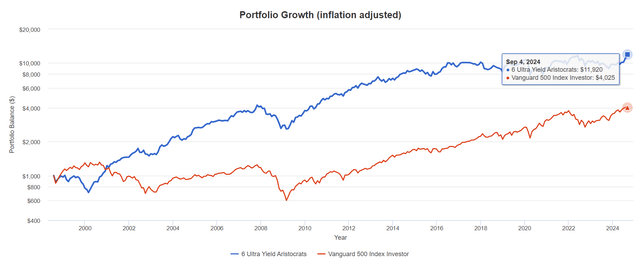
Portfolio Visualizer
They delivered 3X more inflation-adjusted wealth over time.

Portfolio Visualizer
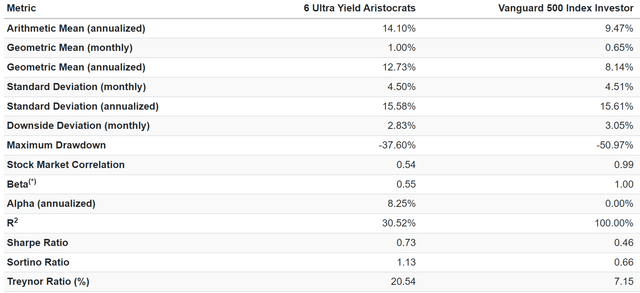
These aristocrats have a historical volatility of 55% of the S&P and outperformed their volatility-adjusted expected returns (alpha) by 8.25% annually over the last 26 years.
Their Treynor ratio (excess total return above risk-free bonds per unit of volatility) was 3X better than the S&P.
- The best hedge funds have a Treynor ratio of 17.
- They charge an average of 5% per year in fees.
- These aristocrats did even better, paying investors 6-7% to own them.

Portfolio Visualizer
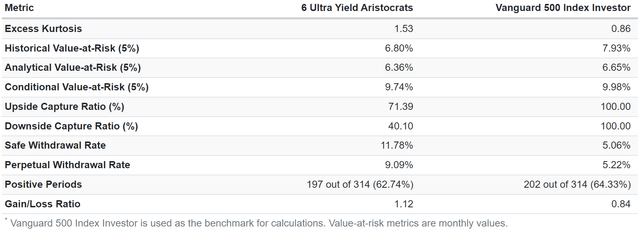
They captured 71% of the S&P’s upside in exchange for 40% of the market’s downside.
Their safe withdrawal rate was 9% per year, compared to the S&P’s 5% and 4% for the 60-40 stock/bond retirement portfolio.
Income Growth: Per $1,000 Invested In 1998

Portfolio Visualizer
| Metric | 10 FCF Magic Formula Dividend Blue-Chips | S&P |
| Total Income | $12,776.59 | $1,082.81 |
| Inflation-Adjusted Income | $6,552.10 | $555.29 |
| Starting Yield | 6.80% | 1.31% |
| Yield On Cost | 177.9% | 9.5% |
| Inflation-Adjusted Yield On Cost | 91.22% | 4.86% |
| Income Growth | 13.2% | 8.5% |
(Source: Portfolio Visualizer)
Behold the power of ultra-yield aristocrat investing.
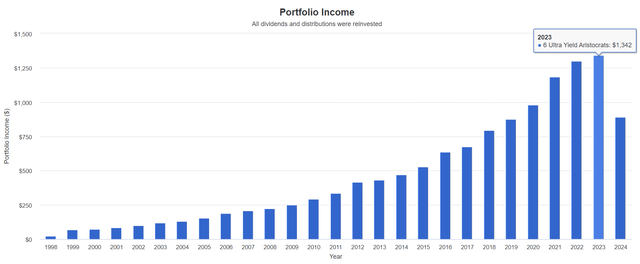
In 1998, these aristocrats yielded 6.8%. Today 6.7%.
They delivered 13% annual income growth for 26 years vs 11.9% consensus future income growth.
That’s why they delivered 13X more inflation-adjusted dividends than the S&P.
$1,000 invested in 1998 is now paying $912.20 per year in inflation-adjusted dividends, which are growing double digit (if you’re reinvesting the dividends and annually rebalancing).
- That $1,000 is worth $12K adjusted for inflation.
$1,000 invested in the S&P at the 1.3% yield (same as today) is paying $48.6 in inflation-adjusted annual dividends, about 4X less than the ultra-yield aristocrats.
Consensus 2026 Total Return Potential
- Not a forecast.
- Consensus return potential.
- These are the expected returns if and only if these companies grow as expected and return to historical fair value by the end of 2026.
- Fundamentals would justify that.
Average: 56% = 15.9% annually vs 35% or 12% annually S&P.
1-Year Fundamentally Justified Upside Potential: 20% vs 11% S&P.
British American (BTI) 2026 Consensus Return Potential
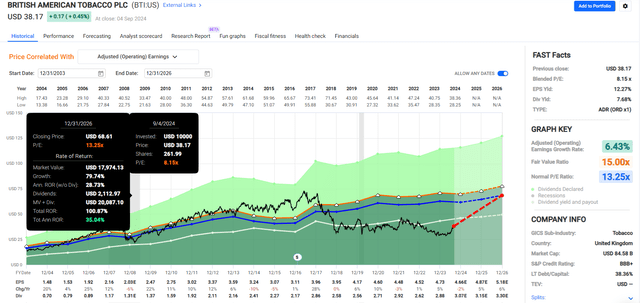
FAST Graphs, FactSet
Altria (MO) 2026 Consensus Return Potential


FAST Graphs, FactSet
Enterprise Products Partners (EPD) K1 Tax Form, 2026 Consensus Return Potential

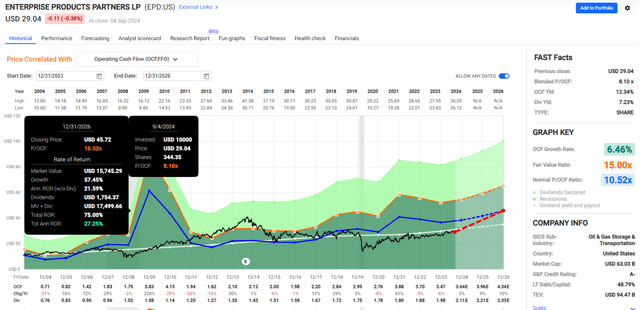
FAST Graphs, FactSet
Enbridge (ENB) 2026 Consensus Return Potential

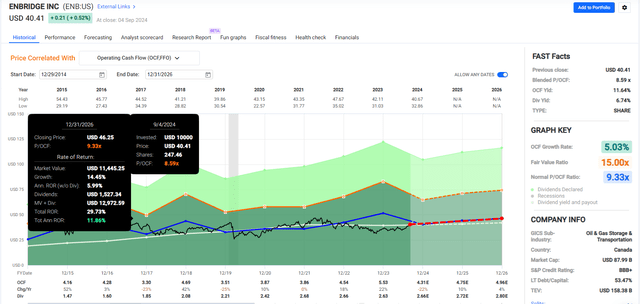
FAST Graphs, FactSet
TC Energy (TRP) 2026 Consensus Return Potential
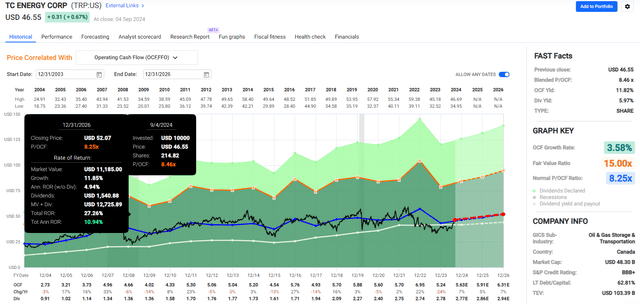
FAST Graphs, FactSet
Realty Income (O) 2026 Consensus Return Potential
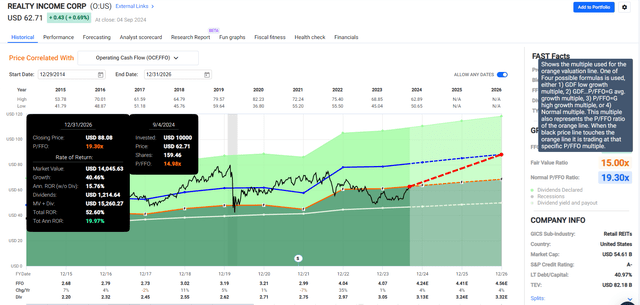
FAST Graphs, FactSet
Risk Profile: Why These Companies Aren’t Right For Everyone
These are not a complete portfolio. They’re six stocks in three sectors and three industries.
Owning just six companies in three sectors is possible, but it means a lot of sectors and company-specific risk.
You could technically own five Ultra SWANs in five sectors and nothing else, but it would still expose you to these company-specific risks.

Wide Moat Research
Safety and quality are ever-shifting with fundamentals.

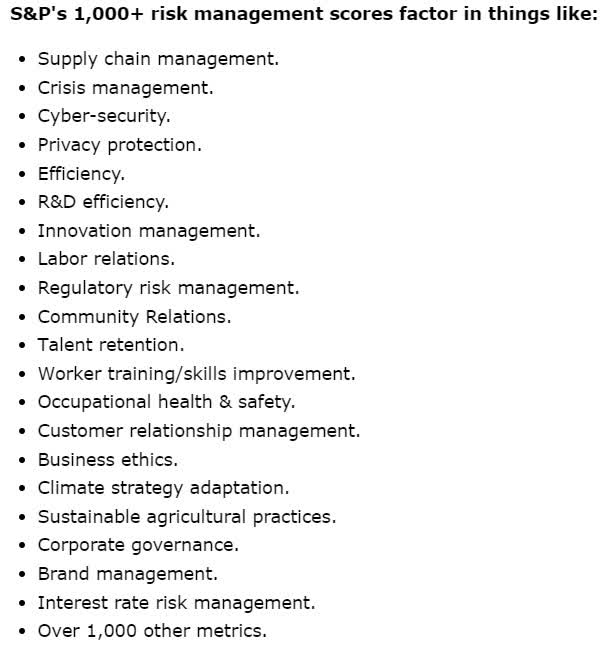
S&P
There are more than 1,000 kinds of risks management has to be aware of. Individual investors only have to understand how complex risk profiles are.

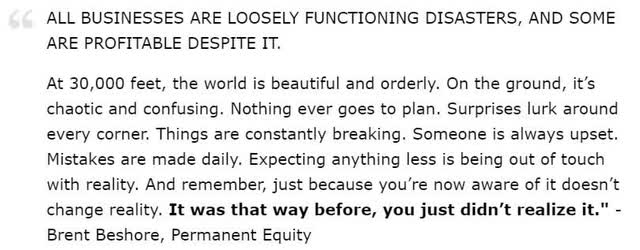
Brent Beshore
S&P has quantified comprehensive long-term risk better than anyone I’ve ever seen.
- Compares each company to the No. 1 industry leader on all risk metrics.
- Which allows for the calculation of the optimality of the total risk profile.
- And global percentiles for comparison purposes.
| S&P LT Risk Management Score | Rating |
| 0% to 9% | Very Poor |
| 10% to 19% | Poor |
| 20% to 29% | Suboptimal |
| 30% to 59% | Acceptable |
| 60% to 69% | Good |
| 70% to 79% | Very Good |
| 80+% | Exceptional |
| 6 Ultra Yield Aristocrats | 61% |
| Global Percentile | 84% |
(S&P)
These aristocrats are 61% optimal in risk management, meaning “61% as close to perfect risk management as is realistically possible.”
That translates to 84th percentile risk management, the top 16% of all global companies according to S&P.
However, supreme quality and exceptional risk management don’t mean these Ultra Sleep Well at Night aristocrats can’t be volatile.
SWAN status has nothing to do with volatility.
- No ultra-yield aristocrat is a true bond alternative and never was or will be.

Portfolio Visualizer
Low-volatility stocks in a bear market (for any reason) are not low-volatility when the S&P falls into a correction.

Portfolio Visualizer
When these aristocrats are not in company-specific bear markets, they tend to fall less during corrections.

Portfolio Visualizer
And this merely shows the corrections, not the annual returns.
Ultra Yield Aristocrats Negative Return Years
| 6 Ultra Yield Aristocrats | S&P 500 | ||
| Year | Inflation | Return | Return |
| 2008 | 0.09% | -32.55% | -36.81% |
| 1999 | 2.68% | -18.16% | 20.39% |
| 2018 | 1.91% | -16.49% | -4.56% |
| 2020 | 1.36% | -13.86% | 18.37% |
| 2015 | 0.73% | -7.53% | 1.25% |
| 1998 | 0.43% | -2.80% | 11.07% |
| 2023 | 3.35% | -1.02% | 26.19% |
| Average | -13.20% | 5.13% | |
| Median | -13.86% | 11.07% |
(Source: Portfolio Visualizer)
The average negative year for these aristocrats is a 5% gain for the S&P.
Ultra Yield Aristocrats Positive Return Years
| 6 Ultra Yield Aristocrats | S&P 500 | ||
| Year | Inflation | Return | Return |
| 2000 | 3.39% | 64.22% | -9.73% |
| 2003 | 1.88% | 44.38% | 28.17% |
| 2009 | 2.72% | 39.14% | 26.37% |
| 2019 | 2.29% | 31.07% | 31.22% |
| 2010 | 1.50% | 30.31% | 15.06% |
| 2024 | 2.54% | 25.06% | 16.65% |
| 2006 | 2.54% | 24.17% | 15.85% |
| 2004 | 3.26% | 23.73% | 10.70% |
| 2011 | 2.96% | 22.88% | 1.89% |
| 2016 | 2.07% | 22.38% | 12.00% |
| 2021 | 7.04% | 21.98% | 28.75% |
| 2001 | 1.55% | 20.84% | -11.76% |
| 2014 | 0.76% | 19.92% | 13.46% |
| 2005 | 3.42% | 19.05% | 4.83% |
| 2007 | 4.08% | 16.46% | 5.14% |
| 2012 | 1.74% | 15.24% | 15.99% |
| 2013 | 1.50% | 13.21% | 32.31% |
| 2002 | 2.38% | 9.75% | -21.59% |
| 2017 | 2.11% | 8.52% | 21.70% |
| 2022 | 6.45% | 4.92% | -18.17% |
| Average | 23.86% | 10.94% | |
| Median | 22.18% | 14.26% |
(Source: Portfolio Visualizer)
When these aristocrats are up (73% of years), they average a 24% gain.

(Source: Portfolio Visualizer)

(Source: Portfolio Visualizer)
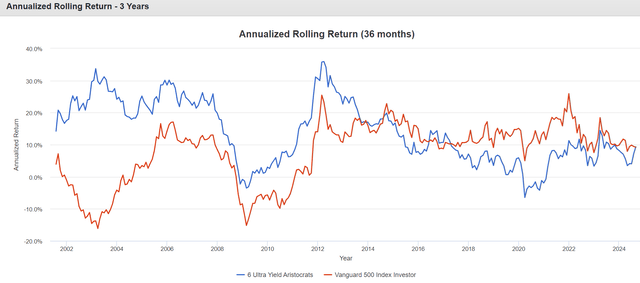
There are long periods of under and over-performance.
Anyone wanting to own individual stocks must be prepared for market envy and fear of missing out.
10% Worst Monthly Returns
| 6 Ultra Yield Aristocrats | S&P 500 | ||
| Year | Month | Return | Return |
| 2020 | 3 | -20.18% | -12.46% |
| 1998 | 8 | -12.02% | -14.12% |
| 2008 | 11 | -11.48% | -6.96% |
| 2022 | 9 | -10.82% | -9.24% |
| 2008 | 3 | -10.57% | -0.90% |
| 2008 | 10 | -9.63% | -16.52% |
| 2018 | 2 | -9.49% | -3.64% |
| 2022 | 6 | -9.04% | -8.25% |
| 2020 | 2 | -8.68% | -7.92% |
| 1999 | 12 | -8.42% | 5.63% |
| 1999 | 2 | -8.27% | -3.21% |
| 1999 | 10 | -7.85% | 6.41% |
| 2002 | 6 | -7.69% | -7.38% |
| 2023 | 5 | -7.49% | 0.46% |
| 2002 | 9 | -7.21% | -10.49% |
| 2009 | 2 | -7.02% | -10.74% |
| 2008 | 9 | -6.68% | -9.44% |
| 2021 | 11 | -6.37% | -0.80% |
| 2004 | 4 | -6.33% | -1.89% |
| 2018 | 12 | -6.21% | -8.79% |
| 2015 | 8 | -5.60% | -6.10% |
| 2010 | 5 | -5.59% | -7.95% |
| 2000 | 2 | -5.47% | -1.57% |
| 2015 | 11 | -5.47% | 0.37% |
| 2020 | 9 | -5.32% | -3.74% |
| 2016 | 10 | -5.28% | -1.73% |
| 2013 | 8 | -5.17% | -3.00% |
| 2013 | 5 | -5.15% | 2.36% |
| 2020 | 10 | -4.81% | -2.49% |
| 2012 | 5 | -4.70% | -6.01% |
| 2008 | 1 | -4.27% | -6.05% |
| 2008 | 6 | -4.27% | -8.35% |
| Average | -7.58% | -5.14% | |
| Median | -6.85% | -6.03% |
(Source: Portfolio Visualizer)
The 5% worst months average a 10% decline (the same as the S&P, but sometimes during different times).
10% Best Monthly Returns
| 6 Ultra Yield Aristocrats | S&P 500 | ||
| Year | Month | Return | Return |
| 2000 | 12 | 12.43% | -0.52% |
| 2019 | 1 | 11.86% | 8.01% |
| 2020 | 11 | 11.27% | 10.88% |
| 2003 | 5 | 10.59% | 5.48% |
| 2000 | 8 | 10.50% | 6.60% |
| 2009 | 7 | 10.03% | 7.46% |
| 2004 | 11 | 10.02% | 4.45% |
| 2021 | 3 | 9.85% | 4.54% |
| 2009 | 5 | 9.70% | 5.85% |
| 2007 | 10 | 9.60% | 1.36% |
| 2015 | 10 | 9.27% | 8.51% |
| 2022 | 10 | 9.25% | 8.13% |
| 2016 | 6 | 8.92% | 0.35% |
| 2020 | 4 | 8.91% | 12.70% |
| 2024 | 7 | 8.34% | 1.21% |
| 2000 | 3 | 8.18% | 9.69% |
| 2022 | 1 | 8.07% | -5.27% |
| 2009 | 4 | 7.69% | 9.93% |
| 2023 | 11 | 7.69% | 9.13% |
| 2000 | 4 | 7.57% | -3.51% |
| 2010 | 7 | 7.41% | 6.83% |
| 2010 | 3 | 7.38% | 6.09% |
| 2000 | 5 | 7.37% | -1.57% |
| 2016 | 3 | 7.36% | 6.72% |
| 1999 | 4 | 7.35% | 3.80% |
| 2011 | 10 | 7.28% | 10.91% |
| 2024 | 8 | 7.27% | 2.34% |
| 2001 | 2 | 6.91% | -9.54% |
| 2006 | 7 | 6.82% | 0.49% |
| 2010 | 9 | 6.78% | 8.96% |
| 2021 | 12 | 6.28% | 4.63% |
| 2000 | 10 | 6.23% | -0.47% |
| Average | 8.57% | 4.51% | |
| Median | 8.13% | 5.67% |
(Source: Portfolio Visualizer)
The best months can be when the market is down, just like some of the worst months are when the market is up.
If you own individual stocks, you must be willing to handle your portfolio’s zigging when the market zigs, both to the upside and the downside.
Bottom Line: The 6 Best Ultra Yield Aristocrats To Buy While You Still Can
Don’t get me wrong. I’m not saying that these ultra-yield aristocrats will go up in most down markets as they have this time.
They sometimes pull that impressive feat off, but it’s an exception, not the rule.
However, momentum traders might soon embrace these six companies if falling interest rates trigger a major rotation out of growth and into ultra-yield value (like these aristocrats).
And while it’s very unlikely that we’ll ever see zero rates again, and thus the kind of irrational TINA trade bubble like in 2017, the natural cycle of undervalued to overvalued and back again is eternal.
As long as irrational humans (or just computer algos with different goals) control the stock market, you’ll always be able to make your own luck on Wall Street.


")


")

