


")


Summary
Long duration treasuries have been steadily declining over the last few years due to deteriorating fundamentals and selling pressure from increased treasury issuance. We believe in the next 2 months, there are additional down-side catalysts facing long duration treasuries including (1) a planned spike in long-duration treasury issuance in August and (2) the risk of an additional increase in planned long-duration treasury issuance as part of the July 31 Quarterly Refunding Announcement. Our preferred way to position for these catalysts is using leveraged inverse treasury bond ETFs, specifically -2x ProShares UltraShort 20+ Year Treasury ETF (NYSEARCA:TBT).
Long Duration Treasuries Have Been In A 5-Year Drawdown
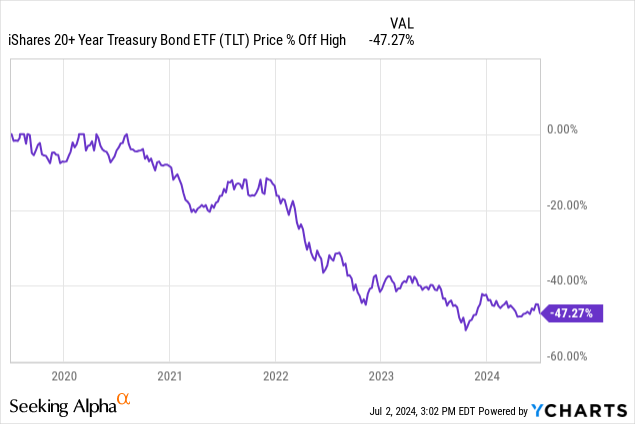
Long duration treasuries have been in a 5-year drawdown following the emergence of higher than expected inflation, largely attributed to the COVID era fiscal stimulation. This drawdown was particularly acute between 2020 and 2023. For the last 1-year period starting in 2023 H2, long duration treasuries price movement has been overall flat, albeit with some periodic volatility. This price action can be most notably seen in the popular iShares 20+ Year Treasury Bond ETF (TLT) as shown below.

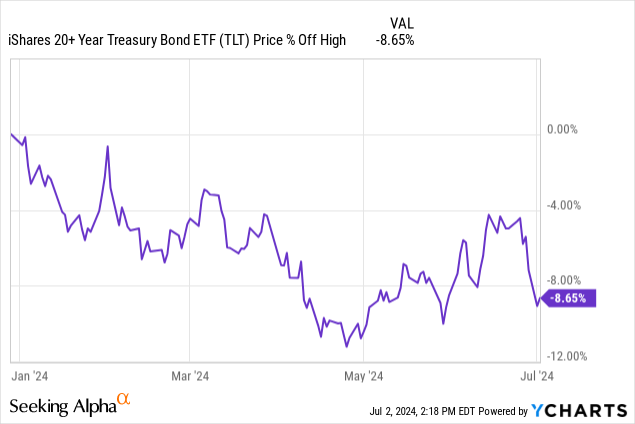
Zooming into the YTD price action, long duration treasuries represented by (TLT) rallied in May and June, followed by a sharp recent reversal bringing the YTD drawdown to -8.65% at the time of writing.
High Issuance Rates Of Long Duration Treasuries Create Selling Pressure
Long duration treasuries face continued selling pressure due to high rates of issuance from the Treasury. This is in the face of challenging fundamentals, including potentially sticky inflation and negative term premium. For some context, over the last 5 years, the US Treasury has more than doubled the amount of outstanding bonds with more than 10 years to maturity.
The increase in long-duration treasury debt can be seen in the following chart, which shows the par value outstanding in $T of marketable treasury debt by duration. The colored bars compare the values between 6/30/2018 (red) and 5/31/2024 (blue). The remaining duration is calculated as the difference between the record date and the maturity date of the treasury security, which we believe is a more meaningful measure of duration risk vs. the duration at issuance. This data is extracted from the US Treasury Monthly Statement of Public Debt Detail of Marketable Treasury Securities Outstanding dataset.
Author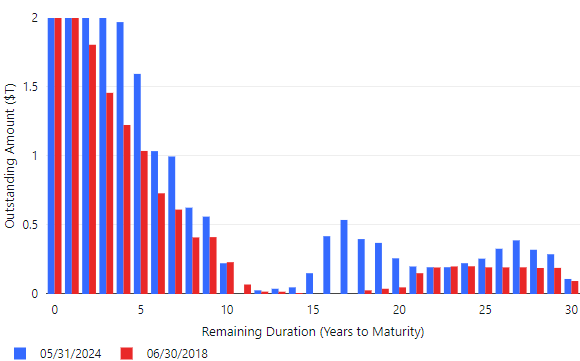

Comparison of outstanding marketable treasuries by remaining duration between 5/31/2024 and 6/30/2018 based on the Monthly Statement of Public Debt Detail of Marketable Treasury Securities Outstanding dataset.
From this chart, one can see that the remaining duration of marketable securities has a barbell profile. The majority of marketable treasuries are either (1) 10yrs from maturity or less (2) 15 years or more to maturity. There is a ~5yr duration gap between 10 and 15 years to maturity. Given this barbell profile, we will define debt with maturities greater than 10 years remaining as long-duration debt. This choice of definition provides an easy way to look at the long duration portion of the barbell profile.
The chart below, also based on the US Treasury Monthly Statement of Public Debt Detail of Marketable Treasury Securities Outstanding dataset, shows the monthly level of long duration (>10yr remaining duration) debt for the last 6 years along with the annualized growth rate of the debt. During this time period, long duration debt grew by ~140% from an initial level of $2T. Growth topped out at a rate of 25%/yr in 2021 and has recently leveled off to 11%/yr ($500B/yr).
Author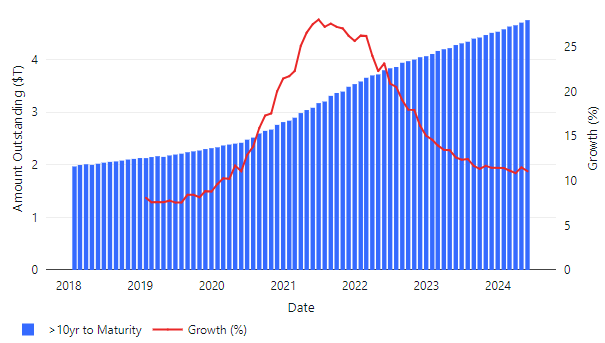

Growth in long duration (>10 years remaining to maturity) treasuries outstanding over last 6 years based on the US Treasury Monthly Statement of Public Debt Detail of Marketable Treasury Securities Outstanding dataset.
Multiple Catalysts For A Sell Off On The Horizon
The treasury provides guidance on future bond issuance 6 months into the future through its Quarterly Refunding Announcement process. The most recent Quarterly Refunding Announcement is shown in graphical form below for long duration Treasuries. Since we are defining long duration as > 10 years, the only bonds included in this chart are 20yr bonds, 30yr bonds, and 30yr TIPS. All other issuance is <=10yr in duration and therefore excluded.
Author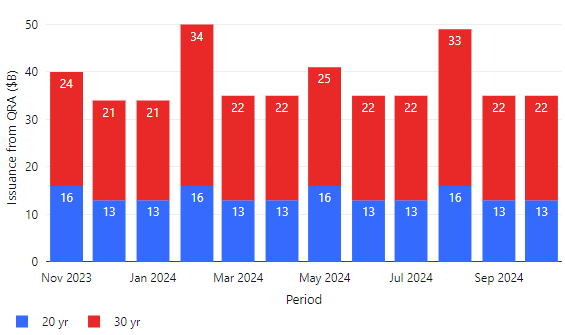

Long duration (>10yr) treasury issuance from May 2024 Quarterly Refunding Announcement TBAC Recommended Financing Table by Refunding Quarter
Based on the most recent Quarterly Refunding Announcement, issuance will continue at the $500B/yr annualized rate in the next quarter. However, on an individual month basis, August will be an unusually high issuance month with planned long duration issuance of $49B ($16B 20yr bonds and $33B 30yr bonds). This is significantly higher than the typical long-duration issuance of $35B/month and could provide a near-term catalyst for a bond sell off especially if the August auction results for the long-duration bonds come in weak.
Another potential catalyst is a revision higher in the recommended long-duration treasury issuance rate in the next Quarterly Refunding Announcement, which is scheduled to be released on July 31. We will be watching this closely to see if the recommended long-duration treasury issuance is raised higher than the current $500B/yr run rate. We believe the balance of risks is skewed to the upside that long-duration issuance could be increased since the projected 2024 deficit increased by $400B in the most recent release of the Congressional Budget Office Budget and Economic Outlook:
In CBO’s current projections, the deficit for 2024 is $0.4 trillion (or 27 percent) larger than it was in the agency’s February 2024 projections, and the cumulative deficit over the 2025–2034 period is larger by $2.1 trillion (or 10 percent). The largest contributor to the cumulative increase was the incorporation of recently enacted legislation into CBO’s baseline, which added $1.6 trillion to projected deficits. That legislation included emergency supplemental appropriations that provided $95 billion for aid to Ukraine, Israel, and countries in the Indo-Pacific region. By law, that funding continues in future years in CBO’s projections (with adjustments for inflation), boosting discretionary outlays by $0.9 trillion through 2034.
Leveraged Inverse Bond ETFs Are Our Preferred Trade
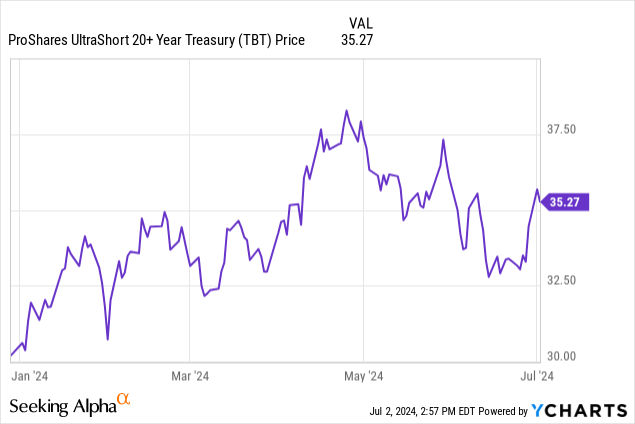
With long-duration treasury issuance set to spike in August and the risk of an upward revision in long-duration treasury issuance in the upcoming 7/31 Quarterly Refunding Announcement, we believe long duration treasuries could test recent lows. Using TLT as a proxy, in this scenario TLT could sell off from 90 to 84 (7% decline). Our preferred way to position for this move is using leveraged inverse treasury bond ETFs: -2x ProShares UltraShort 20+ Year Treasury ETF (TBT) or -3x Direxion Daily 20+ Year Treasury Bear 3X Shares ETF (TMV). We prefer -2x as it offers potentially higher returns vs. -1x Short 20+ Treasury ETF (TBF) but has lower risk vs -3x, which has higher volatility and incurs larger background losses associated with rebalancing of leveraged funds during changes in price move directions. For -2x leveraged TBT, a 7% decline in TLT would translate to a 14% increase in TBT, giving a price target of $40 in the July / August timeframe (price chart below for reference).
Risks And Hedges
The main risk to this short thesis is that long duration treasuries could rally and inverse ETFs such as TBF, TBT, and TMV could incur losses. We see two specific potential risks that could cause a rally in long duration bonds: (1) a major slowdown in growth or other deflationary event, which tends to be bullish for bonds or (2) rising foreign demand associated with falling foreign interest rates and increasing attractiveness of dollars. The risk of (1) can be hedged by going long short duration bonds, which can be achieved through short duration bond ETFs such as the 1-3 Year Bond ETF (SHY). Note that short duration bonds are much less sensitive to interest rate moves vs. long duration bonds, so one would require a larger ratio of short duration bonds vs. an inverse long duration position to provide an adequate hedge. The risk of (2) can be hedged by taking a long position in US dollars vs. foreign currencies, which can also be achieved through ETFs such as the WisdomTree Bloomberg U.S. Dollar Bullish Fund (USDU). Finally, these risks can also be partially mitigated by time-bounding the short trade to only the next two months, in which we foresee specific catalysts of unusually high issuance and a potential upward issuance revision in the Quarterly Refunding Announcement.


")


